


Gold vs Copper: Will the Ratio Reject or Confirm the Breakout?
Gold (XAUUSD) has broken decisively above a long-standing ascending channel, signaling a potential shift in its long-term structure. The breakout emerged after an extended consolidation phase marked by inverse head-and-shoulders formation. This upward surge has pushed gold toward key extension levels. At the same time, the gold-to-copper ratio is approaching resistance within a broadening wedge, highlighting an important intermarket test. This alignment of key technical signals suggests that gold may be entering a pivotal phase, where sustained strength could trigger a broader revaluation across hard assets.
Gold Breaks Above Long-Term Channel and Approaches Key Extension Zone
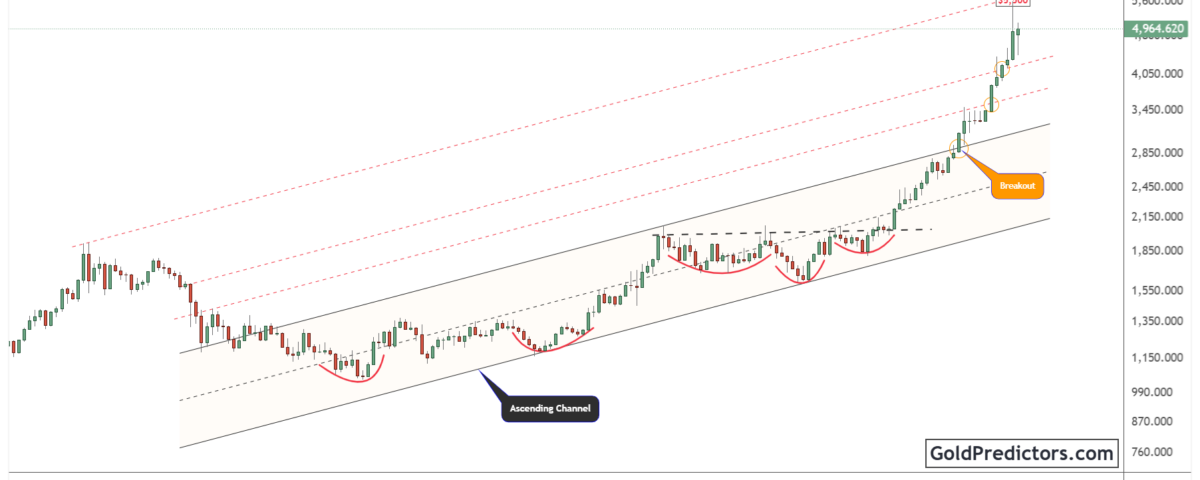
The gold chart below shows a well-defined ascending channel that has shaped price action for more than a decade. Following a multi-year consolidation between 2013 and 2019, gold initiated a strong upward move. That rally eventually lost momentum, triggering a prolonged phase of stabilization. During this period, gold formed a broad base while continuing to hold within the channel structure.
In 2025, gold initiated a breakout as price surged above the upper boundary of the long-term ascending channel. The move triggered a strong rally, with gold advancing through multiple trend-based extension levels marked by red dashed lines. These projections are derived from the original structure of the channel. Most recently, gold approached the region just below the $5,500 mark, where upward momentum appears to be slowing.
Furthermore, the base featured several inverse head-and-shoulders formations that helped validate the underlying support for the breakout. These rounded patterns marked periods of accumulation that supported successive moves to higher highs. Additionally, the breakout aligned with growing expectations for U.S. monetary easing, increased safe-haven flows, and falling real yields, all of which contributed to the bullish momentum. Still, the sharp pace of the recent advance raises the likelihood of a near-term pause or corrective move before the next upward phase.
Gold-to-Copper Ratio Nears Key Reversal Zone in Wedge Formation
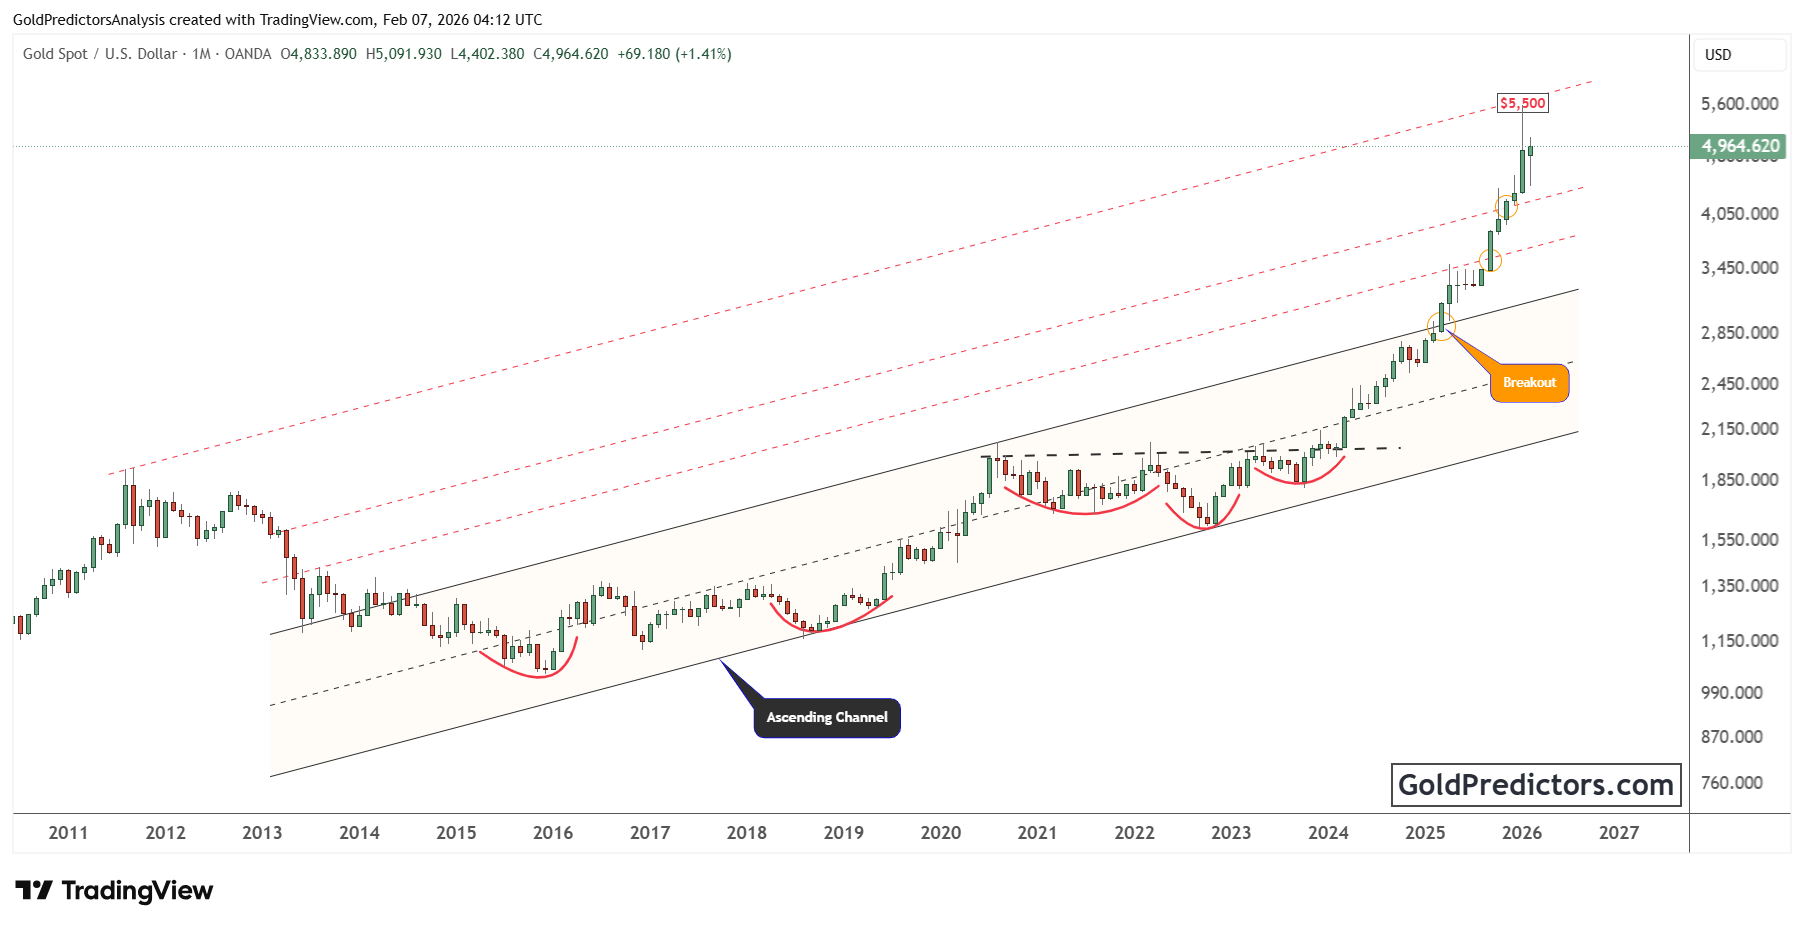
The chart below shows the long-term gold-to-copper ratio (XAU/XCU), an important intermarket indicator that highlights the balance between monetary assets and industrial commodities. The structure has formed a broadening wedge pattern, defined by rising highs and lows alongside expanding volatility. This formation has evolved over the past 14 years, and the ratio is once again approaching the upper boundary of the wedge.
Each prior approach to the upper boundary, highlighted by red arrows, has resulted in significant reversals in the ratio, often followed by phases of copper outperformance. These turning points occurred in 2011, 2016, 2020, and now once again in early 2026. The blue arrows mark those reversal periods, illustrating how gold has repeatedly retreated relative to copper after reaching this resistance zone.
Currently, the ratio trades just below the 900 level and remains elevated near long-term resistance. If history repeats, this region could act as a ceiling, resulting in either a cooling of gold’s relative strength or a rebound in copper. However, a confirmed breakout above this resistance would signal a more profound shift, possibly linked to broader monetary instability or declining industrial demand. That would favor continued gold outperformance on both an absolute and relative basis.
Gold Outlook: Structural Shift Underway as Channel Breakout Aligns with Ratio Test
Gold’s breakout above the decade-long ascending channel signals the beginning of a structural shift. This move follows years of accumulation and pattern development, including multiple inverse head-and-shoulders formations that strengthened the foundation for the breakout. Rising expectations for monetary easing, along with safe-haven demand and falling real yields, created the ideal backdrop for this acceleration. Although the rally has temporarily lost momentum near the $5,500 zone, the broader uptrend remains intact.
At the same time, the gold-to-copper ratio is nearing the upper boundary of its 14-year broadening wedge pattern. Historically, this level has triggered reversals in favor of copper, often marking key turning points in intermarket dynamics. If the ratio fails to break higher, it could lead to a temporary pullback in gold’s relative strength. However, a clean breakout above this zone would suggest a deeper macro realignment, potentially driven by declining industrial demand or rising global monetary stress.
This combination of patterns signals a potential shift in gold’s long-term behavior. The confirmed breakout above the long-term channel suggests a shift toward higher structural valuation, while the ratio’s position at resistance adds a layer of intermarket tension. Whether gold continues to lead or pauses in the near term will depend on how these formations unfold. The outcome will shape not only gold’s next phase but also its relative standing within the broader commodity complex.
Gold Predictors Premium Membership
Get exclusive short-term and swing trade ideas with precise entry levels, stop-loss, and target prices, including justification and analysis — all delivered directly via WhatsApp.
Our premium service includes deep technical analysis on gold and silver markets. We cover cycle analysis, price forecasting, and key timing levels.
Members also receive a weekly market letter with detailed analysis, commentary from our Chief Analyst, including actionable insights, trade timing, and direction forecasts for gold and silver.
Stay ahead of the market — join our premium community today.


