Gold Confirms Multi-Decade Breakout as S&P 500 Ratio Signals Shift to Hard Assets
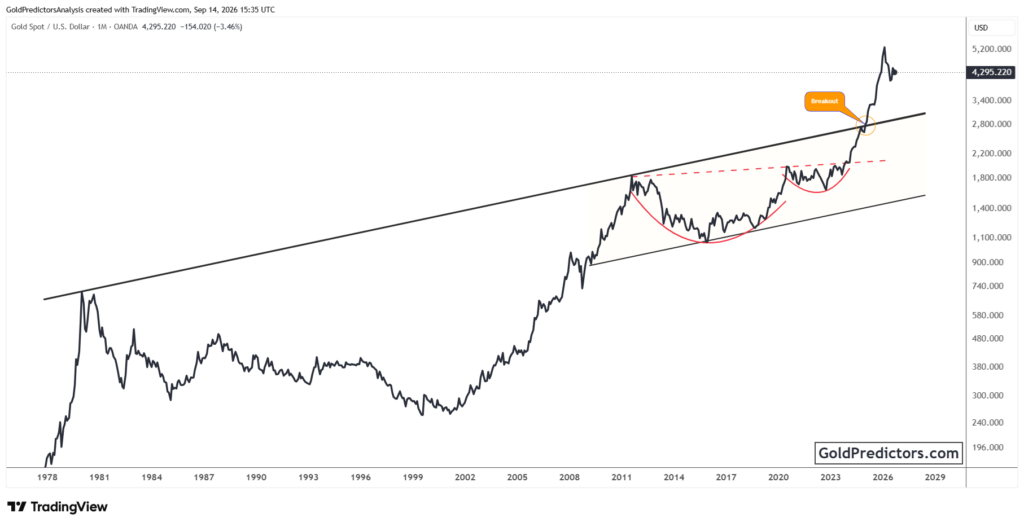
Gold (XAUUSD) has completed a decisive breakout, ending a decades-long wedge pattern that has shaped its price action since the early 1980s. After repeatedly testing resistance near the 1980 and 2011 peaks, the metal has now surged above the $2,075 level, entering a new phase of upward acceleration. This move ends a prolonged consolidation and signals the start of a vertical expansion. At the same time, the Gold-to-S&P 500 ratio has broken through a long-standing resistance trendline, confirming a shift in relative strength away from equities. These developments point to the start of a structural bull market in gold, supported by both technical resolution and capital rotation into hard assets.
Gold Exits Multi-Year Wedge as Prices Climb Past Historic Highs
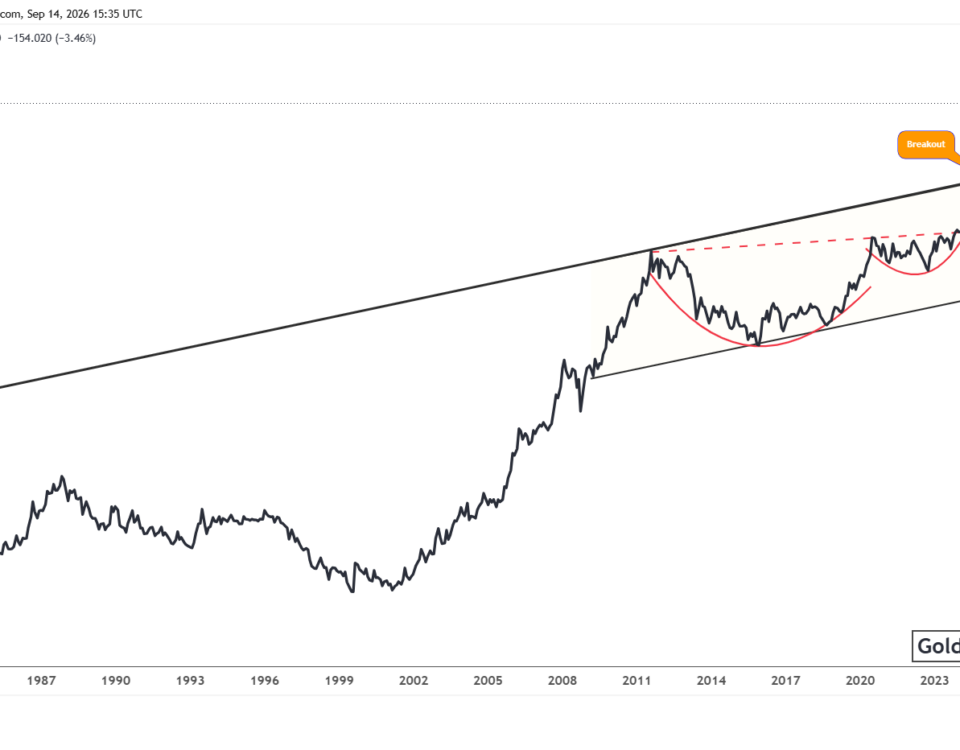
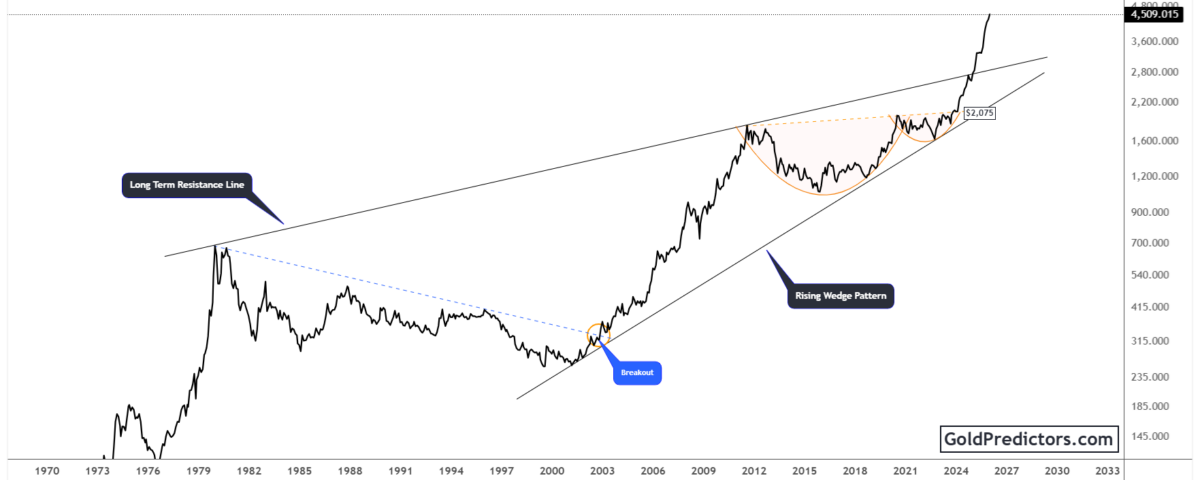
The gold chart below shows a consistent long-term rising wedge pattern that has guided price action since the early 1980s. Price has respected two key technical levels throughout this period. These include a rising support line that began in 2000 and a broad resistance zone defined by the 1980 peak. For decades this upper boundary limited gold’s upside, including the 2011 rally that stalled just below $1,920.
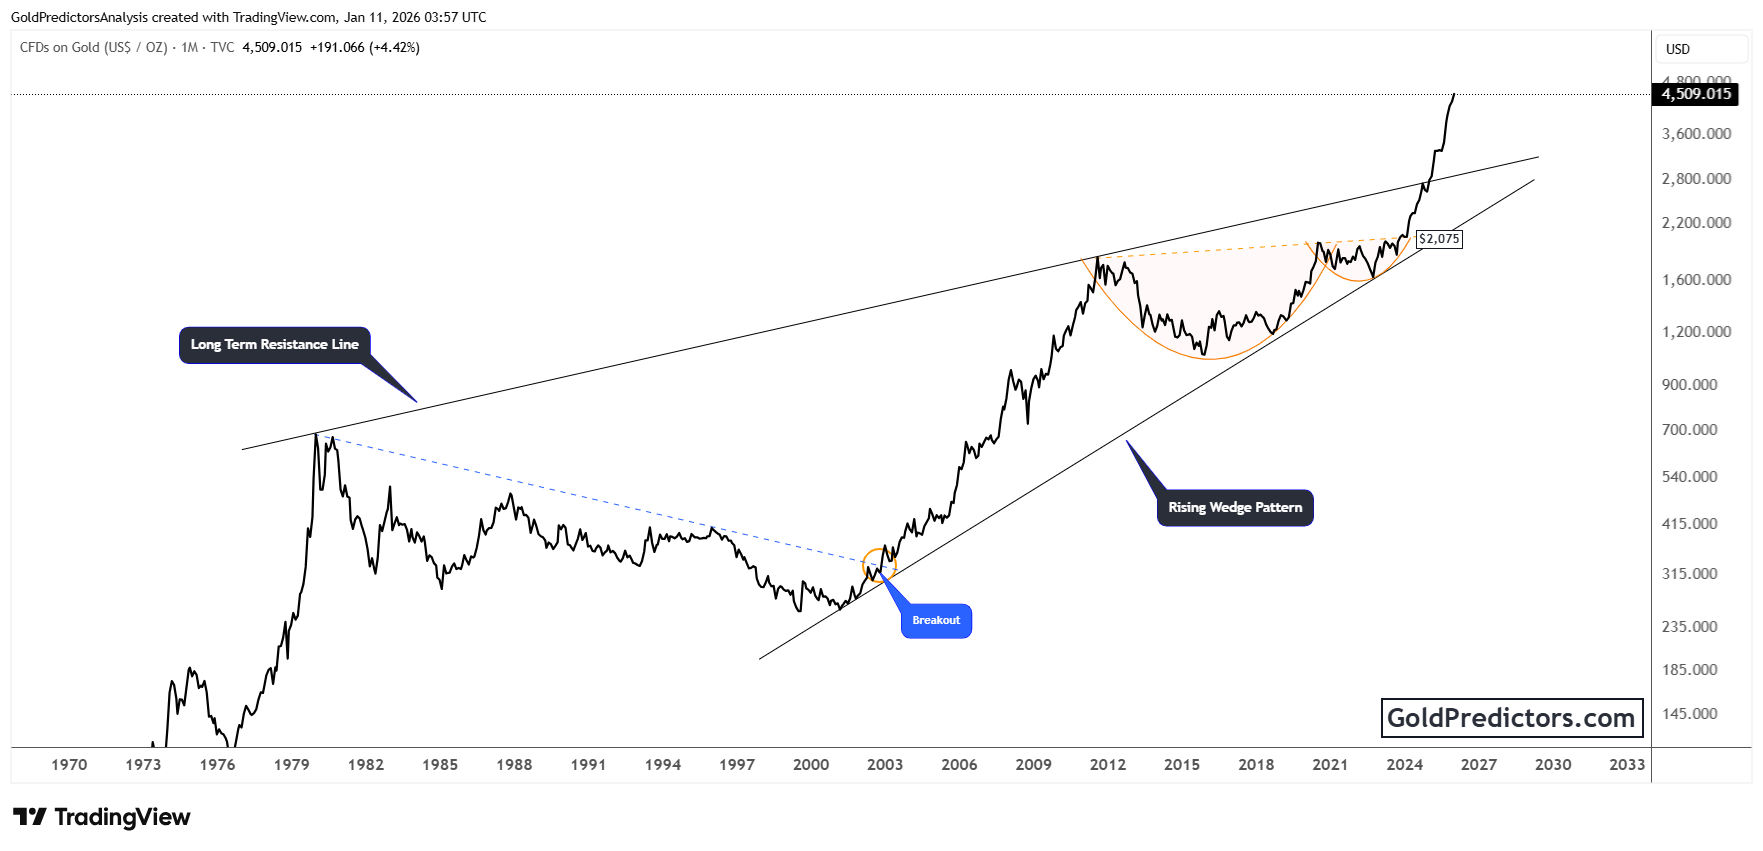
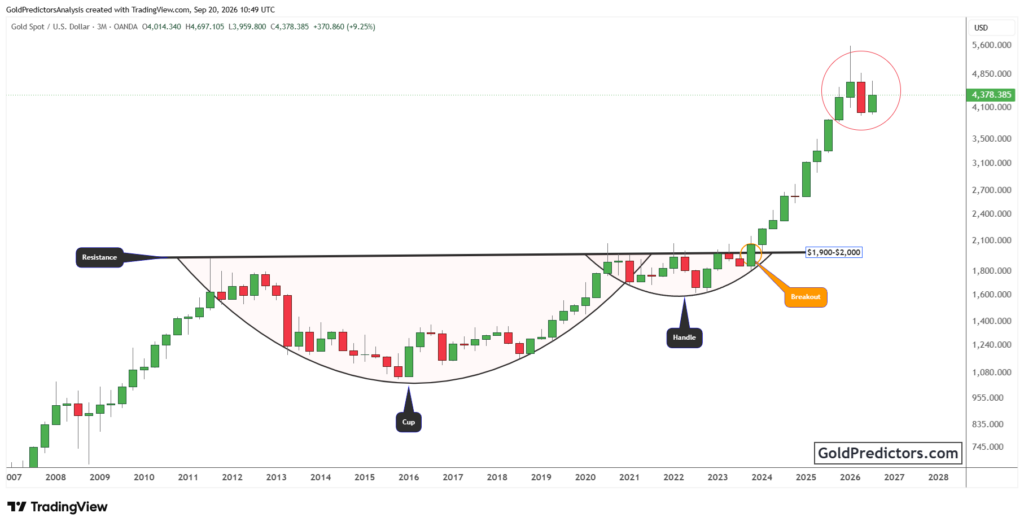
A major turning point occurred in the early 2000s when gold broke out from a falling trendline that had defined the downtrend since 1980. That breakout initiated a structural bull market, eventually pushing prices toward the top of the rising wedge pattern. After forming a multi-year cup and handle within this wedge, gold has now moved decisively above the upper boundary, confirming a major breakout.
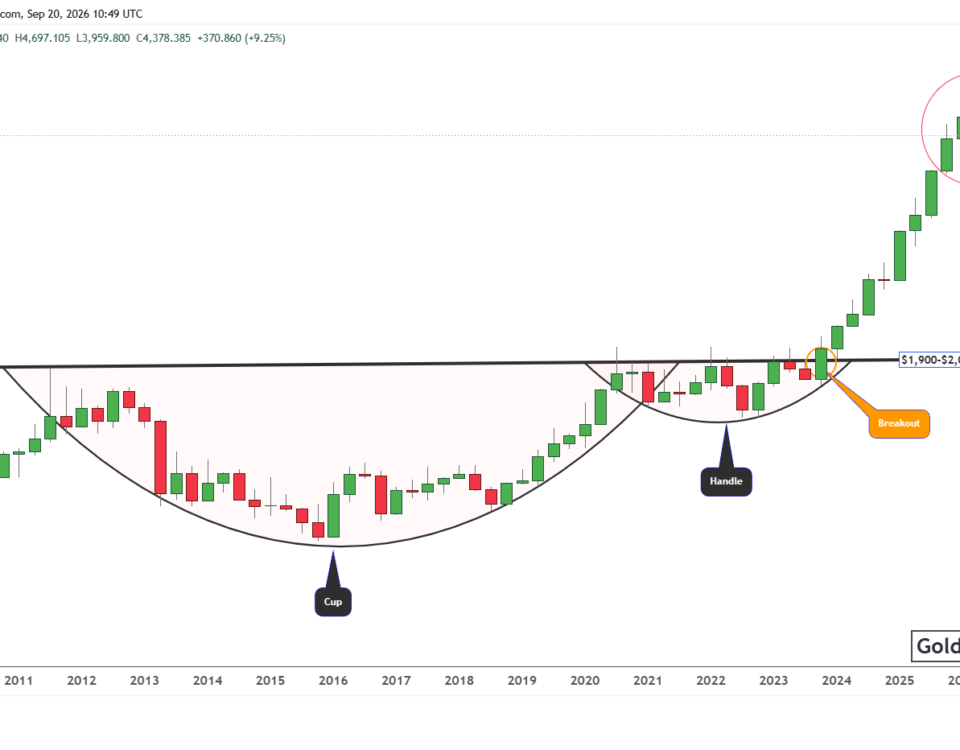
After years of consolidation beneath the 2,075 level, gold has finally broken above a key resistance zone and entered a new phase of upward momentum. This breakout confirms the end of a multi-year consolidation and signals the start of a vertical price expansion. Gold is now trading above $4,300, far above previous highs. This move marks a long-awaited breakout from the rising wedge, supported by strong macro tailwinds and renewed global demand for safe-haven assets.
Gold Outperforms Equities as Ratio Breaks Through Key Resistance
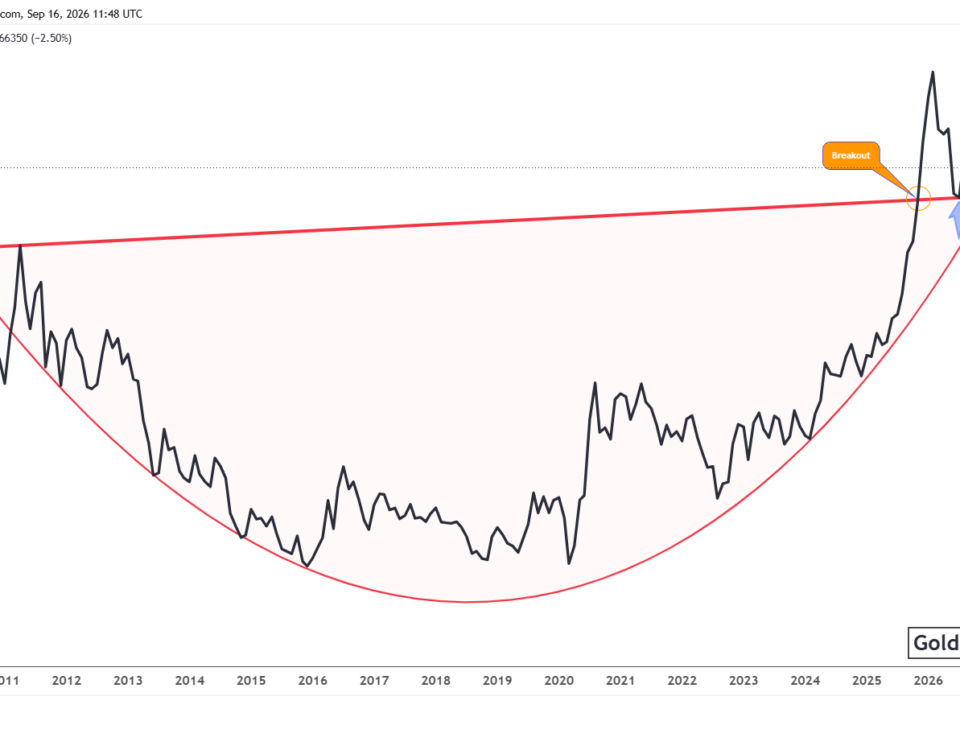
The chart below shows the Gold-to-S&P 500 ratio on a monthly timeframe, illustrating a long-term basing formation and a potential structural breakout. After a prolonged downtrend from its 2011 peak, the ratio carved out a series of rounded bottoms, signaling a gradual accumulation phase. Each trough marked a distinct low in 2018, 2021, and 2024, highlighting growing support for gold relative to equities during periods of macro uncertainty.
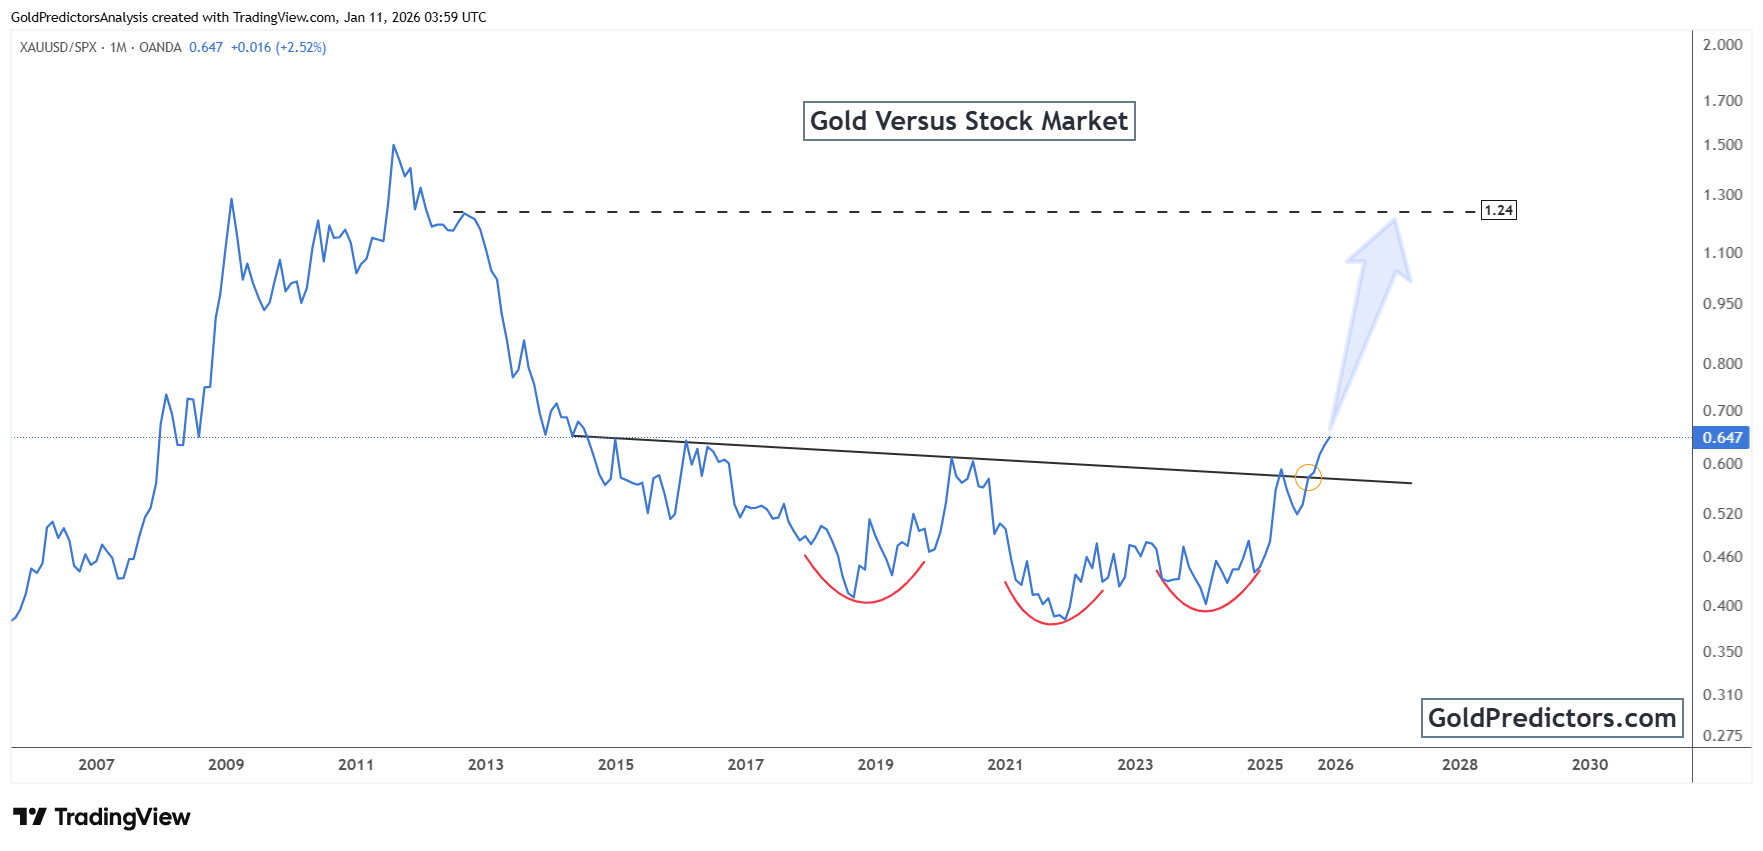
Moreover, a descending trendline served as key resistance for more than a decade, capping each rally in the ratio. That barrier has now been decisively broken, with the ratio closing above the trendline near 0.60. This move signals a shift in long-term momentum, suggesting that gold is beginning to outperform equities. It also carries significant structural weight, pointing to a major change in relative strength.
With the neckline now broken, the chart projects a potential upward target near 1.24, which corresponds to prior highs seen during the 2011 gold bull market. This level marks a potential revaluation zone where gold could begin to significantly outperform equities. The extended base, combined with the confirmed breakout and clear projection, signals the possible start of a new cycle favoring hard assets over financial assets.
Conclusion: Gold Confirms Structural Bull Market With Technical and Macro Breakouts
Gold has entered a powerful new phase, backed by both long-term chart structure and relative strength indicators. The decisive breakout from its rising wedge pattern ends years of consolidation and confirms a bullish continuation. With key resistance broken, gold is now trading firmly above $4,300. This breakout signals the start of a sustained upward cycle, driven by technical strength and macro support.
At the same time, the Gold-to-S&P 500 ratio has also broken above a decade-long resistance trendline. This move reflects a broader shift in market sentiment away from risk assets and toward tangible stores of value. The ratio’s rounded bottoms and upward breakout point to growing momentum in favor of gold over equities.
These technical breakouts mark the start of a new bullish cycle. Structural patterns have resolved to the upside, while macro conditions continue to support hard assets. Gold is holding firm above key resistance, with relative strength shifting in its favor. This combination of technical strength and macro support positions gold for sustained gains in the years ahead.
Gold Predictors Premium Membership
Get exclusive short-term and swing trade ideas with precise entry levels, stop-loss, and target prices, including justification and analysis — all delivered directly via WhatsApp.
Our premium service includes deep technical analysis on gold and silver markets. We cover cycle analysis, price forecasting, and key timing levels.
Members also receive a weekly market letter with detailed analysis, commentary from our Chief Analyst, including actionable insights, trade timing, and direction forecasts for gold and silver.
Stay ahead of the market — join our premium community today.