


Gold Surges Above Multi-Decade Ceiling as Equities Lose Ground
Gold (XAUUSD) has broken through a 45-year resistance line, marking a historic shift in its long-term structure. This breakout follows decades of compression and confirms a massive cup and handle formation. Strong macro tailwinds and technical momentum now support a sustained move higher. At the same time, the Dow-to-Gold ratio has collapsed, signaling a clear rotation from equities into hard assets. These developments point to the beginning of a powerful secular bull market in gold.
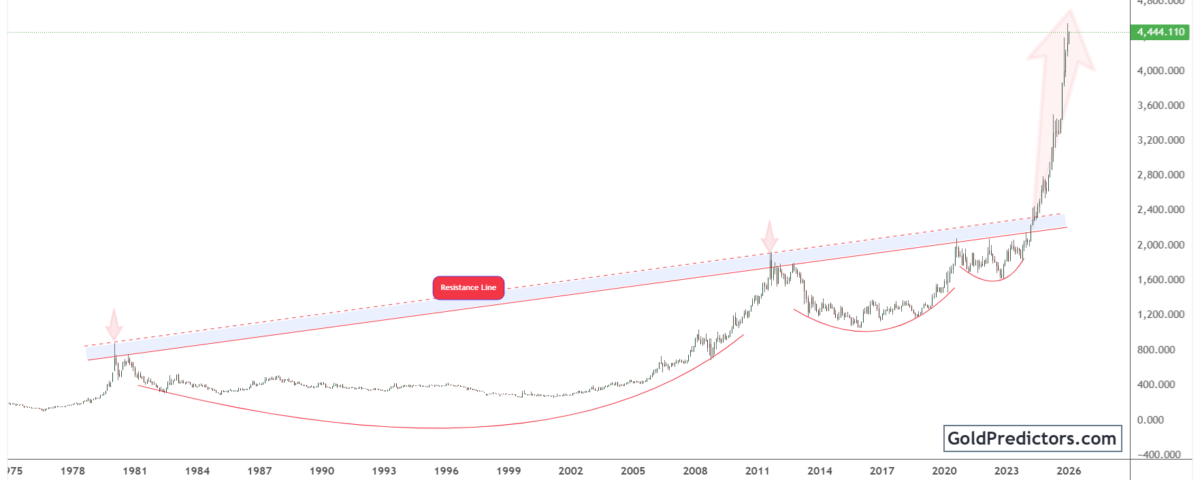
Gold Breaks Multi-Decade Resistance, Triggers Long-Term Upside Potential
The gold chart below shows a decisive breakout from a long-standing resistance line. After decades of compression beneath this ceiling, gold has finally surged through with strong momentum. This line had previously rejected multiple major rallies, each followed by prolonged consolidation. Over time, these patterns formed the base of a massive cup and handle formation that spanned more than four decades.
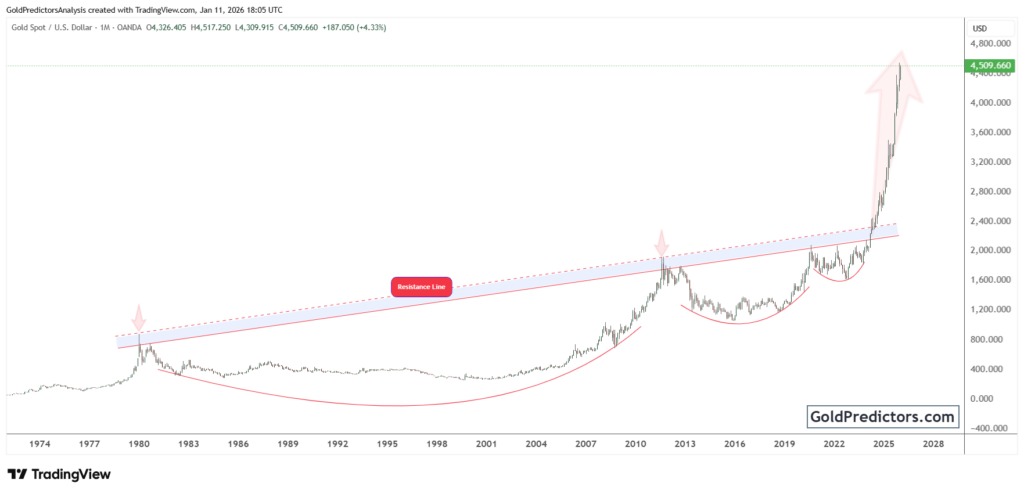
A unique combination of macro forces set the stage for gold’s long-awaited breakout. Unlike past cycles, the metal sustained consistent upward pressure as macro imbalances deepened. Loose monetary policy, rising debt levels, and aggressive central-bank gold accumulation created ideal conditions. In 2025, gold cleared its long-standing resistance and surged past $4,500. The move was backed by strong volume and a sharp upward surge, signaling the start of a structural regime shift.
Technically, this breakout unlocks a new price discovery phase. The massive formation signals substantial long-term upside well beyond the prior consolidation range. The upside move is now guided by momentum, policy tailwinds, and a changing global monetary order. With the resistance line now acting as support, pullbacks are likely to be shallow and short-lived.
Gold Outshines Stocks as Dow-to-Gold Ratio Breaks Key Support
The chart below shows the Dow-to-Gold ratio, which tracks the performance of the Dow Jones Industrial Average relative to gold. This ratio provides insight into how capital rotates between equities and hard assets. Since peaking in the late 1990s, it has remained in a long-term downtrend. Each failed rally has resulted in lower highs beneath a declining trendline.
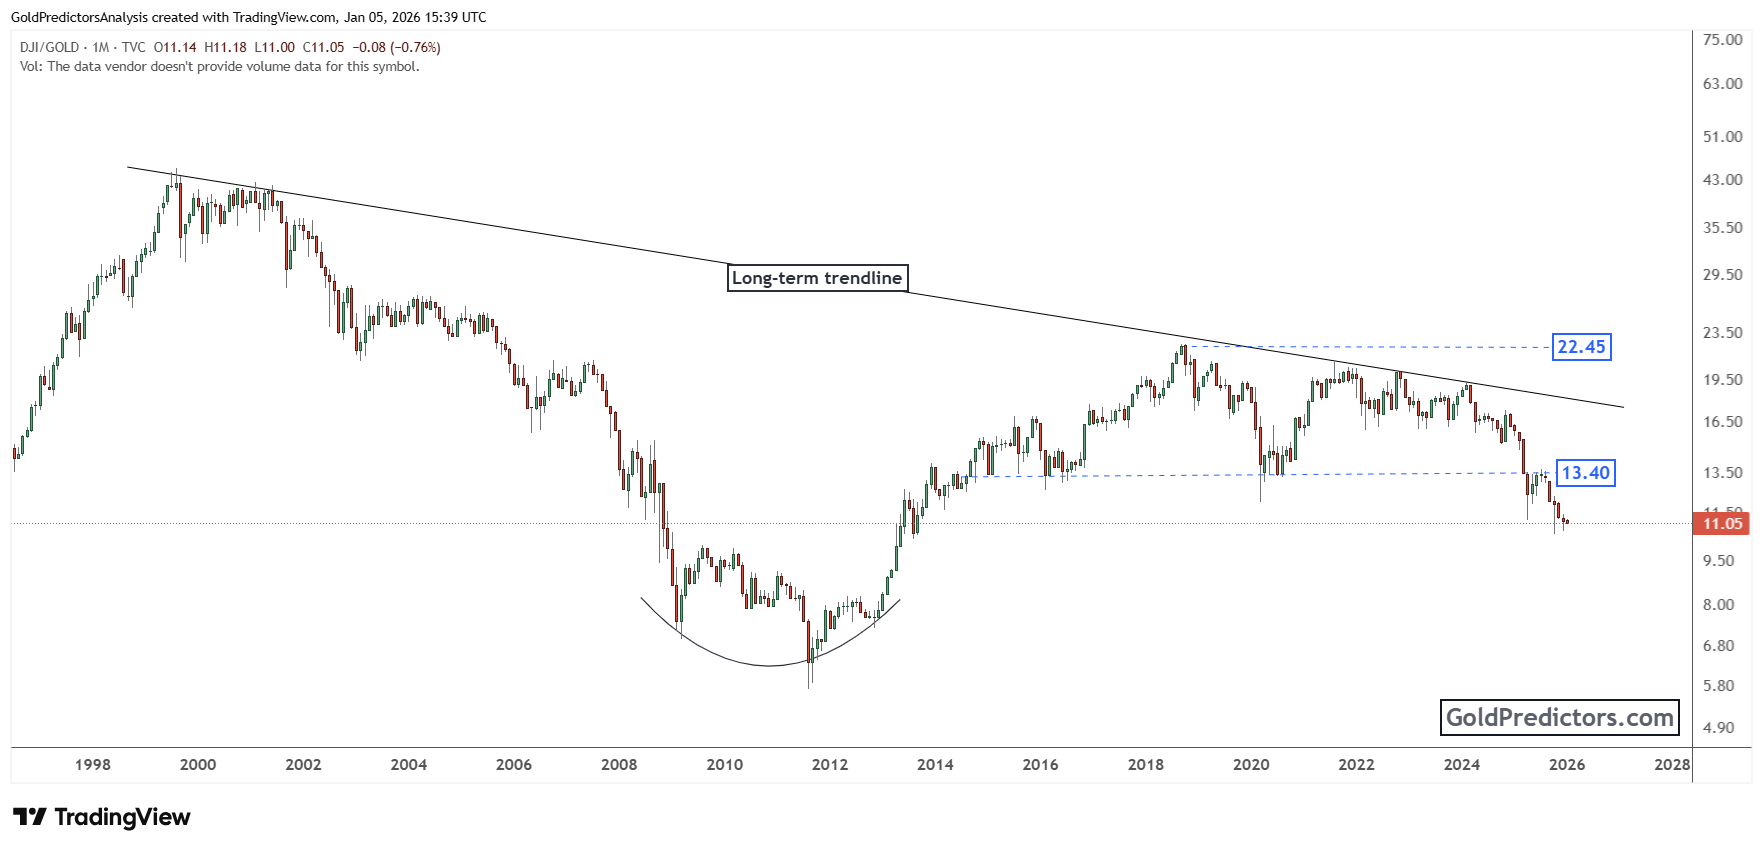
In recent years, the Dow-to-Gold ratio attempted to stabilize near a key support zone but ultimately failed. That horizontal level had served as a floor for an extended period. The decisive breakdown in late 2025 marked a clear shift in market preference away from equities. The continued decline in the ratio highlights gold’s growing strength relative to the broader stock market.
The recent shift in the Dow-to-Gold ratio carries important implications for capital flows and market leadership. The long-term trendline has now flipped into dynamic resistance. As the Dow weakens relative to gold, institutional capital appears to be rotating into safer, non-yielding assets. This breakdown adds further conviction to the long-term gold breakout narrative.
Conclusion: Gold Enters New Secular Bull Phase as Equities Lose Ground
Gold has officially entered a new era of long-term strength. The decisive breakout above a 45-year resistance line confirms the completion of a massive multi-decade cup and handle formation. By clearing this long-standing barrier, gold has broken free from decades of price compression. The breakout initiates a new market phase, with accelerating momentum and rising inflows driving the next leg higher.
At the same time, the Dow-to-Gold ratio has broken down through key support, signaling a broader shift in market leadership. This confirms a major rotation out of equities and into hard assets. As the ratio weakens, gold’s strength becomes more apparent across global markets. It is now reclaiming its leadership role as confidence in traditional assets comes under pressure.
These developments validate the beginning of a powerful secular bull market in gold. The breakout from long-term consolidation, combined with weakening equity-relative performance, reflects a fundamental transformation in capital flows. With macro tailwinds accelerating and technical structures confirming, gold is now poised to lead a new cycle of capital rotation and asset revaluation.
Gold Predictors Premium Membership
Get exclusive short-term and swing trade ideas with precise entry levels, stop-loss, and target prices, including justification and analysis — all delivered directly via WhatsApp.
Our premium service includes deep technical analysis on gold and silver markets. We cover cycle analysis, price forecasting, and key timing levels.
Members also receive a weekly market letter with detailed analysis, commentary from our Chief Analyst, including actionable insights, trade timing, and direction forecasts for gold and silver.
Stay ahead of the market — join our premium community today.


