


Silver Surges Above $50 as Dollar-to-Silver Ratio Breaks Multi-Decade Support
Silver (XAGUSD) has broken above the $50 level for the first time in decades, indicating the long-term breakout. This move marks the completion of a multi-decade cup-and-handle pattern and signals a significant shift in silver’s long-term trend.
Price action surged after the breakout, supported by persistent inflation, rising debt, and geopolitical risks. At the same time, the Dollar-to-Silver ratio has collapsed, highlighting a broader rotation into hard assets. These developments indicate a structural revaluation of silver, characterised by strong momentum and a bullish outlook for the years ahead.
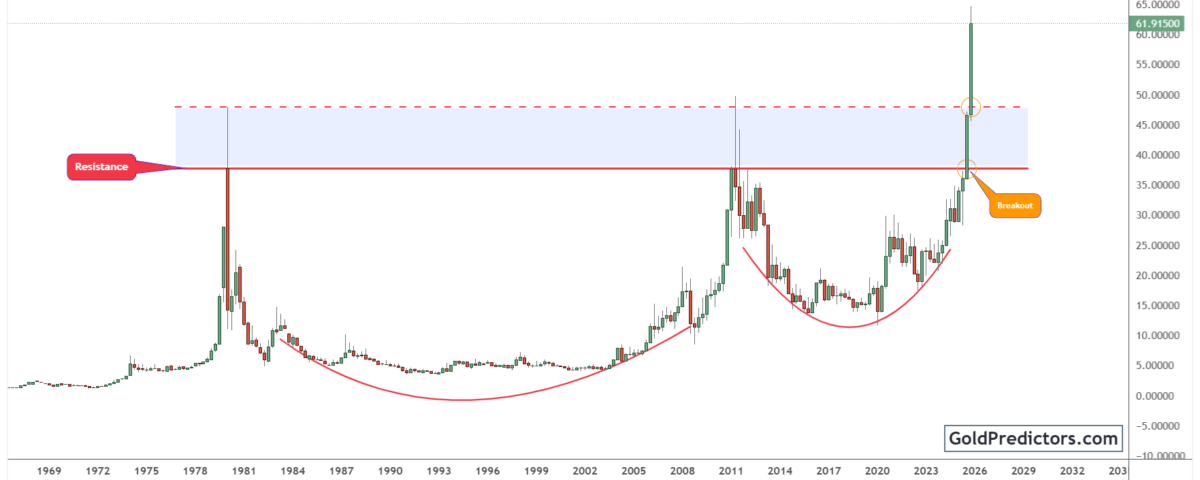
Silver Breaks $50 Resistance, Confirming a Long-Term Bullish Shift.
The silver chart below shows a decisive breakout above the $50 level, clearing one of the most significant resistance zones in price history. Historically, silver approached this level in 1980 and again in 2011, but steep corrections followed both attempts. However, this time, the breakout occurred with conviction, pushing the price decisively above resistance. The pattern forms a large cup over several decades, with the handle building gradually over time. This pattern confirms a decisive structural shift in silver’s long-term trend.
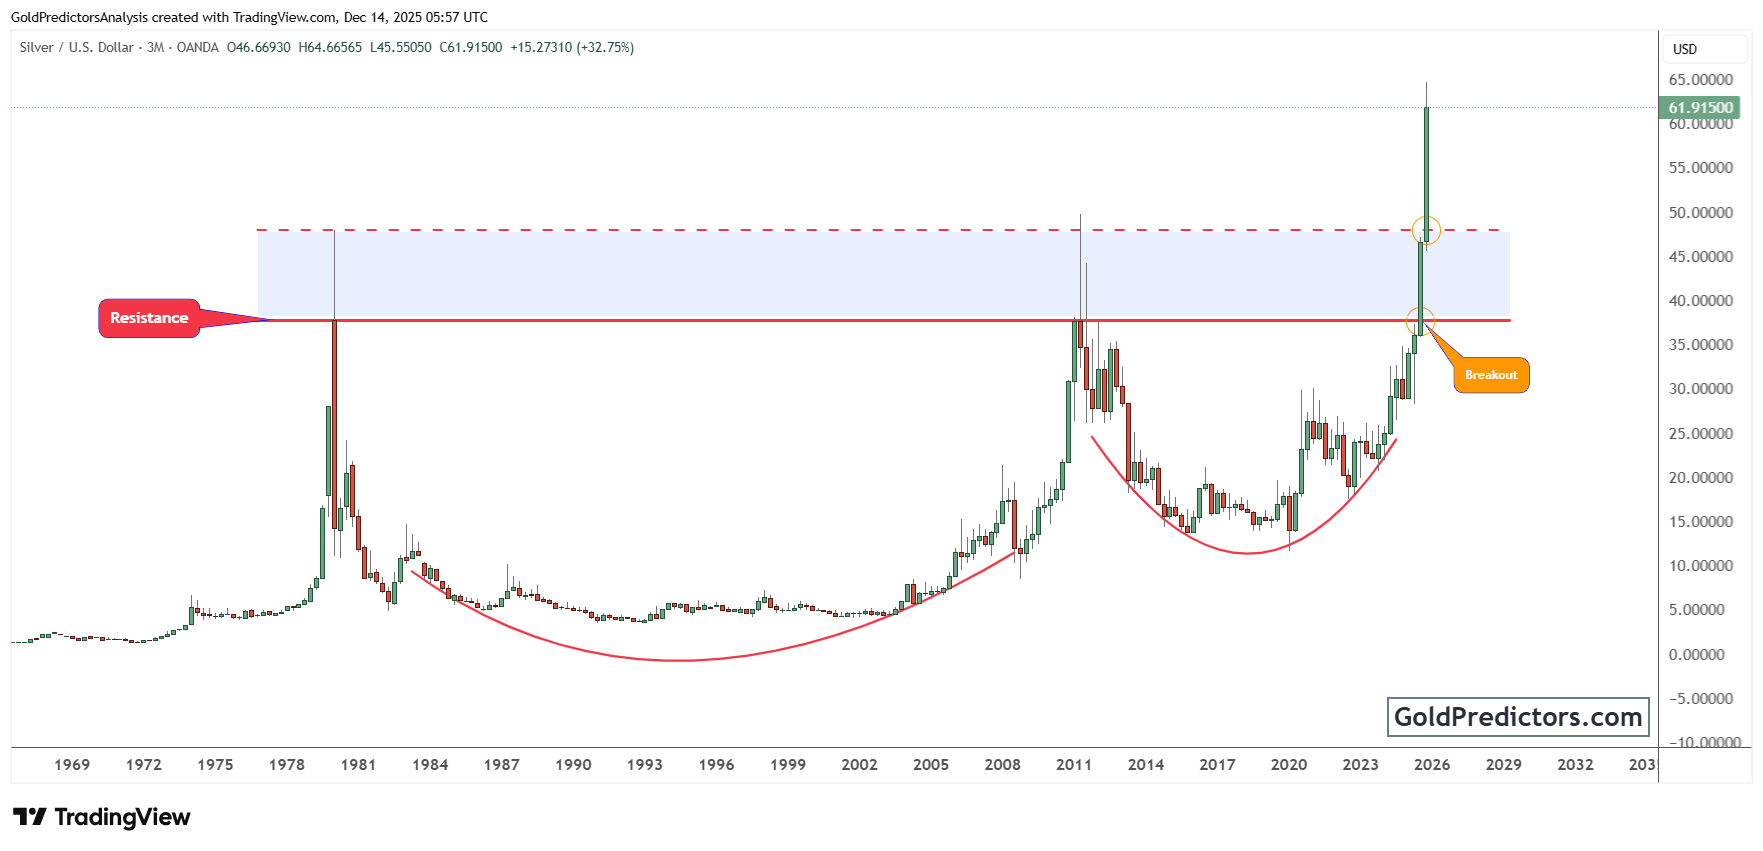
The breakout above $50 has triggered a fresh wave of bullish momentum. Price action surged strongly after the breakout, highlighting the strength and urgency behind the move. Breakouts from multi-year bases tend to produce lasting upside momentum. The previous failures at $50 had shaped a psychological and structural barrier. Now, with that ceiling broken, silver has entered uncharted territory, opening the door to much higher price levels in the coming years.
Importantly, the backdrop behind silver’s breakout carries significant weight. A combination of persistent inflation risks, ongoing debt monetisation, and rising geopolitical tensions has increased demand for hard assets. Silver, with its unique role as both a monetary asset and an industrial commodity, stands to benefit from this shift. It gains from safe-haven demand while also participating in the broader revaluation of commodities. These macro conditions add strength to silver’s long-term outlook.
Silver Outperforms as Dollar Ratio Breaks Below Long-Term Support Zone
The chart below illustrates the performance of the U.S. Dollar Index in relation to silver, highlighting a supportive backdrop for silver’s bullish outlook. The ratio recently completed a large symmetrical triangle that had been developing over the past decade. Its decisive breakdown coincides with silver’s breakout and signals a broader rotation out of fiat currencies and into tangible assets.
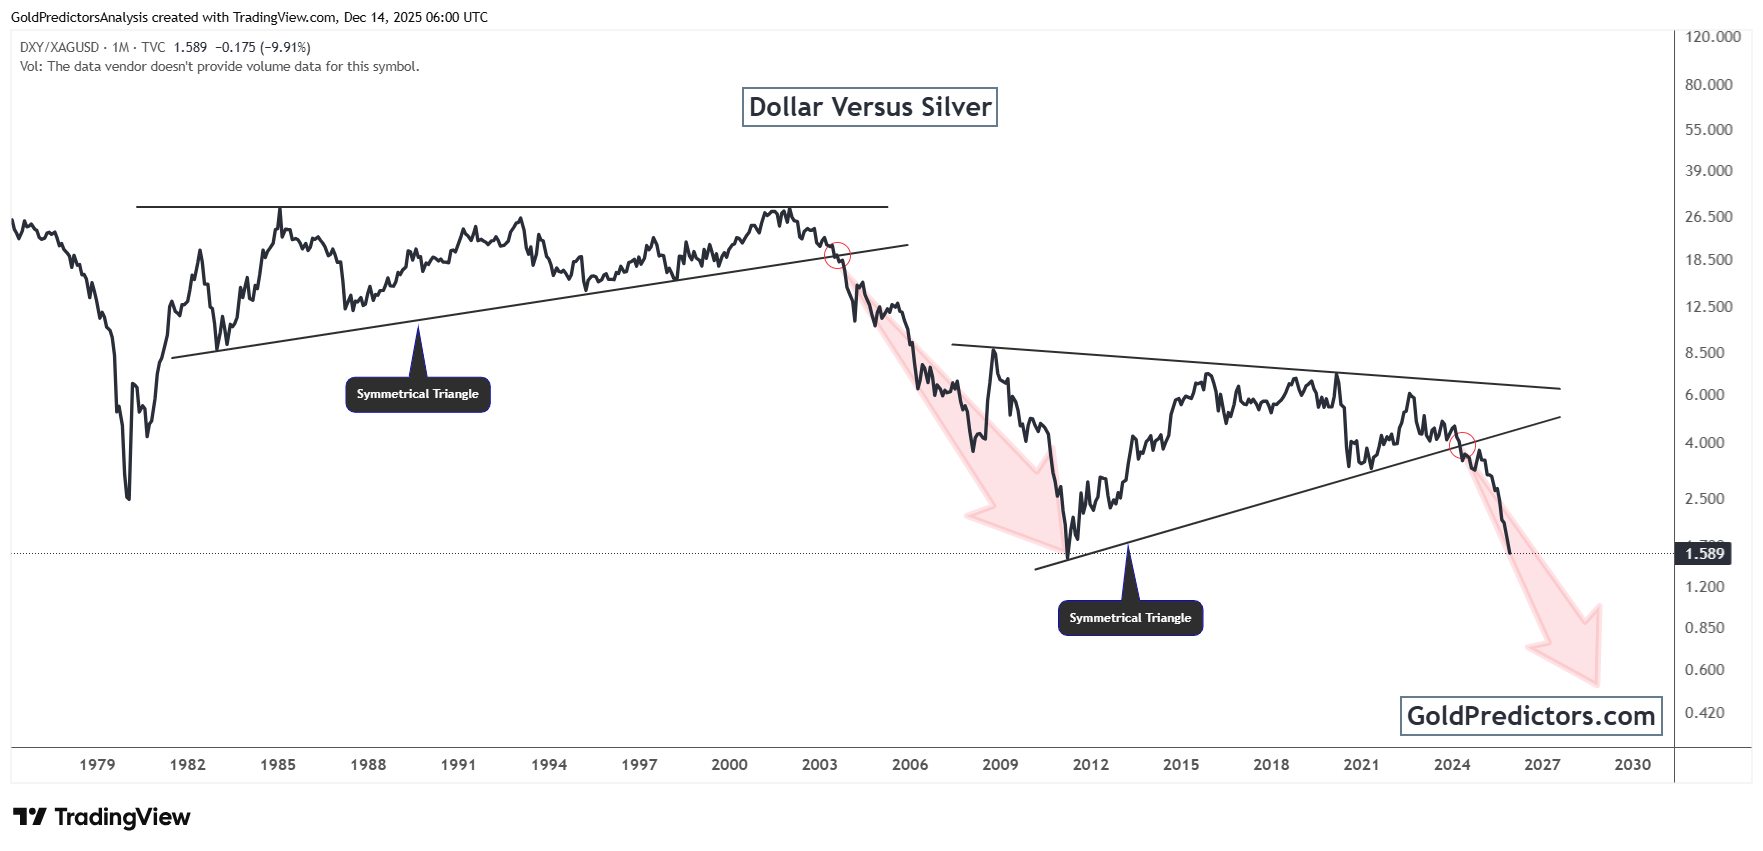
Historically, breakdowns in this ratio from long consolidation zones have often preceded extended bullish cycles in silver. Currently, the setup indicates that the ratio is falling below the 2.0 level and continuing to decline with strong momentum. Moreover, the chart highlights two consecutive triangle formations. Both patterns have broken to the downside, confirming a structural bearish trend in the dollar relative to silver.
Silver is outperforming the dollar by a wide margin, with the ratio dropping to its lowest level in over four decades. The sharp decline in the ratio signals a meaningful recovery in silver’s long-term purchasing power. At the same time, growing demand for hard assets reflects weakening confidence in fiat currencies. This shift marks a broader revaluation of silver’s role as a reliable store of value in an increasingly unstable monetary environment.
Conclusion: Silver’s Multi-Decade Breakout Sets the Stage for Higher Prices
Silver’s breakout above the $50 level marks a historic shift in the precious metals landscape. After decades of failed attempts, silver has briefly moved above this long-standing resistance, signalling a potential breakout. This breakout confirms the completion of a multi-decade cup-and-handle pattern, signalling the start of a structural bull market. The move has reignited momentum and established a new phase of technical strength.
At the same time, the Dollar-to-Silver ratio has broken down from significant support, highlighting a clear shift in relative strength. The sharp decline in the ratio reflects a weakening of confidence in fiat currencies and a growing demand for hard assets. Silver’s strong outperformance reflects this shift, as capital continues to rotate toward more reliable stores of value. Persistent inflation pressures, rising debt burdens, and mounting geopolitical risks further strengthen this broader transition.
These combined forces suggest that silver’s revaluation phase is only beginning. With technical momentum accelerating and macro conditions aligning, silver is well-positioned to sustain long-term upward movement. The long-term outlook now points toward much higher price levels as silver reclaims a more central role in the global financial system.
Gold Predictors Premium Membership
Get exclusive short-term and swing trade ideas with precise entry levels, stop-loss, and target prices, including justification and analysis — all delivered directly via WhatsApp.
Our premium service includes deep technical analysis on gold and silver markets. We cover cycle analysis, price forecasting, and key timing levels.
Members also receive a weekly market letter with detailed analysis, commentary from our Chief Analyst, including actionable insights, trade timing, and direction forecasts for gold and silver.
Stay ahead of the market — join our premium community today.


