


Gold Price Action: Parabolic Advances Align with Ratio Breakout vs Stocks
Gold (XAUUSD) has entered a new phase of vertical acceleration after breaking out from a multi-year base. This pattern mirrors earlier parabolic advances that followed major consolidation periods in the 1970s and 2000s. The current move began after years of higher lows and compression beneath key resistance. At the same time, the gold-to-S&P 500 ratio has also broken through long-standing resistance, signalling a shift in capital from equities to hard assets. These developments point to a structural rotation into gold as macro conditions evolve.
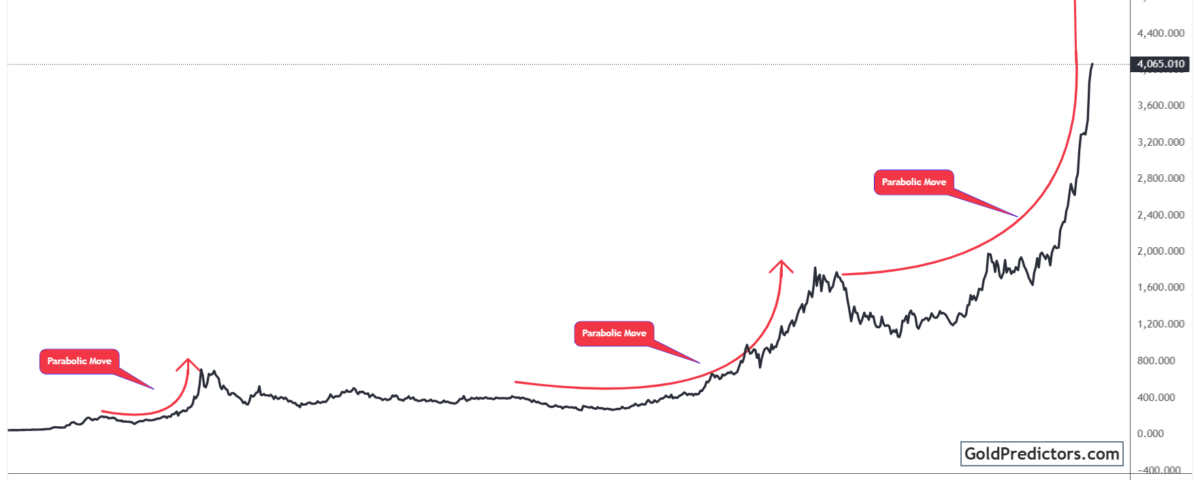
Gold Forms Series of Parabolic Moves after Multi-Year Compression
The gold chart below shows three major parabolic advances, each unfolding after a prolonged structural base. In the late 1970s, gold accelerated sharply in response to inflation and geopolitical uncertainty. A similar pattern emerged in the 2000s as expansive monetary policy fueled another steep rally. Now, a third parabolic arc is forming after years of consolidation, suggesting that gold may be entering a new phase of aggressive upward momentum.

Since 2015, gold has formed a pattern of higher lows while compressing beneath major resistance. That setup has now resolved with a decisive breakout. After surpassing previous highs, gold has entered a sharp vertical advance that mirrors earlier parabolic moves. The curve and pace of this breakout suggest that the current rally remains in its early phase. Historically, these formations have preceded extended rallies beyond the initial breakout.
Notably, the structure shows a smooth transition from long-term base to breakout followed by strong momentum. This formation filters out short-term fluctuations and points to a potential acceleration in gold’s broader uptrend. Similar to earlier cycles, this move seems fueled by shifting monetary policy, rising inflation concerns, and declining confidence in the global outlook.
Gold-to-S&P 500 Ratio Breaks Out After Years of Underperformance
The chart below illustrates the gold-to-S&P 500 ratio, showing how capital flows between equities and safe-haven assets. In the 1970s, this ratio spiked as gold outpaced stocks during a period of stagflation. This setup reflects another structural breakout, similar to the one observed during the early 1970s and now again in 2025, both of which followed extended periods of weakness. These breakouts often reflect broader changes in macro conditions and investor behavior.
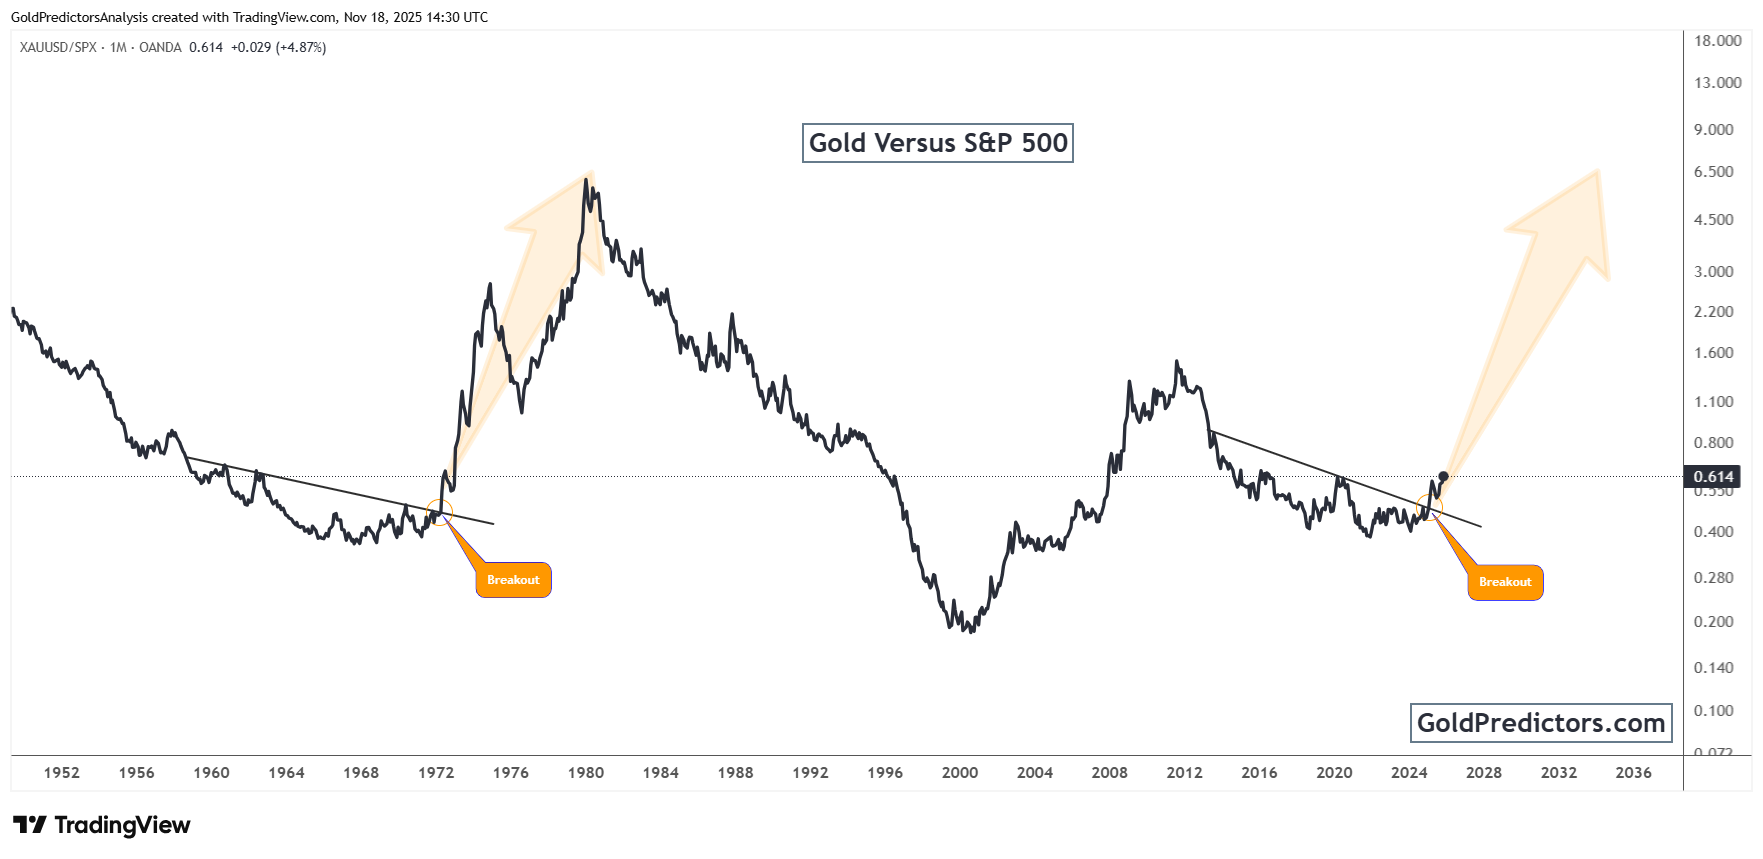
Moreover, this pattern suggests a renewed rotation away from equities and into gold. The ratio had faced repeated rejection at a long-standing trendline for over a decade, but it has now broken through. The shift in momentum points to the early stages of a new leadership cycle for gold. If this move holds, it could mark the start of a prolonged period of outperformance relative to traditional equity benchmarks.
Gold’s improving position relative to equities reflects more profound shifts in macro conditions. The shift may be fueled by policy support, concerns about inflation, and increased exposure to hard assets. In this environment, gold’s relative strength could become increasingly evident. As the trend progresses, the gold-to-equity ratio may serve as a valuable indicator for shifts in broader asset allocation.
Conclusion: Gold Positioned for Long-Term Leadership in Shifting Macro Landscape
Gold is entering a powerful bullish phase, supported by decisive breakouts on both absolute and relative terms. The price has surged after forming a multi-year base, mirroring past parabolic advances that followed similar long periods of consolidation. This upward move reflects not only technical momentum but also growing macroeconomic uncertainty, which continues to fuel interest in hard assets.
Moreover, the breakout in the gold-to-S&P 500 ratio adds further weight to this shift. Gold is starting to outperform equities on a structural level, with the ratio rising after clearing a long-standing resistance level. This signals increasing demand for safety, value preservation, and tangible stores of wealth, along with a broader rotation into defensive areas. It marks a notable change in capital flows, favoring hard assets over traditional risk assets.
Overall, these developments suggest that gold is entering a new era of market leadership. With long-term technical patterns now resolved and macro headwinds intensifying, the metal is well-positioned to outperform over the coming years. As capital moves away from conventional assets, gold is re-emerging as a key hedge and long-term store of value.
Gold Predictors Premium Membership
Get exclusive short-term and swing trade ideas with precise entry levels, stop-loss, and target prices, including justification and analysis — all delivered directly via WhatsApp.
Our premium service includes deep technical analysis on gold and silver markets. We cover cycle analysis, price forecasting, and key timing levels.
Members also receive a weekly market letter with detailed analysis, commentary from our Chief Analyst, including actionable insights, trade timing, and direction forecasts for gold and silver.
Stay ahead of the market — join our premium community today.


