


Silver Eyes Breakout Above $50 as Structural Patterns and Macro Momentum Align
Silver (XAGUSD) is building momentum after years of structural consolidation. The metal has carved out a series of breakout patterns that signal long-term strength. Silver has repeatedly responded to critical technical levels that continue to influence its broader trend.
Moreover, the breakout in the Silver-to-Bitcoin ratio confirms growing relative strength across assets. Now, silver is approaching a critical zone near $50, a level that has repeatedly capped major rallies in past cycles. With momentum building across multiple dimensions, silver appears poised for its next major advance.
Silver Builds toward $50 after Structural Breakouts and Macro Momentum
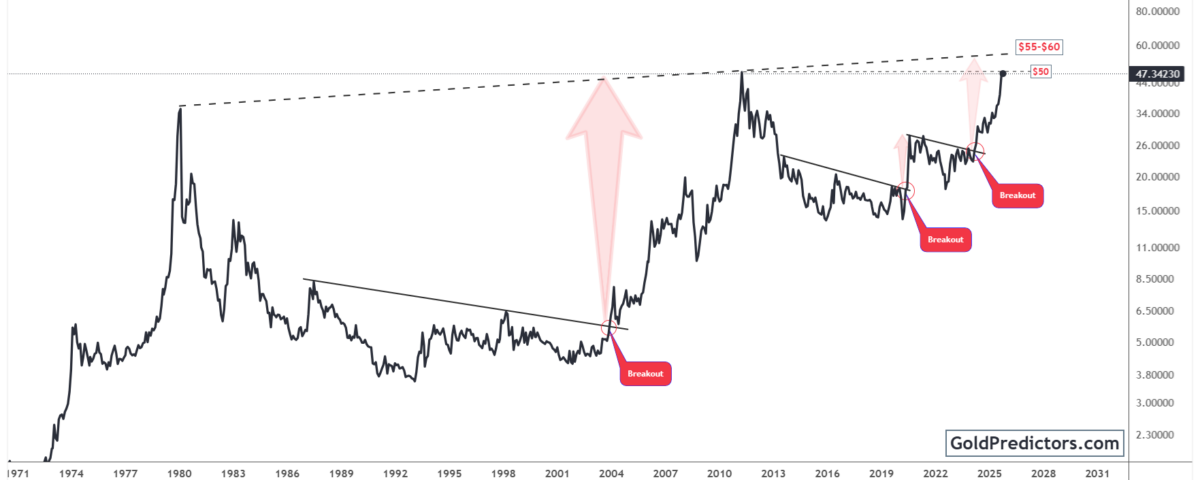
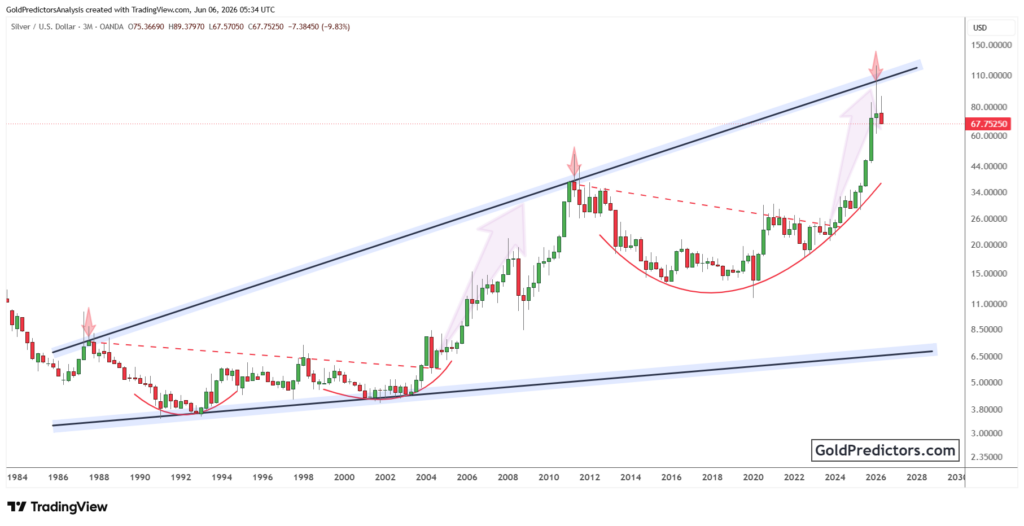
The silver chart below shows a series of breakouts, each marking a critical shift in trend. Between 1980 and 2004, silver moved within a broad consolidation range, building a structural base. In the early 2000s, price finally cleared the descending resistance, triggering a powerful rally that carried silver close to $50 by 2011. This technical breakout validated the resistance line as a major turning point, propelling silver into a strong bull run.
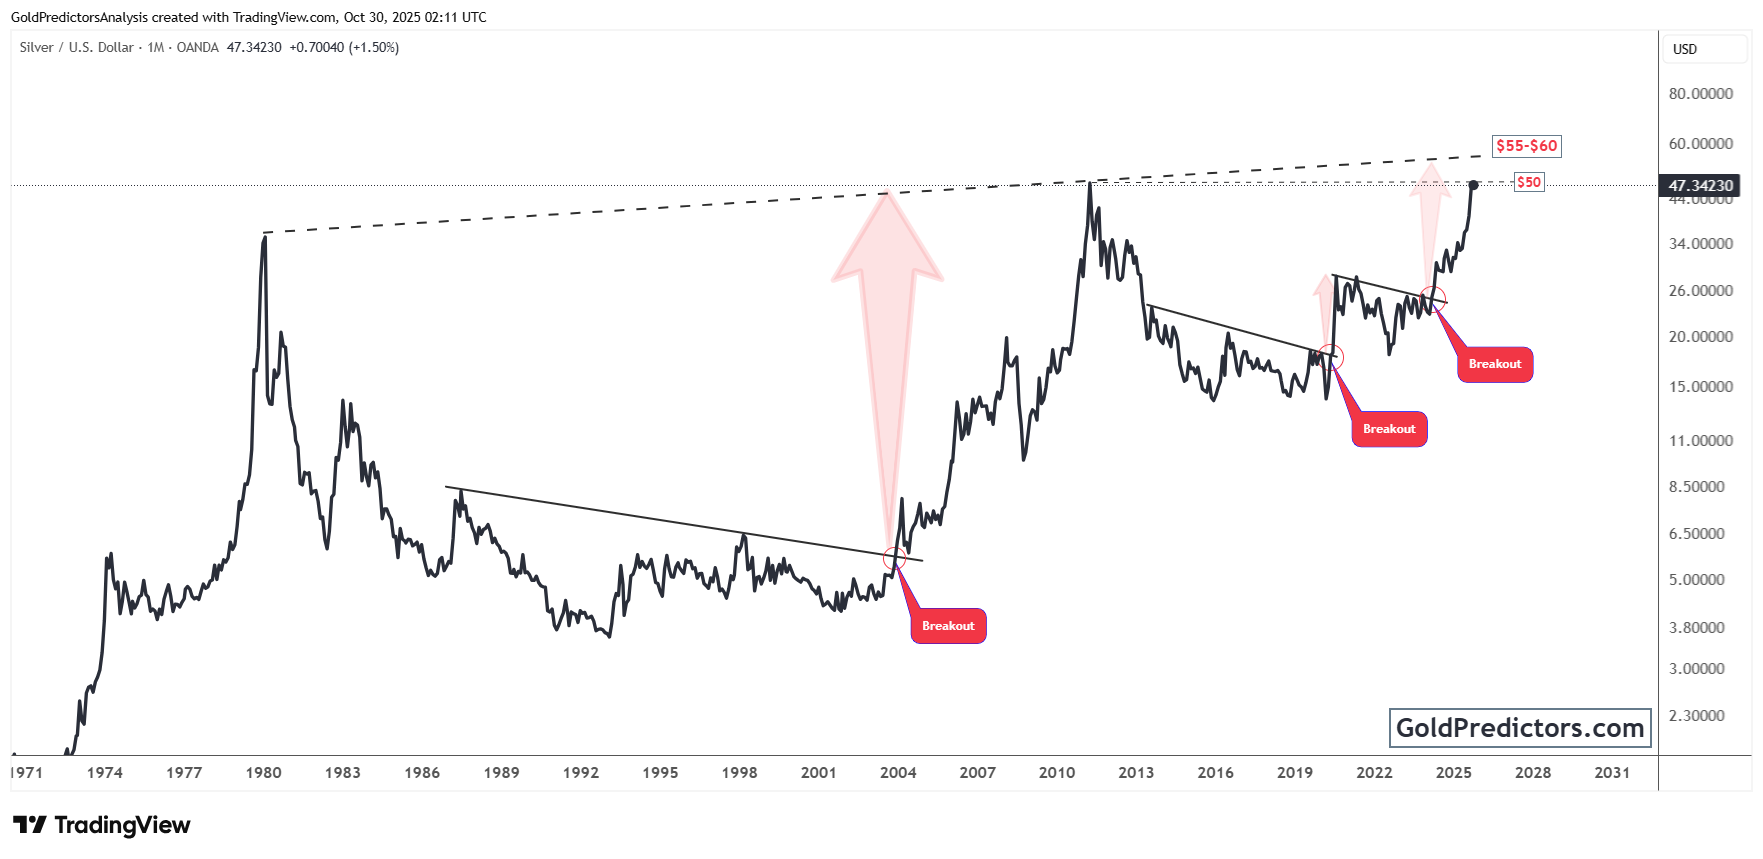
Following the 2011 peak, silver entered a prolonged correction. Between 2011 and 2020, price action formed a downward wedge pattern, characterized by compressing volatility and narrowing price swings as silver gradually coiled below key resistance levels. In 2020, silver broke out from this wedge formation, confirming a bullish reversal. After several years of sideways consolidation, it staged another breakout, driving prices toward the critical $50 resistance level.
Importantly, silver is approaching a significant resistance zone near the $50 level. This level has repeatedly capped rallies in 1980, 2011, and now in 2025. A clean breakout above this resistance would unlock the next primary target between $55 and $60. This range emerges as the next key objective within the prevailing multi-decade setup. Given the structural strength of previous breakouts, a move above $50 could trigger another explosive rally.
Silver-to-Bitcoin Ratio Breaks Out as Relative Strength Shifts toward Hard Assets
The chart below displays the Silver-to-Bitcoin ratio (XAGUSD/BTCUSD) on a monthly time frame. Since 2013, this ratio has trended lower in a well-defined falling wedge pattern. This reflects a period where Bitcoin consistently outperformed silver. The wedge continued until 2024, when the price touched the lower boundary and began to consolidate, forming a base.

In late 2025, the ratio broke out of the falling wedge, suggesting the end of Bitcoin’s relative dominance. The breakout has cleared the wedge structure and is now moving toward the next resistance zone. A successful push above this level would confirm trend reversal in favour of silver. The improvement in relative performance could reflect an early phase of structural capital reallocation.
Historically, falling wedges lead to upward reversals, and this pattern played out accordingly with a decisive breakout to the upside. Silver’s outperformance relative to Bitcoin strengthens the case for renewed interest in tangible assets. When combined with macroeconomic tailwinds such as inflation protection and falling real yields, this relative strength further supports the ongoing bullish momentum.
Conclusion: Silver Prepares for Next Leg Higher as Multi-Asset Momentum Builds Toward $50
Silver is approaching a critical point in its long-term trend. Successive breakouts in recent years have transformed the chart and helped establish a strong bullish base. Silver is once again confronting the $50 zone, a level known for acting as both a barrier and a breakout catalyst. A decisive move above this level could mark the beginning of a new leg higher, with targets extending toward $55–$60.
Furthermore, the breakout in the Silver-to-Bitcoin ratio supports this setup. The ratio has shifted in favour of silver, indicating renewed relative strength. This relative strength suggests a renewed capital shift toward hard assets. The move is driven by inflation pressures, falling real yields, and broader macro instability. Silver’s ability to outperform a high-beta asset like Bitcoin underscores its rising appeal as a long-term store of value.
Overall, these signals suggest that silver is not just holding support but also gaining momentum on multiple fronts. Structural patterns, relative strength, and macro factors are now aligning. If silver clears the $50 barrier with conviction, it could accelerate into the next phase of its long-term bull market. The alignment of breakout signals makes this setup one of the strongest technical formations in recent memory.
Gold Predictors Premium Membership
Get exclusive short-term and swing trade ideas with precise entry levels, stop-loss, and target prices, including justification and analysis — all delivered directly via WhatsApp.
Our premium service includes deep technical analysis on gold and silver markets. We cover cycle analysis, price forecasting, and key timing levels.
Members also receive a weekly market letter with detailed analysis, commentary from our Chief Analyst, including actionable insights, trade timing, and direction forecasts for gold and silver.
Stay ahead of the market — join our premium community today.
