


Silver Price Forecast: Cup Formation and S&P 500 Ratio Point to Major Breakout
Silver (XAGUSD) is approaching one of its most critical levels in decades. The metal is once again testing the $50 level, a barrier that has held firm for more than a decade. A long-term cup formation has developed, signalling a potential breakout setup. At the same time, silver is gaining ground against the S&P 500, highlighting a shift in relative strength. These signals indicate a pivotal phase that could redefine silver’s long-term role in global markets.
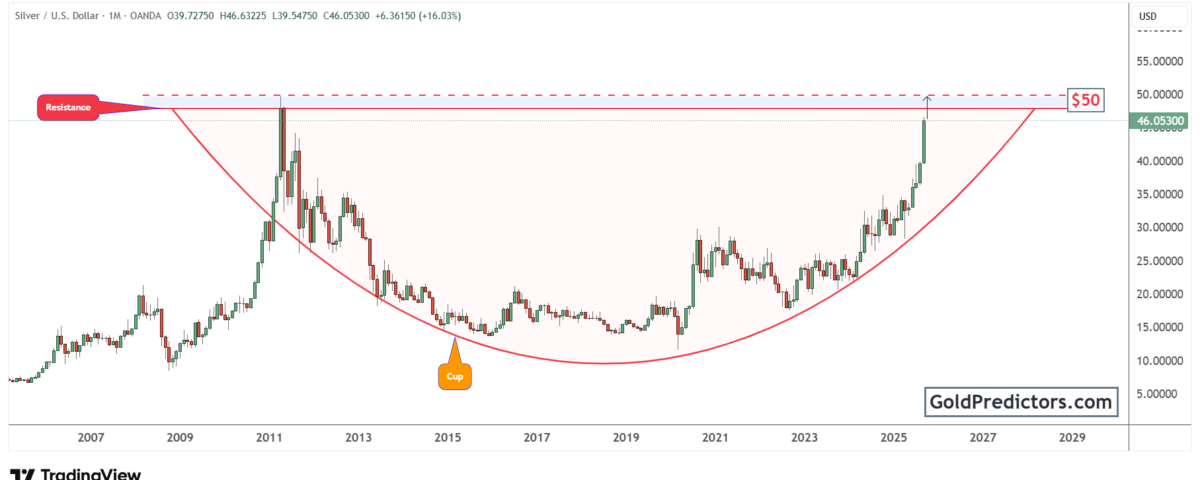
Silver Approaches $50 Resistance with Decade-Long Cup Formation
The silver chart below shows a well-defined cup formation that has been developing over the past decade, indicating a potential breakout setup. After reaching nearly $50 in 2011, the metal entered a deep correction that extended into 2015, establishing the base of the pattern. Since then, silver has climbed consistently, forming a rounded pattern and moving higher along the right side of the cup.

In recent months, silver has gained strength, thereby pushing the price back to the critical $50 resistance point. Historically, this level has capped rallies, serving as a ceiling for over a decade. Therefore, a decisive break above it would carry major technical importance, confirming the decade-long cup formation and signalling the start of a new bullish phase. A breakout of this scale could open the door to substantial gains, strengthening silver’s position as a key hedge in global markets.
Technically, cup formations often signal the start or continuation of a significant trend once the resistance line is broken. In this case, $50 acts as the neckline. If silver clears this resistance with substantial volume and follow-through, the projected upside could extend well beyond prior highs. Overall, this structure suggests silver is not just recovering but entering a multi-year bull phase.
Silver-to-S&P 500 Ratio Approaches Key Resistance Level
The chart below shows silver’s performance in relation to the S&P 500. It provides a clear view of how the metal has moved against the broader equity market across various time periods. Moreover, this ratio offers valuable insight into periods when silver has either outperformed or lagged behind stocks. It remains a reliable benchmark for evaluating long-term cycles and shifts in market positioning. Between 2020 and 2024, the ratio reached a low before stabilising and developing multiple rounded bases.

Currently, the silver-to-S&P 500 ratio is approaching a long-term descending resistance line. A successful breakout at this level would mark the beginning of a new phase in which silver outperforms equities. Historically, such breakouts have triggered strong moves. In the early 2000s, silver rallied sharply after escaping a similar ratio pattern, delivering years of gains over the stock market.
Additionally, this relative performance analysis underscores silver’s improving position. It indicates that the metal’s advance is not only substantial in absolute terms but also improving against equities. Consequently, this shift could mark a decisive turning point, highlighting silver’s growing role as a diversification asset. If sustained, this trend would establish silver’s entry into a new phase of relative strength in global markets.
Silver Technical Outlook: Approaching Historic Breakout with Rising Market Strength
Silver is now testing the $50 resistance level that has capped its rallies for more than a decade. The long-term cup formation points to a powerful technical setup. A confirmed breakout above this zone would not only validate the pattern but also signal the start of a fresh multi-year bull phase. This move would strengthen silver’s role as a strategic hedge and a growth opportunity in global markets.
Meanwhile, the silver-to-S&P 500 ratio signals a clear improvement in relative strength. A breakout from its descending trendline would confirm silver’s ability to outperform equities after years of lagging. This shift would mark a significant turning point, showing that silver’s advance is not limited to absolute price gains but also extends to market leadership. Historically, this kind of relative performance has fueled long-lasting uptrends.
Overall, these combined signals indicate that a structural shift is already unfolding. Silver is not simply recovering from past lows but positioning itself for sustained strength. In addition, both the technical and relative setups indicate a decisive phase that could significantly alter the metal’s long-term outlook. A breakout above $50 would confirm this transformation and open the way for lasting gains.
Gold Predictors Premium Membership
Get exclusive short-term and swing trade ideas with precise entry levels, stop-loss, and target prices, including justification and analysis — all delivered directly via WhatsApp.
Our premium service includes deep technical analysis on gold and silver markets. We cover cycle analysis, price forecasting, and key timing levels.
Members also receive a weekly market letter with detailed analysis, commentary from our Chief Analyst, including actionable insights, trade timing, and direction forecasts for gold and silver.
Stay ahead of the market — join our premium community today.


