


Gold Outshines Silver as Technical Breakout Fuels Bullish Sentiment
Gold (XAUUSD) is showing strong technical momentum, supported by a major breakout from long-term consolidation. At the same time, the gold-to-silver ratio continues to favour gold, holding within a rising channel. These charts provide valuable insight into the market’s direction. Gold appears to be leading the way, while silver lags. Together, they outline a clear picture of current trends and potential opportunities in the precious metals market. Traders and investors should pay close attention to these developments.
Gold Breaks Major Resistance after Long-Term Consolidation Phase
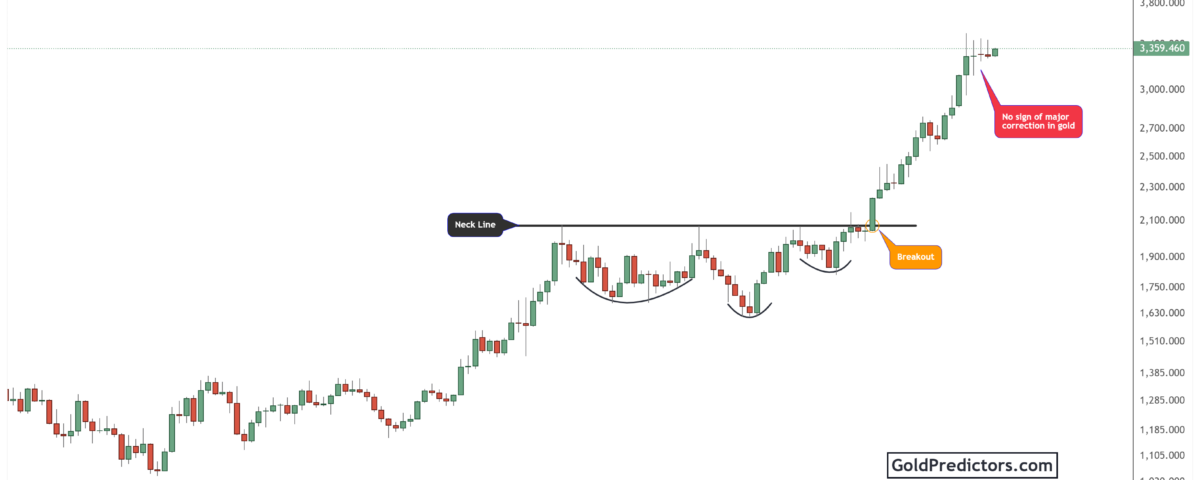
The gold chart below shows a long-term monthly trend development from 2014 to 2025. It shows an extended consolidation phase that has developed into a decisive breakout. A classic inverse head and shoulders pattern is visible, with the neckline drawn around the $2,075 level. This critical resistance zone was tested several times between 2020 and 2023. These repeated tests formed a head-and-shoulders structure, signalling a major setup for a bullish reversal.
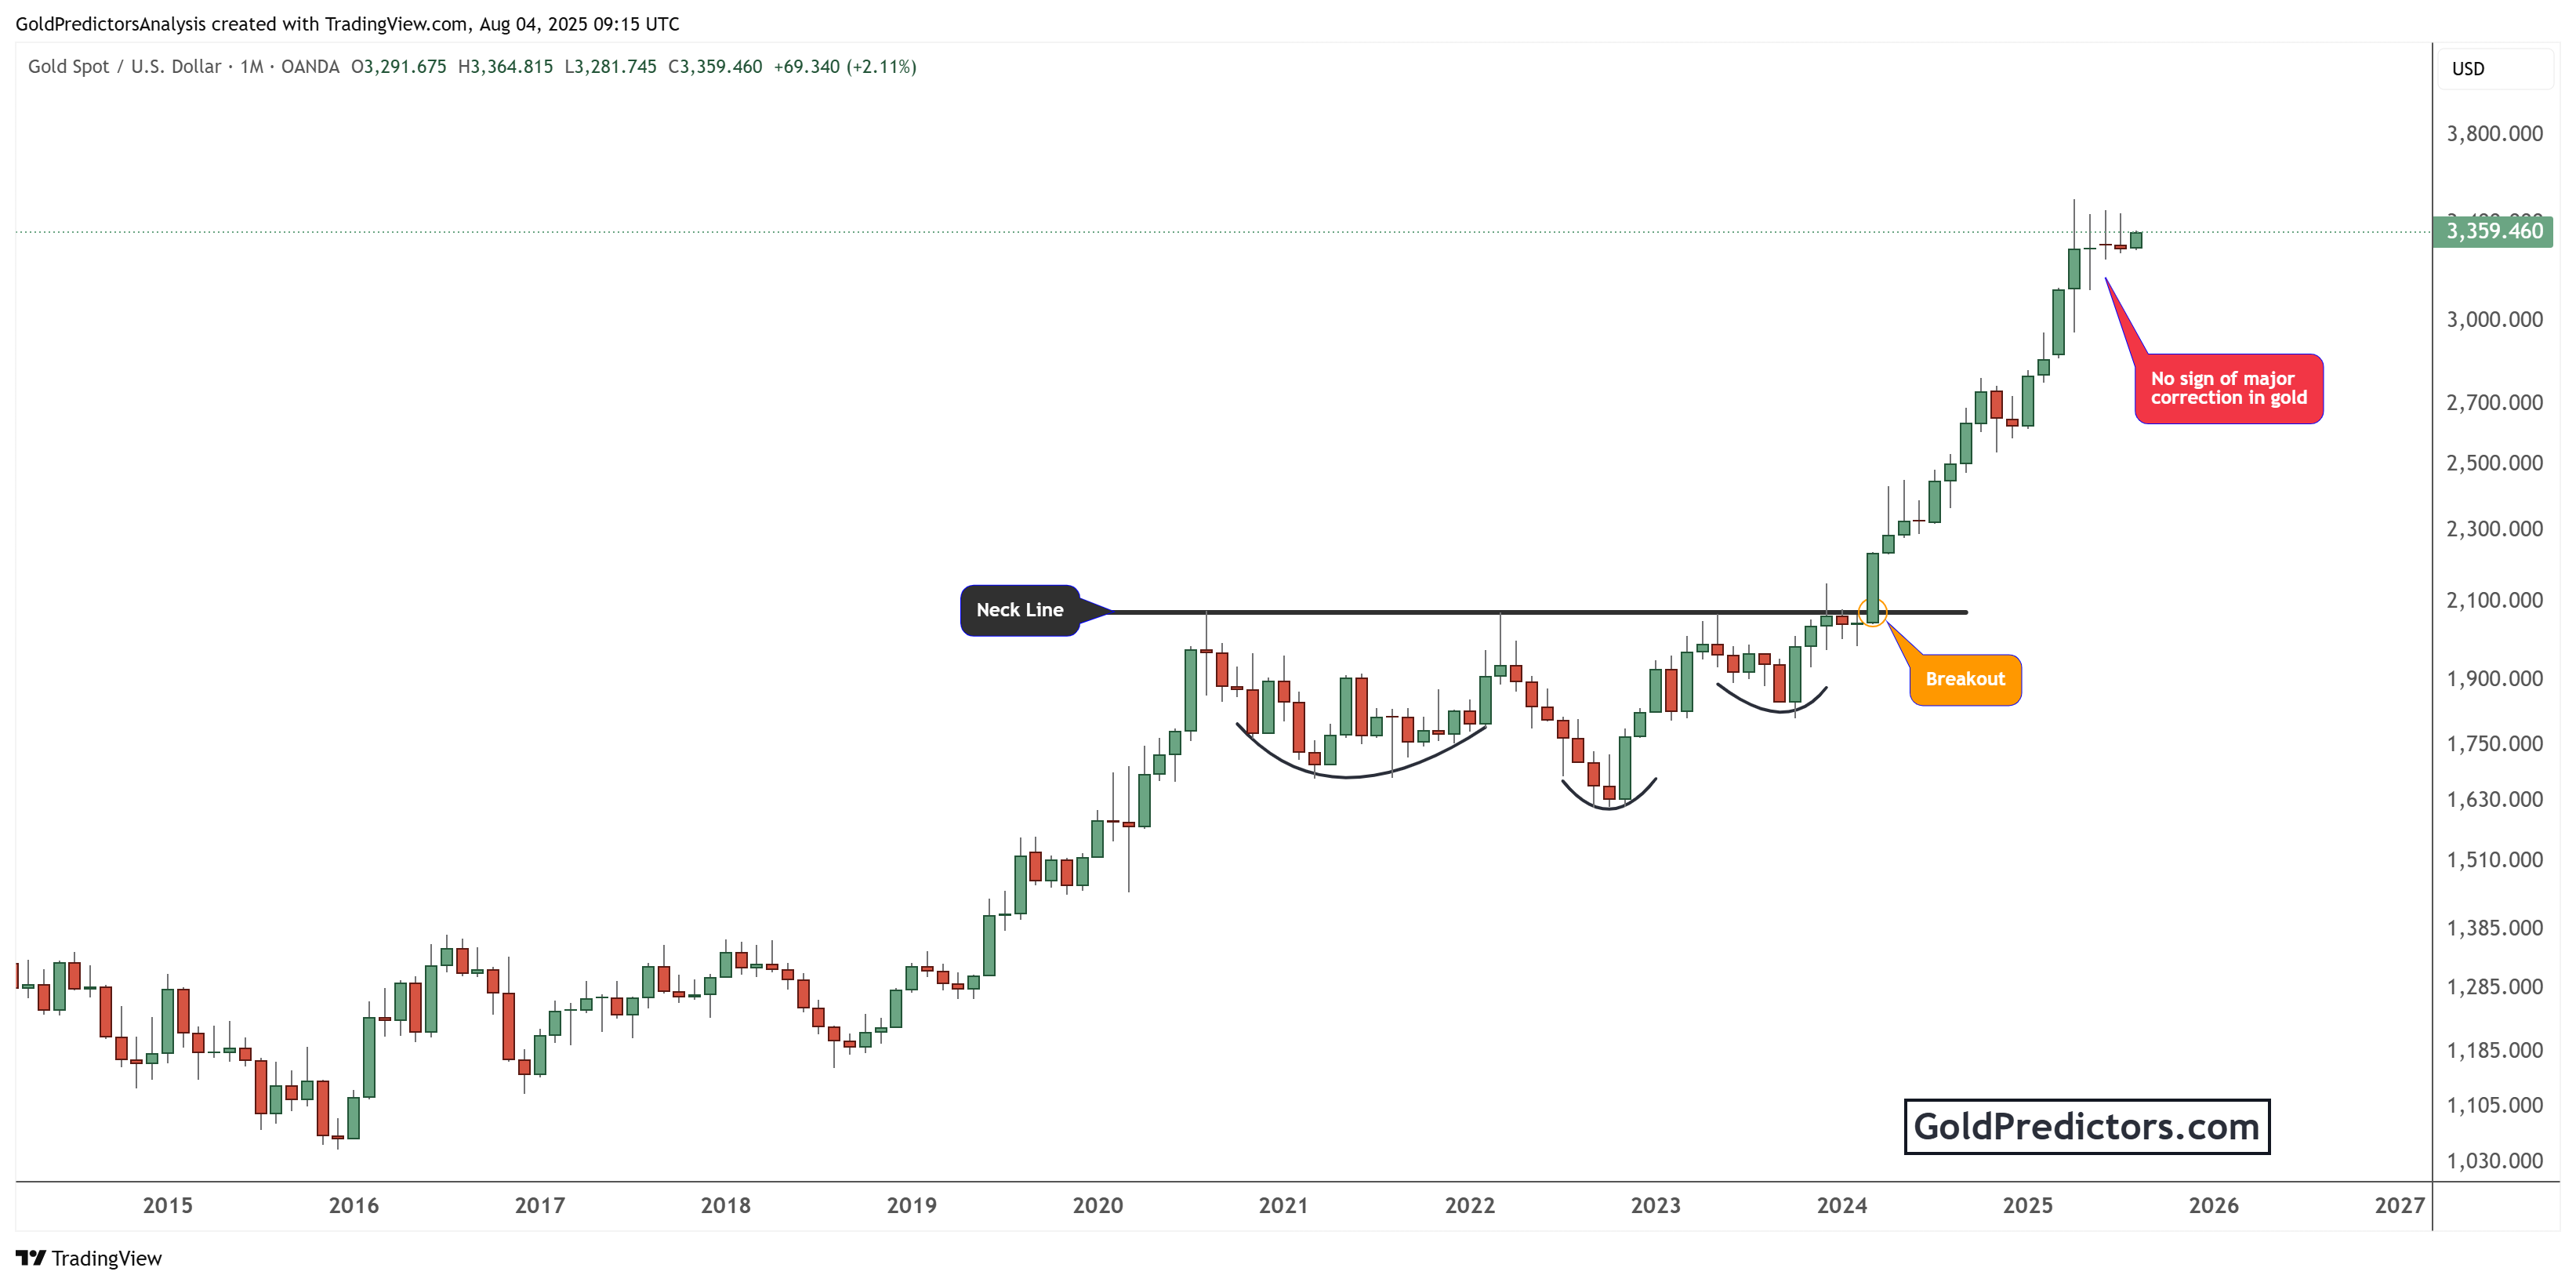
In early 2024, gold broke decisively above the neckline. This breakout was confirmed by a series of strong green candles on the monthly chart. Since the breakout, gold has rallied sharply, reaching above $3,350 by August 2025. The upward move has been consistent, with hardly any sign of weakness or stalling behaviour.
This breakout is more than just a technical pattern as it reflects a significant shift in market sentiment. Each retracement has been met with strong buying interest, preventing any considerable correction from occurring. Monthly candles following a breakout are characterised by strong closes and limited wicks, indicating firm buying interest. This type of price structure leads to multi-year bull trends in gold. Macroeconomic variables such as inflation, interest rates, and geopolitical risks typically drive gold’s price movements.
Gold-to-Silver Ratio Nears Resistance as Gold Continues to Outperform
The chart below shows the gold-to-silver ratio on a weekly time frame. This ratio measures the amount of silver required to purchase one ounce of gold. Since mid-2020, the ratio has remained within a clear ascending channel. The lower boundary of the channel has consistently acted as support, while the upper boundary has served as resistance. Currently, the ratio is positioned near the midpoint of the channel, at approximately 90. This suggests that gold remains in a stronger position compared to silver.
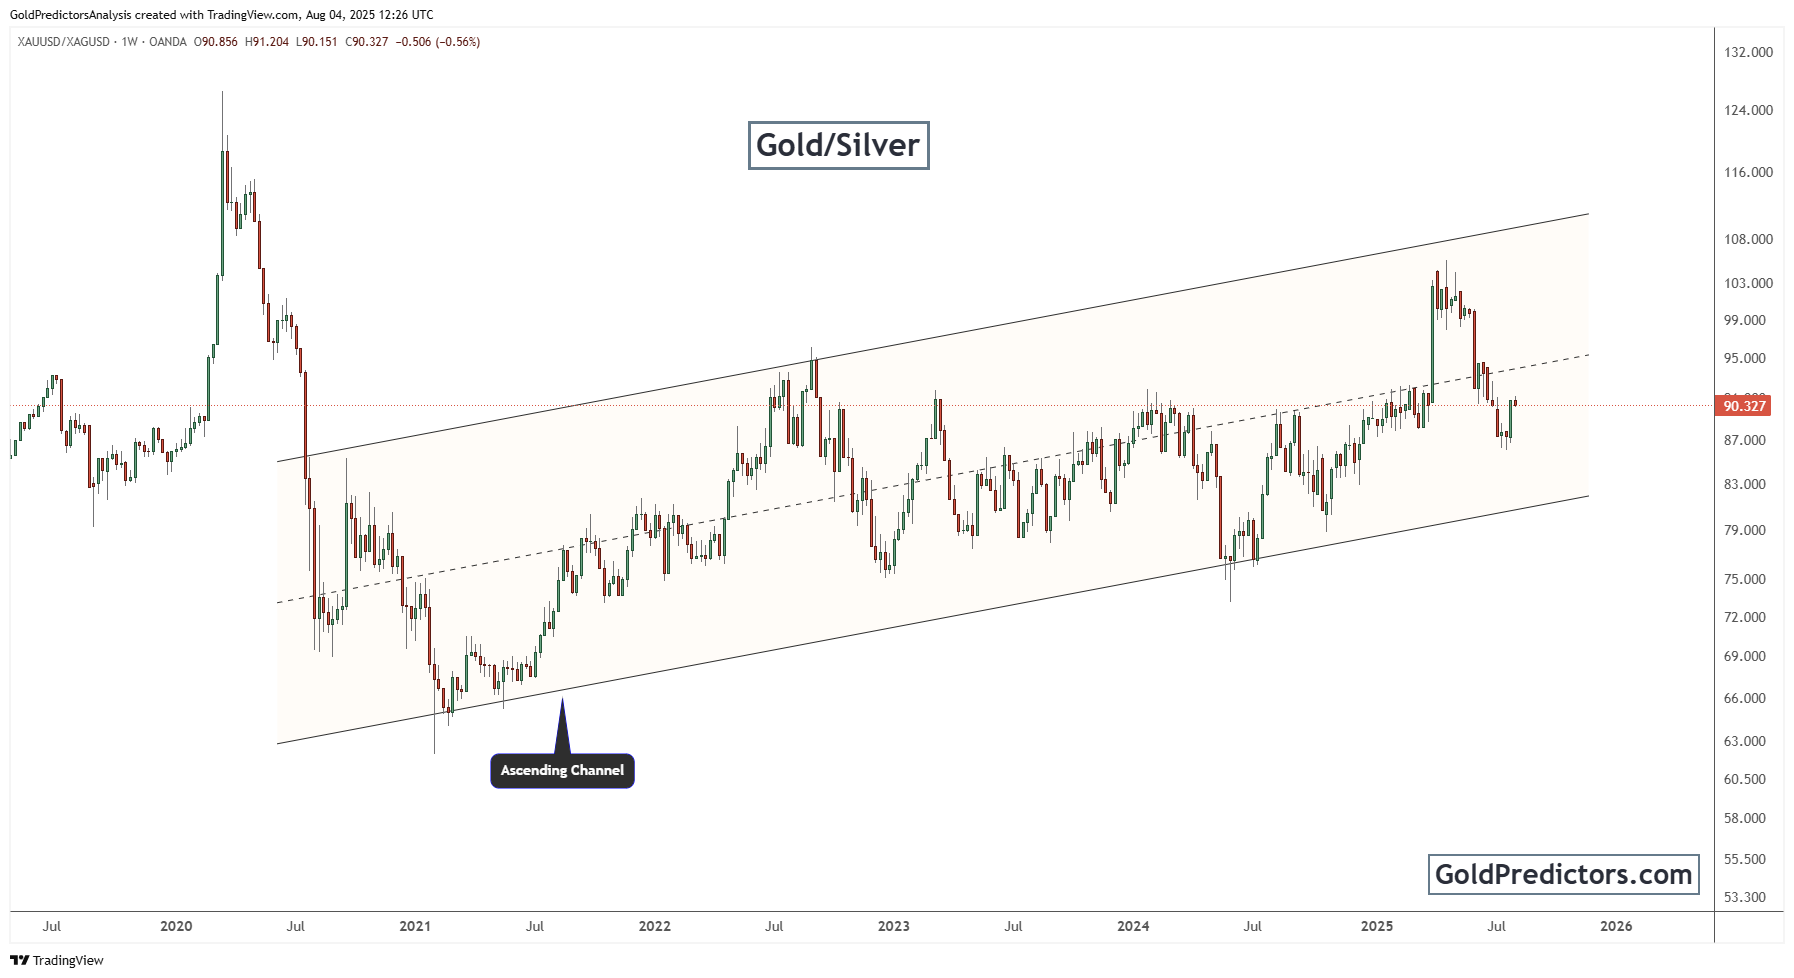
This setup reveals two key insights. One is that silver has lagged behind gold in terms of performance. Another is that, during uncertain times, investors tend to favour gold as a safe haven. As a result, the gold/silver ratio has remained at significant levels. Historically, each time the ratio approached the lower support boundary, silver started to gain relative strength. Conversely, when the ratio neared the upper resistance level, gold began to underperform slightly.
Currently, the ratio is holding above 87 and has recently bounced off its support level, suggesting that gold remains dominant. If the ratio rises toward 100, it would confirm continued underperformance from silver. However, if silver starts to strengthen and pushes the ratio below the midline of the channel, it could mark a potential shift in momentum toward silver. This makes the current level a critical area to watch for possible rotation between the two metals.
Conclusion: Gold Maintains Bullish Momentum as Silver Trails in Mixed Outlook
Gold has entered a new bullish phase. The breakout from the long-term consolidation pattern signals strength backed by strong technical and market momentum. The monthly chart reflects solid price action, with strong closes and limited corrections. This suggests continued upside potential, especially if macroeconomic conditions remain favourable for precious metals.
At the same time, the gold-to-silver ratio continues to show gold’s dominance. The ratio remains inside a rising channel, currently holding near 90. This indicates that silver has yet to catch up, and the market continues to favour gold in uncertain times. However, the ratio’s midpoint is a potential turning zone, so traders should monitor closely for any signs of silver strength.
Together, both charts tell a cohesive story. Gold remains technically strong, with long-term bullish momentum intact. Silver continues to trail, but the current ratio suggests a possible inflection point. Investors should watch for key resistance or support levels in both charts for clues about the next move. These chart patterns highlight meaningful opportunities in the precious metals space.
Gold Predictors Premium Membership
Get exclusive short-term and swing trade ideas with precise entry levels, stop-loss, and target prices, including justification and analysis — all delivered directly via WhatsApp.
Our premium service includes deep technical analysis on gold and silver markets. We cover cycle analysis, price forecasting, and key timing levels.
Members also receive a weekly market letter with detailed analysis, commentary from our Chief Analyst, including actionable insights, trade timing, and direction forecasts for gold and silver.
Stay ahead of the market — join our premium community today.


