


Gold Price Forecast: Technical and Inflation-Adjusted Breakouts Signal Bull Market
Gold (XAUUSD) remains a crucial asset for investors seeking stability in uncertain markets. Recent price action and long-term historical patterns support a strong bullish outlook for gold. Significant technical formations and historical context suggest a continued upward movement in gold prices. This article explores the short-term technical setup, long-term inflation-adjusted performance, and what these signals mean for investors in the future.
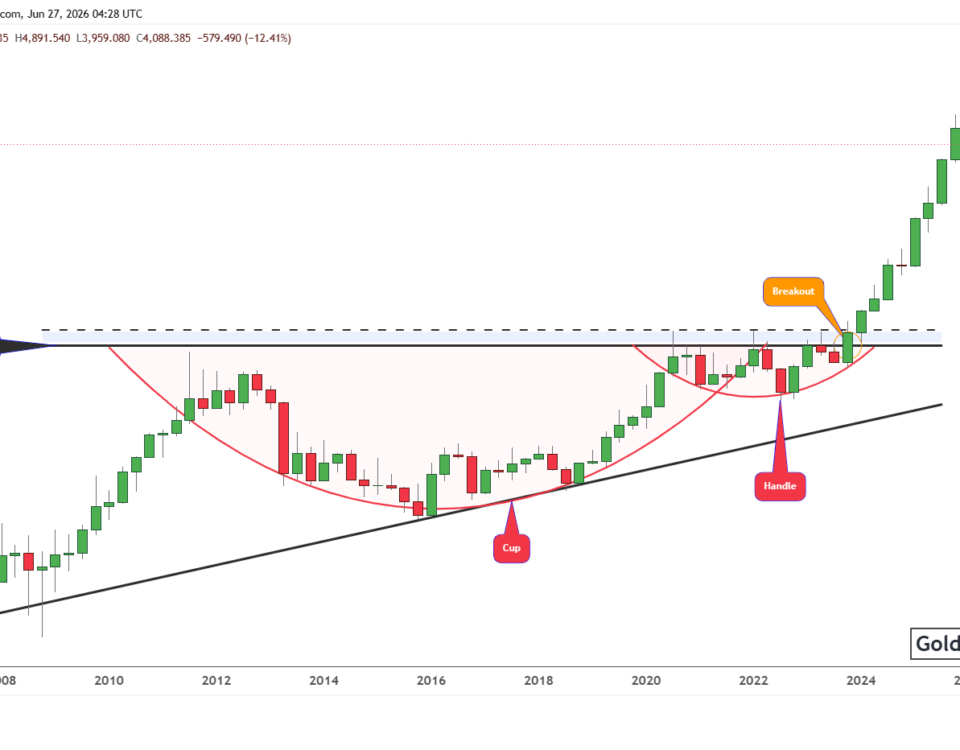
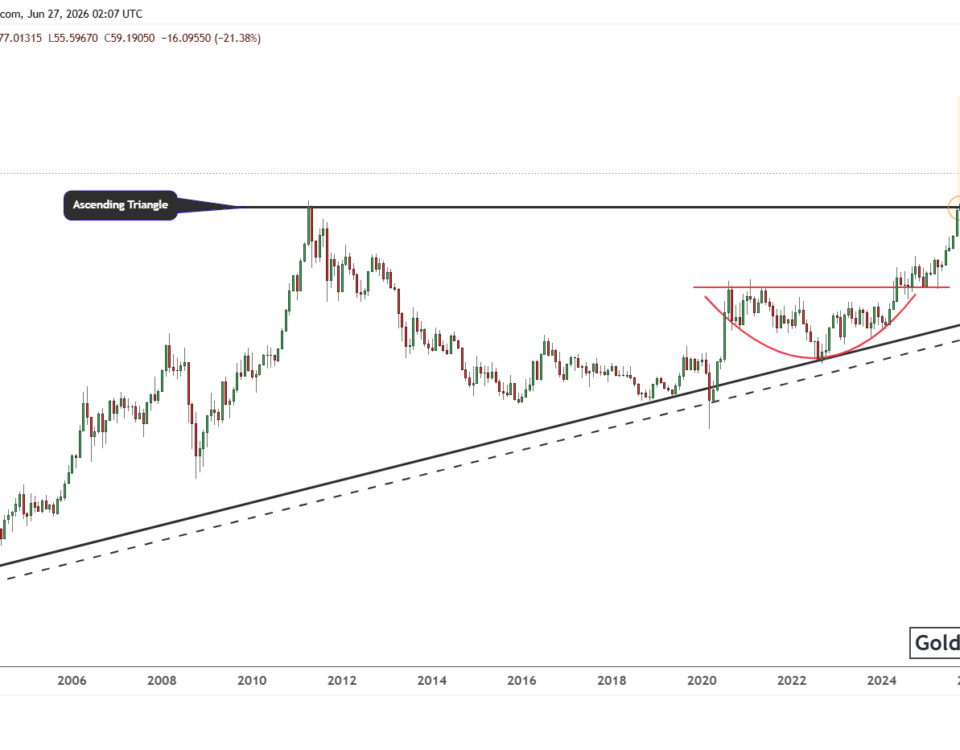
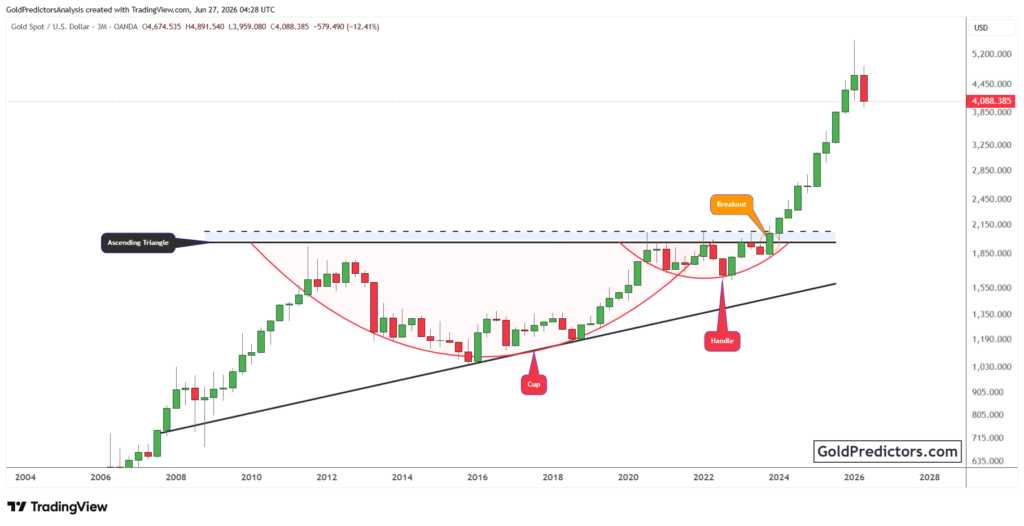
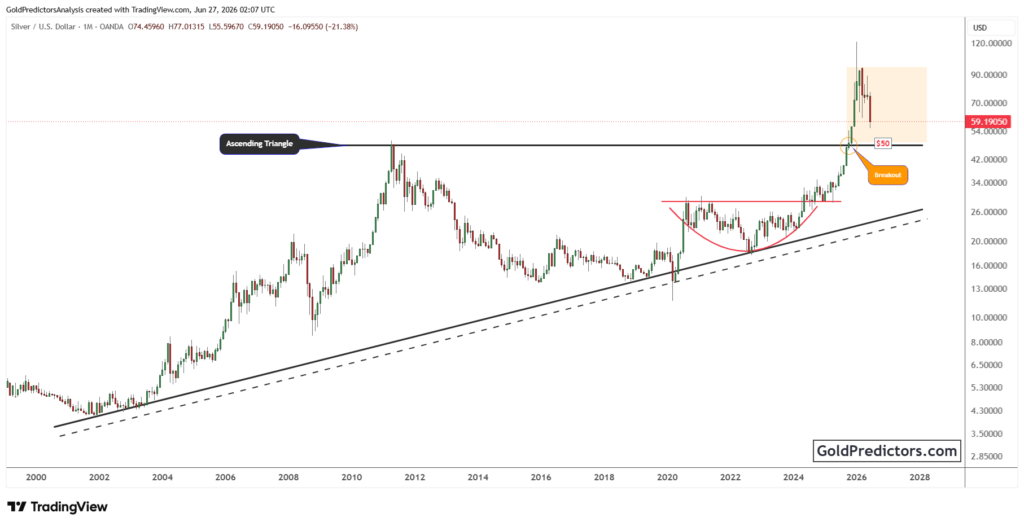
Ascending Triangle Signals Breakout Toward $3,500 Resistance
The gold chart below shows a classic ascending triangle pattern forming in the current market trend. This is a bullish continuation pattern that typically appears during uptrends. The ascending trend line connects a series of higher lows, indicating growing buying pressure over time. Meanwhile, resistance remains firm at the $3,430 level, with an upper resistance near $3,500. The market has tested this resistance zone multiple times without a successful breakout, yet.
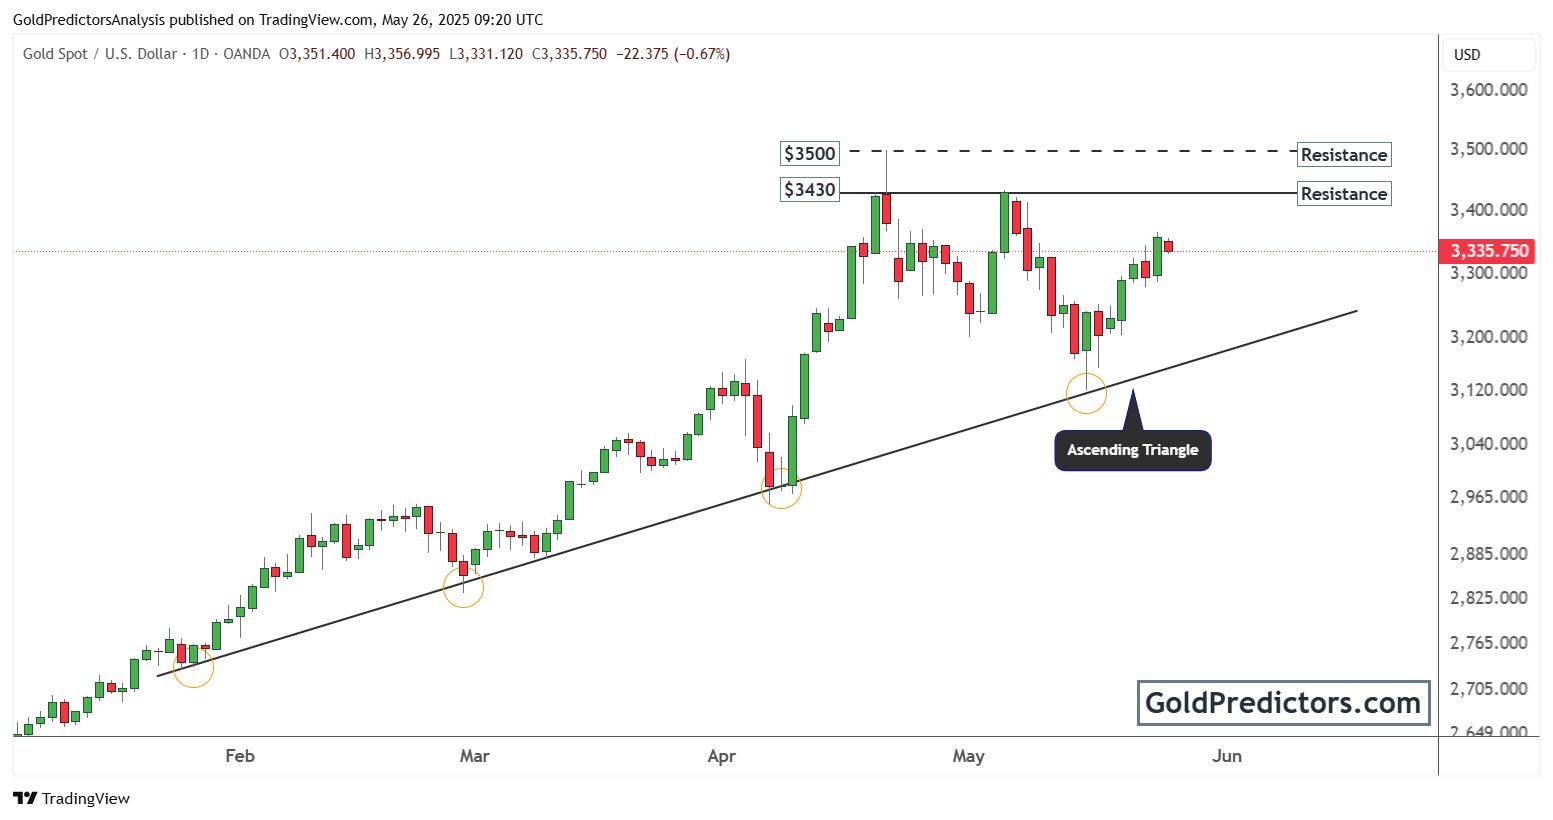
The triangle’s formation suggests that the market is coiling and preparing for a decisive move. As the price continues to make higher lows, the probability of breaking above $3,430 increases. If gold breaks out above this level with strong volume, it could trigger a quick rally toward $3,500 and possibly higher.
The psychological and technical resistance at $3,500 is important. A break above this level would invalidate the current consolidation and signal a fresh bullish leg. Traders often look for such formations as strong entry points. With gold currently trading around $3,335, it remains in a favourable position to challenge these resistance levels soon.
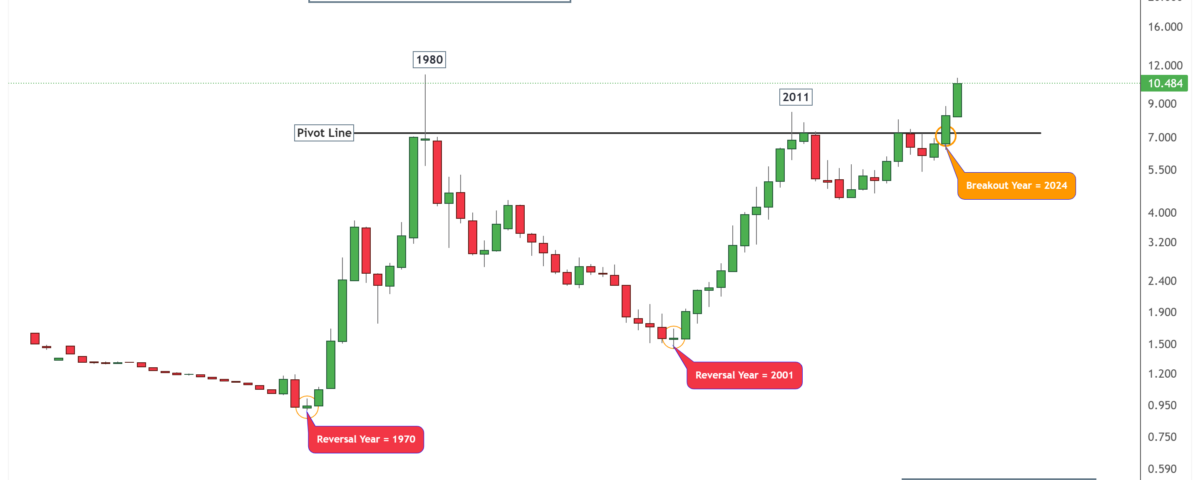
Gold Breaks Long-Term Inflation-Adjusted Resistance, Confirming New Bull Market Phase
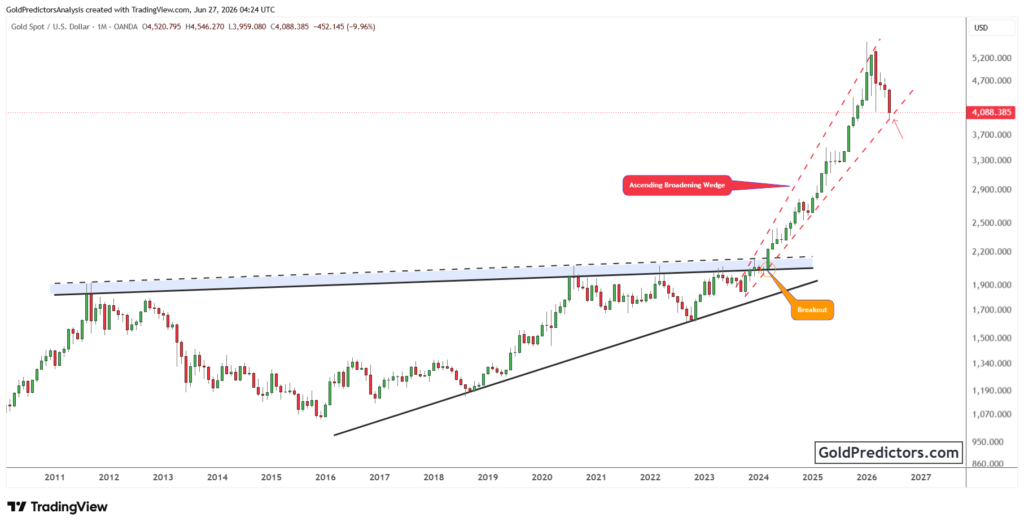
The chart below shows a broader view of gold’s performance when adjusted for inflation. This perspective is critical for understanding the long-term value and trajectory of gold. The chart identifies key reversal years—1970 and 2001, both of which marked the beginning of long-term bull markets. Another pivotal point is the breakout year of 2024.
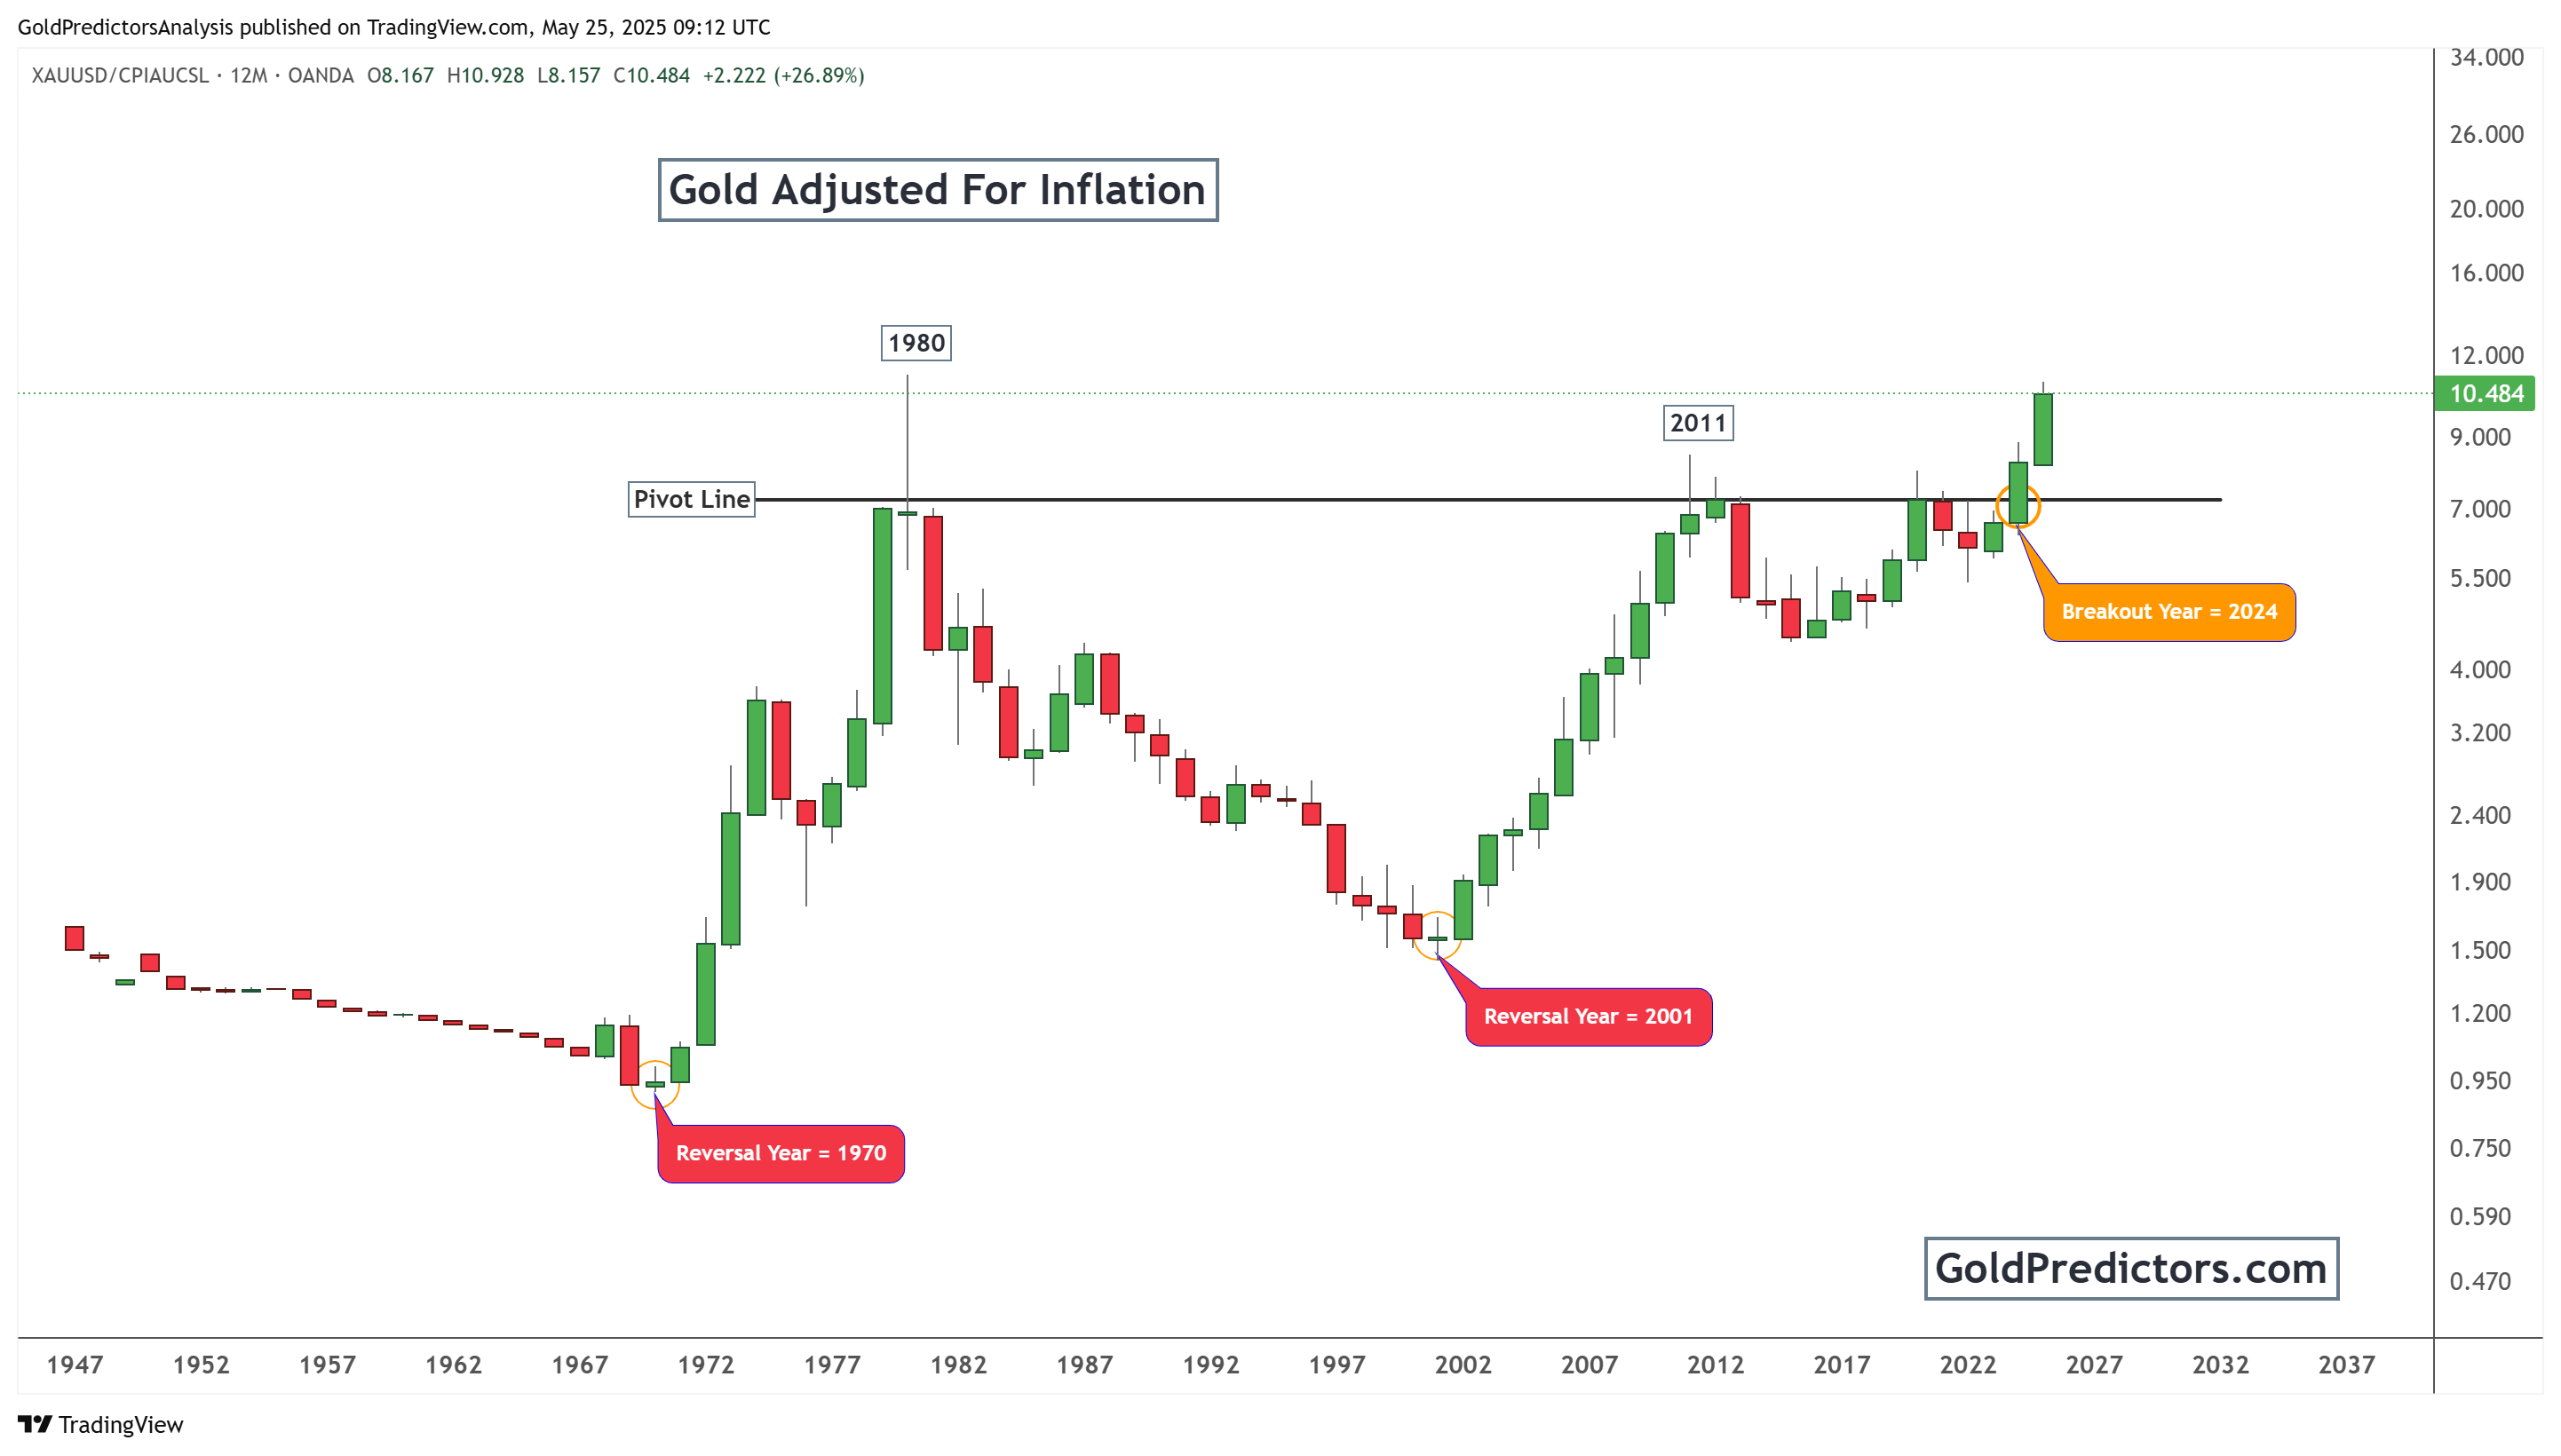
The horizontal pivot line on the chart represents a major resistance zone from historical highs, particularly from the 1980 and 2011 peaks. For decades, this level acted as a ceiling for inflation-adjusted gold prices. However, in 2024, gold decisively broke above this pivot, signalling the start of a new bullish phase.
This breakout is significant because it invalidates the long-standing resistance and sets the stage for exponential growth. The price now stands well above the pivot, indicating strength and sustained momentum. History shows that when gold breaks long-term resistance in inflation-adjusted terms, it often follows with years of sustained gains. Investors should take note of this shift, as it could redefine portfolio strategies in the years ahead.
The magnitude of the breakout also suggests that gold is moving into a new valuation era. It reflects broader economic shifts, including persistent inflation, central bank accumulation, and declining confidence in fiat currencies. These macroeconomic themes support a longer-term bullish trend for gold.
Technical Setup and Historical Breakout Align to Support Gold’s Bullish Outlook
Gold is showing clear signs of strength from technical and historical perspectives. The ascending triangle pattern suggests buyers are steadily gaining control, with higher lows pushing prices toward key resistance. A breakout above $3,430, followed by $3,500, could confirm a new rally phase. These levels are not just technical milestones—they represent a market sentiment and momentum shift.
The long-term, inflation-adjusted chart strengthens the bullish thesis. The breakout above historical resistance in 2024 marks a pivotal moment for gold. This level held firm for decades, but the stage is set for continued appreciation now that it’s been breached. Historical precedent shows that similar breakouts have led to multi-year bull markets, and current macroeconomic forces support this trajectory.
Investors should closely monitor these developments.
The combination of technical setups and long-term macro trends paints a powerful picture. With gold trading above key historical levels and pushing against major resistance zones, the path of least resistance appears upward.
Gold Predictors Premium Membership
Get exclusive short-term and swing trade ideas with precise entry levels, stop-loss, and target prices, including justification and analysis — all delivered directly via WhatsApp.
Our premium service includes deep technical analysis on gold and silver markets. We cover cycle analysis, price forecasting, and key timing levels.
Members also receive a weekly market letter with detailed analysis, commentary from our Chief Analyst, including actionable insights, trade timing, and direction forecasts for gold and silver.
Stay ahead of the market — join our premium community today.