


Gold Price Surges Above Historic Channel with Eyes on $6,000 Target
The gold (XAUUSD) market continues to show powerful long-term bullish signals despite a recent short-term decline in prices. The latest charts suggest that gold has broken out from its historical ascending channel and is now attempting to consolidate above new resistance levels. While the price has pulled back from its recent highs, this correction appears to be part of a broader bullish structure. At the same time, the XAUUSD/SPX ratio is signaling renewed strength in gold compared to equities. These developments are key for long-term investors and traders tracking macroeconomic trends through technical analysis.
Breakout from Historical Channel Signals Aggressive Price Acceleration
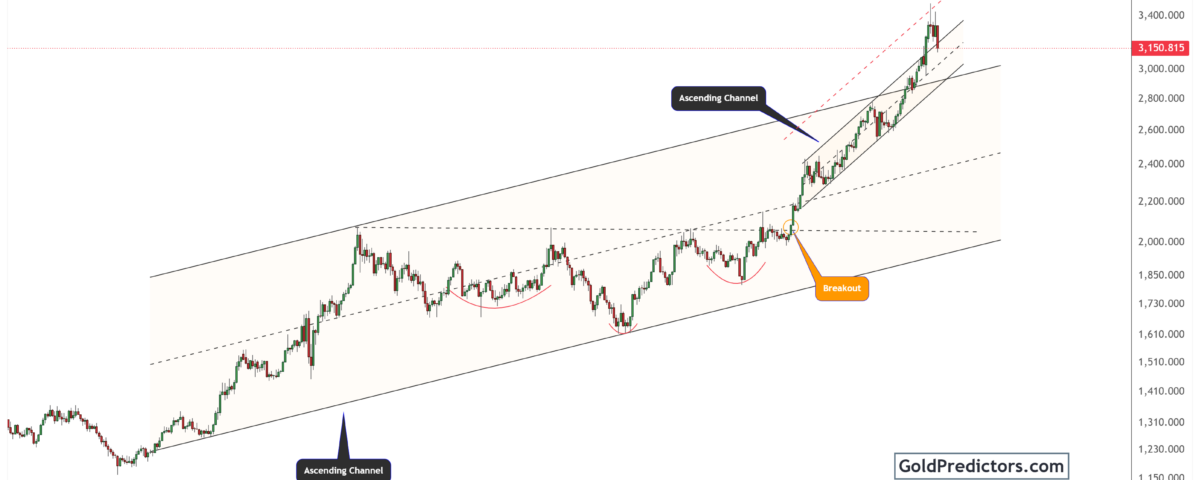
The gold chart below shows a strong long-term ascending channel that began in 2018. This multi-year trend has carried gold from around $1,150 to recent highs above $3,300. The price steadily moved within this channel until mid-2023, when it formed an inverse head and shoulders pattern, which is a reliable bullish reversal signal. After the breakout from this pattern, gold surged past the $2,200 resistance level.
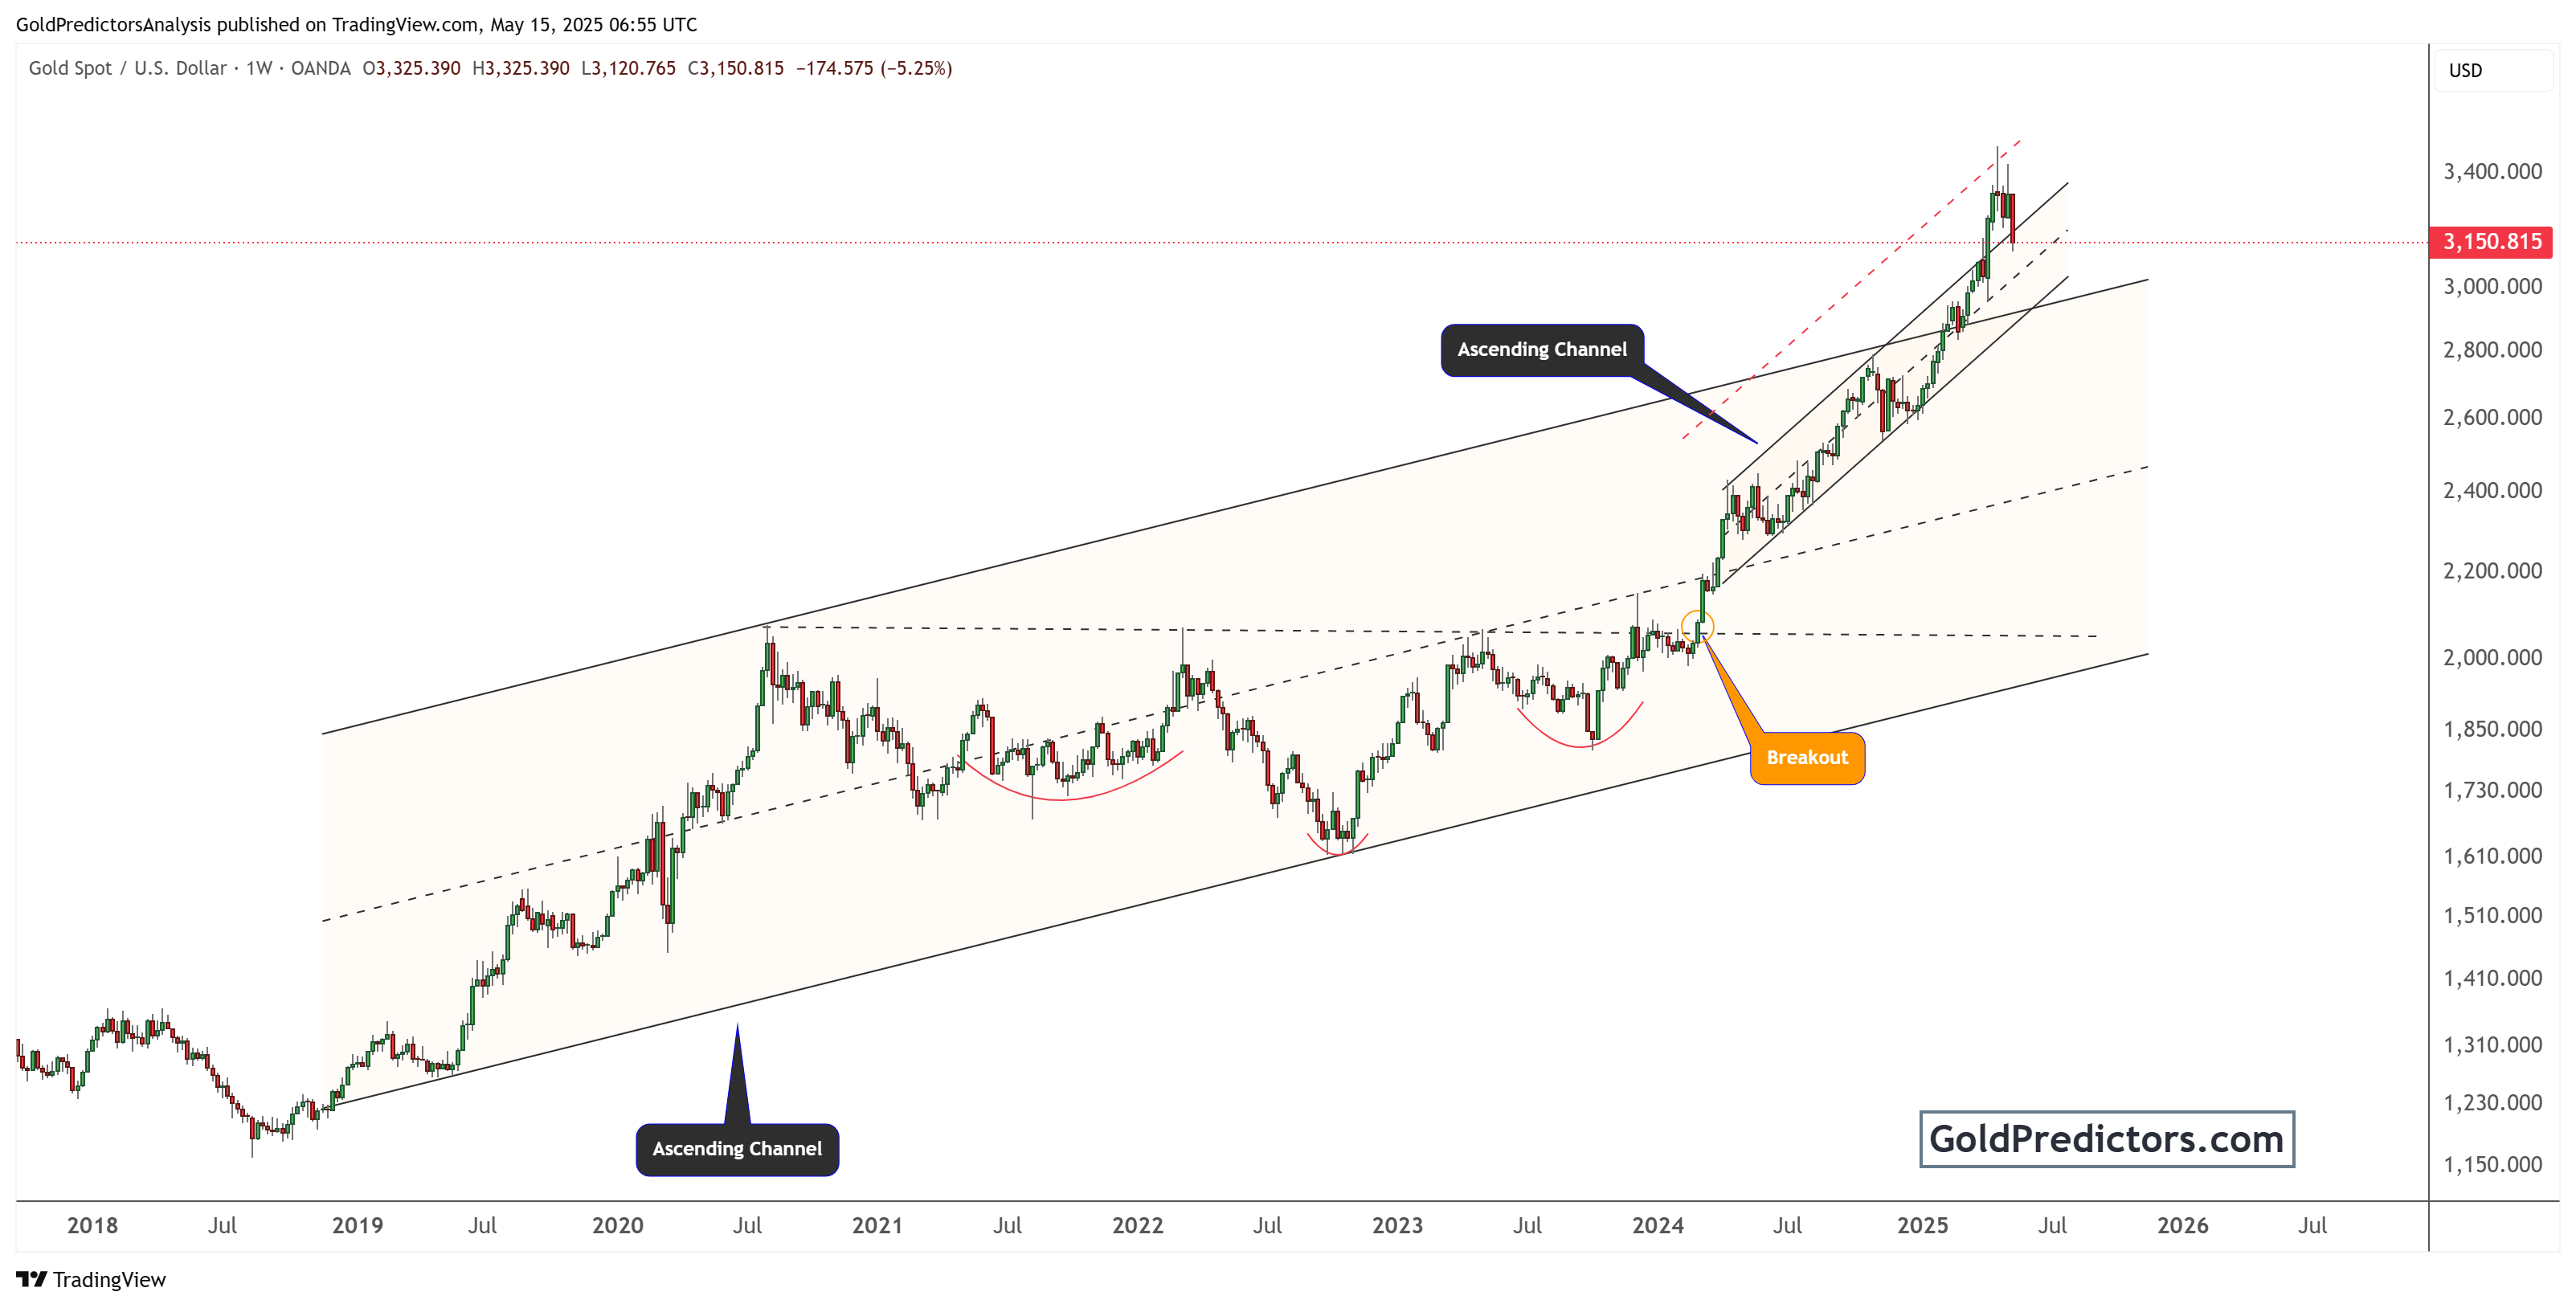
A major breakout occurred in early 2024 when gold decisively moved above the upper boundary of the long-term ascending channel. This event was accompanied by increased bullish momentum and higher volume, validating the breakout. Since then, gold has formed a steeper, narrower ascending channel, showing a more aggressive trend in price appreciation. The price reached a peak at $3,500 before pulling back to $3,123. This correction appears to be a natural retest of the upper boundary of the new short-term channel.
The technical structure supports a long-term bullish case. The breakout from the primary channel and the formation of a higher channel indicate increased demand and strong investor confidence. As long as the price stays above the $2,850–$3,000 support zone, the price has the potential to accelerate towards the $4,000 and $6,000 levels.
Gold vs. Equities: XAU/SPX Ratio Confirms Shift Toward Safe-Haven Assets
The chart below shows a significant reversal in the monthly gold (XAUUSD) to S&P 500 (SPX) ratio after more than a decade of weakness. From the 2011 peak to the 2022 bottom, gold consistently underperformed equities. However, since late 2022, the ratio has shown signs of bottoming. Two inverse head and shoulders patterns emerged between 2019 and 2024, suggesting a long-term bullish reversal.
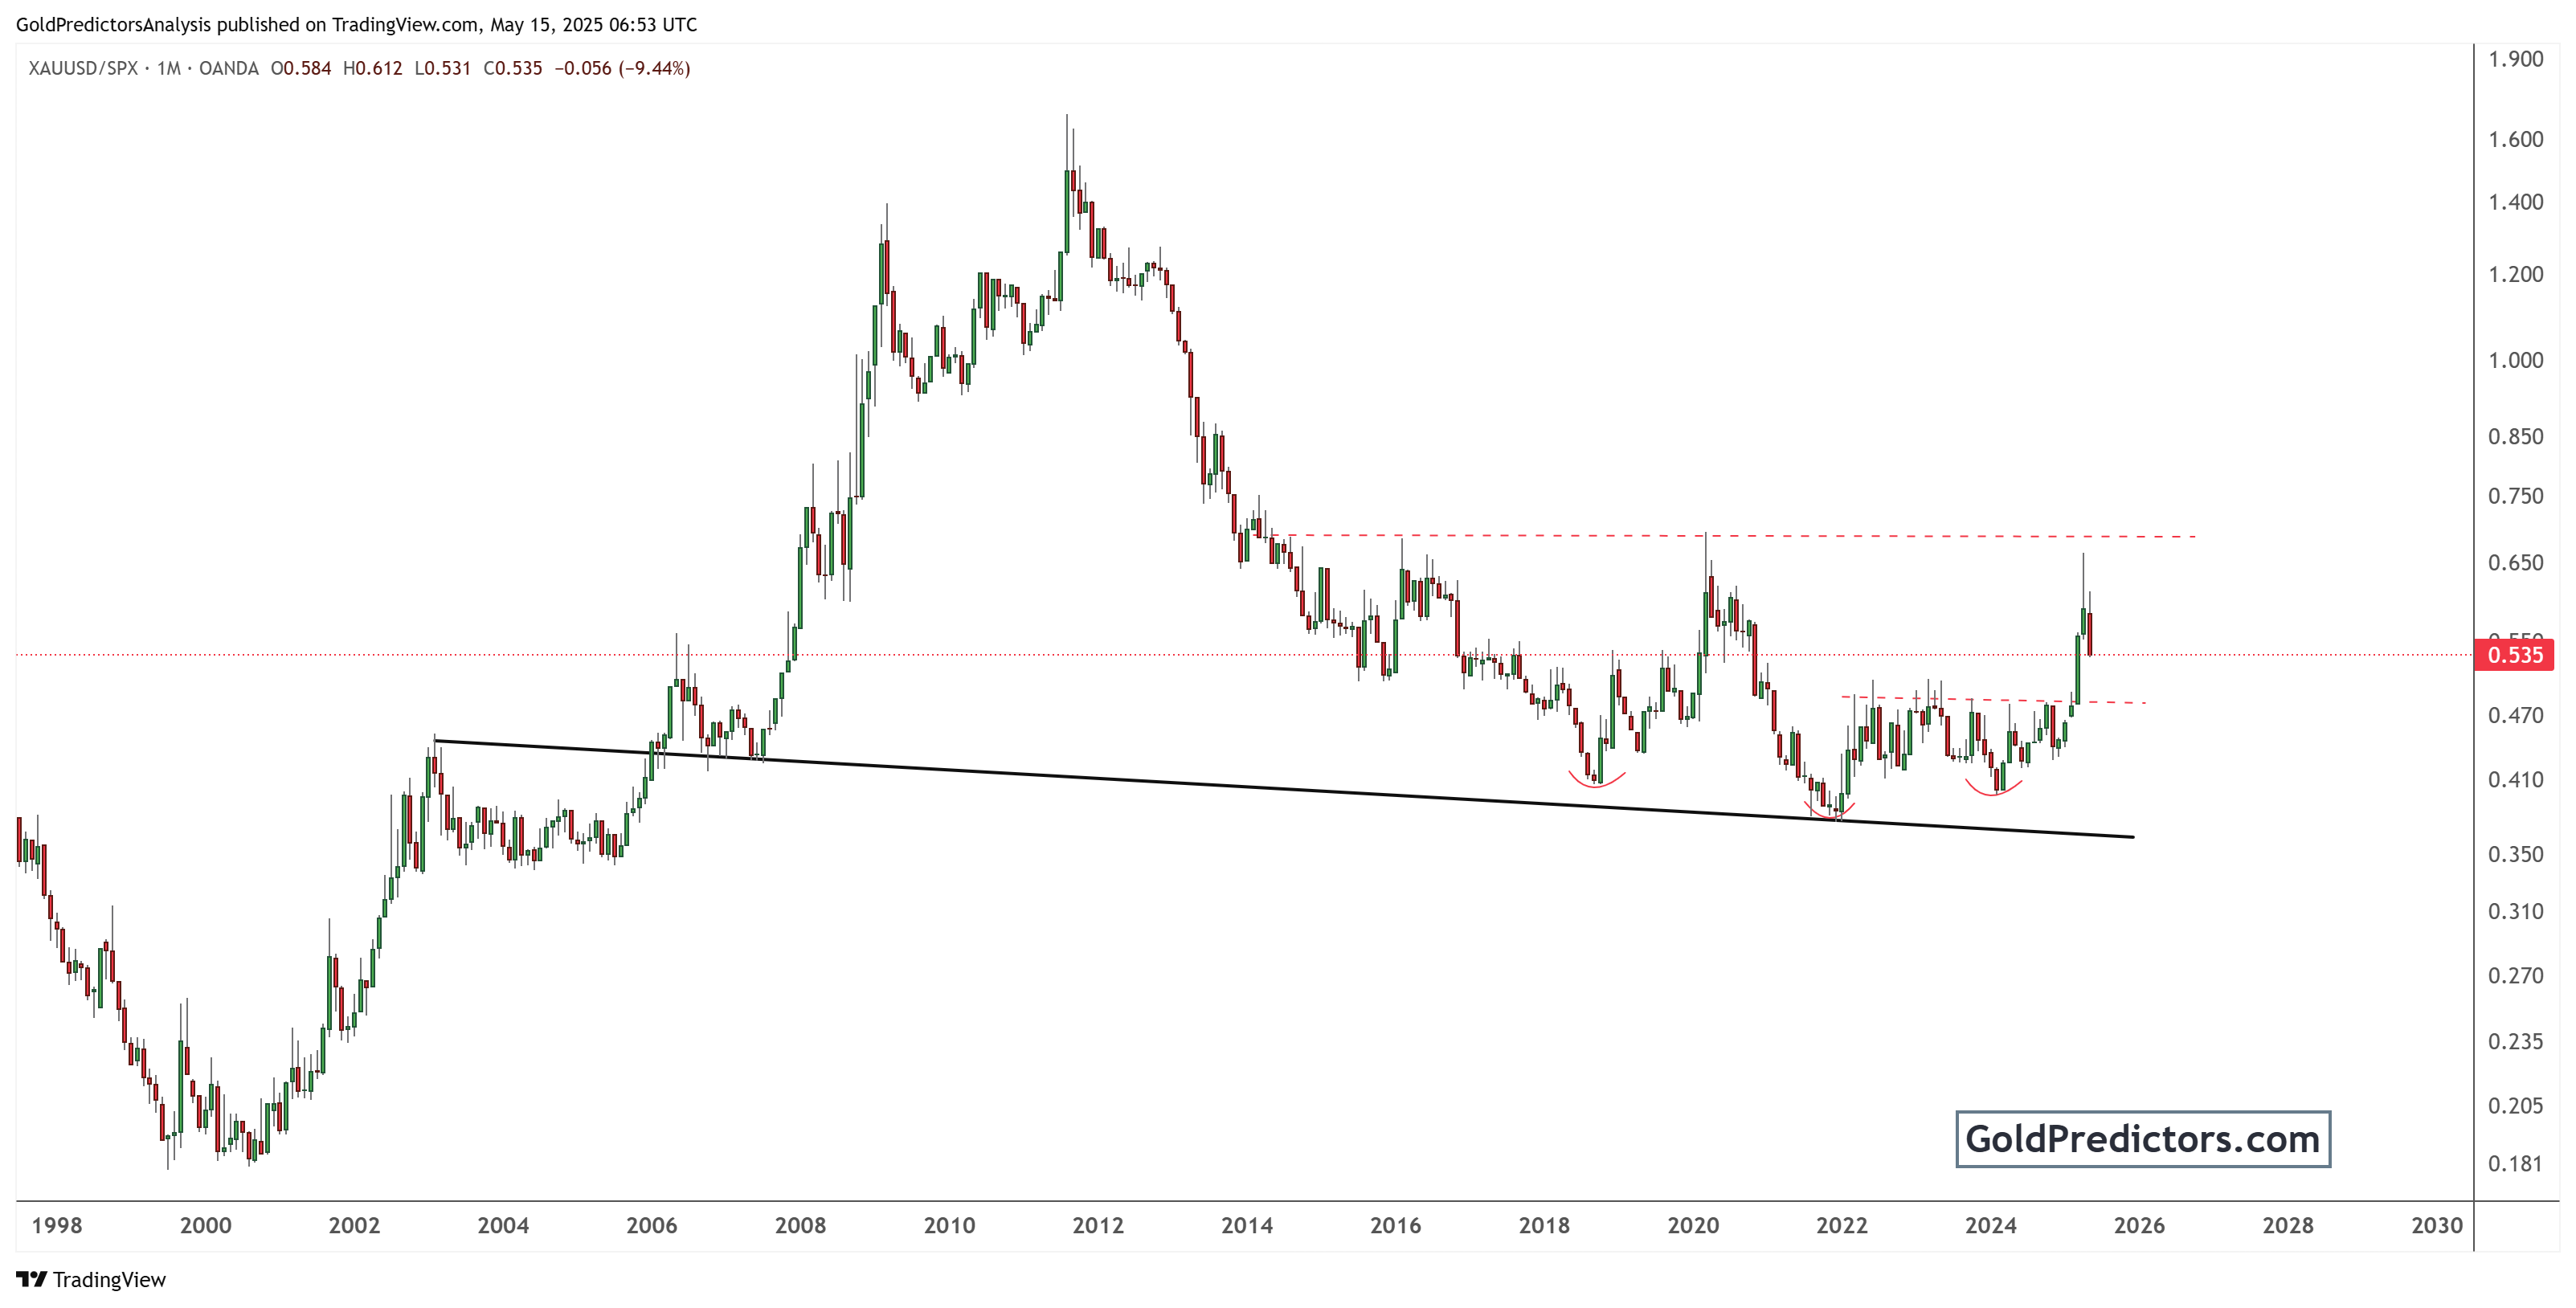
In 2024, the ratio broke above a critical resistance level at around 0.475. This resistance had held firm for nearly a decade. After the breakout, the ratio surged to a high of 0.612 before experiencing a correction to 0.535. Despite the pullback, this move is still above the breakout level, which now acts as strong support.
The breakout in the ratio means gold is outperforming the broader equity market. This is significant for portfolio managers and macro investors. A rising ratio often coincides with increased market uncertainty, inflationary pressures, or declining confidence in fiat assets. If the ratio sustains above 0.475, it could lead to a prolonged phase of gold bullish momentum.
Conclusion: Technical Indicators Suggest Gold’s Uptrend Remains in Play
The gold market shows strong signs of continued growth despite the recent price pullback. The breakout above the long-term ascending channel confirms that gold is in a solid uptrend. This price correction looks like a natural part of the trend and provides a good entry point for investors.
The ratio of gold to the equity market has also broken important resistance levels. This signals that gold is gaining strength compared to stocks. Such a move often happens when investors seek safer assets amid uncertainty or inflation concerns.
Overall, the technical charts support a bullish outlook for gold. The price action and relative strength versus equities point to further upside potential. Investors and traders should watch key support zones to confirm the trend’s strength and position themselves accordingly.
Gold Predictors Premium Membership
Get exclusive short-term and swing trade ideas with precise entry levels, stop-loss, and target prices, including justification and analysis — all delivered directly via WhatsApp.
Our premium service includes deep technical analysis on gold and silver markets. We cover cycle analysis, price forecasting, and key timing levels.
Members also receive a weekly market letter with detailed analysis, commentary from our Chief Analyst, including actionable insights, trade timing, and direction forecasts for gold and silver.
Stay ahead of the market — join our premium community today.


