


Gold (XAUUSD) Swing Trade Case Study: How $1996 Became a Major Buy Zone
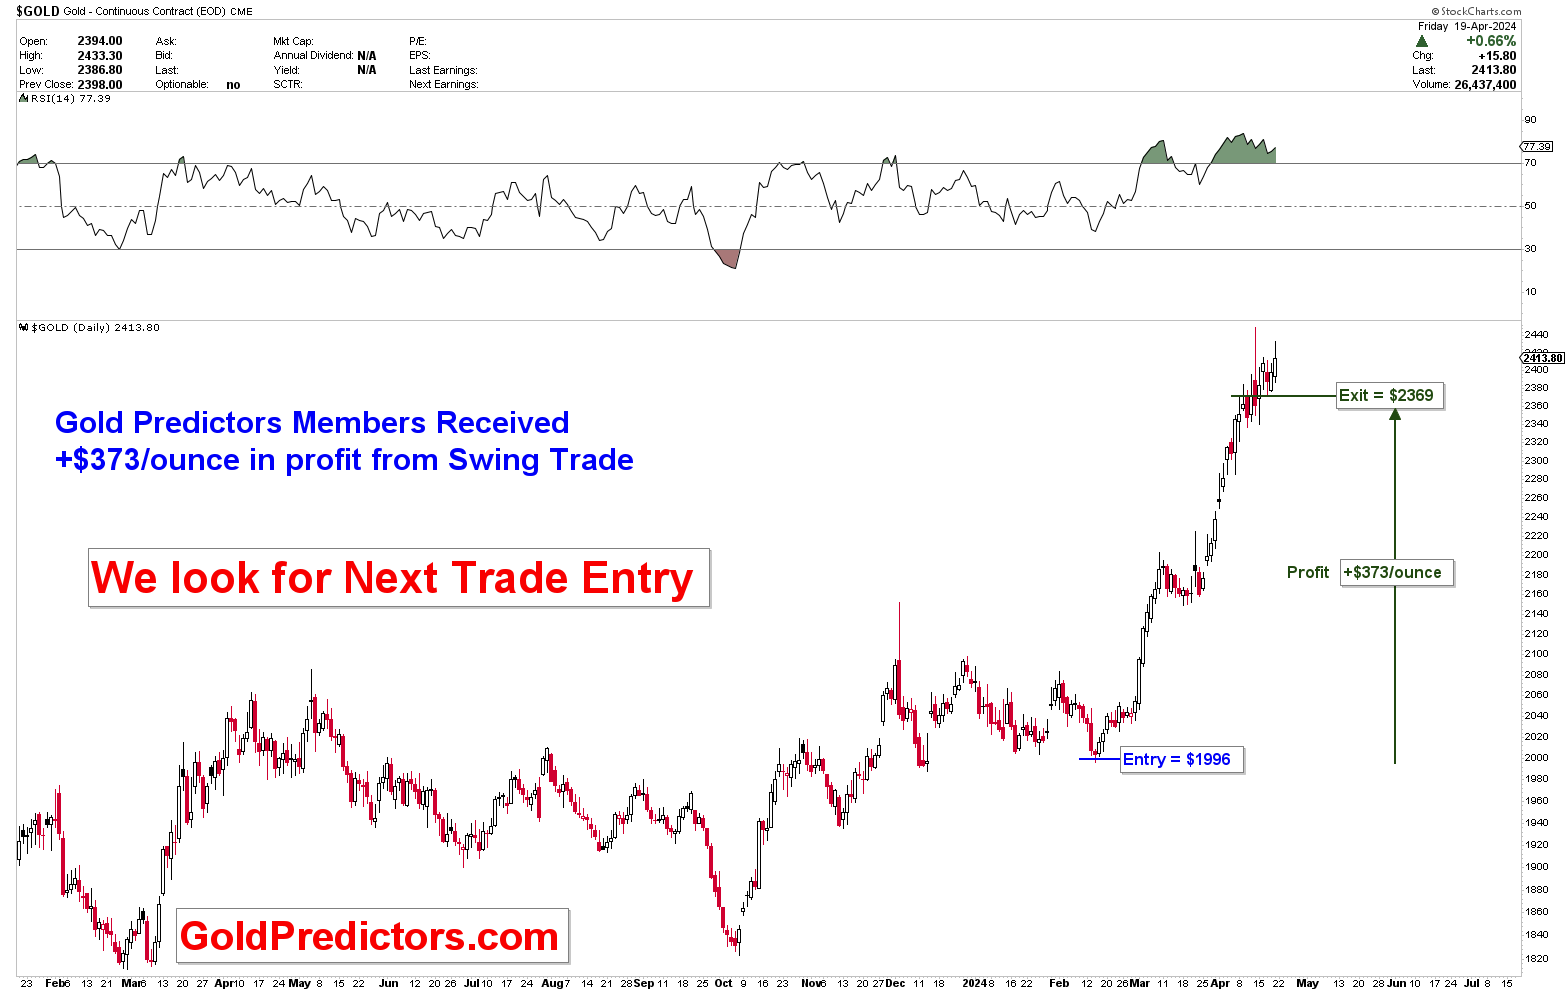
This gold swing trade case study highlights a successful real-money setup executed in early 2024. The trade setup features a $373/ounce profit from a well-timed entry at $1,996 and exit at $2,369. The trade reflects the application of technical analysis, seasonal timing, and macroeconomic context—all essential tools in gold market trading. Traders can study this breakdown to identify similar low-risk, high-reward opportunities in future price action. The structure and reasoning behind this trade offer valuable insight for anyone analysing XAU/USD market behaviour.
Gold (XAUUSD) Trade Summary
Instrument: Spot Gold (XAU/USD)
Trade Type: Medium-Term Swing Trade
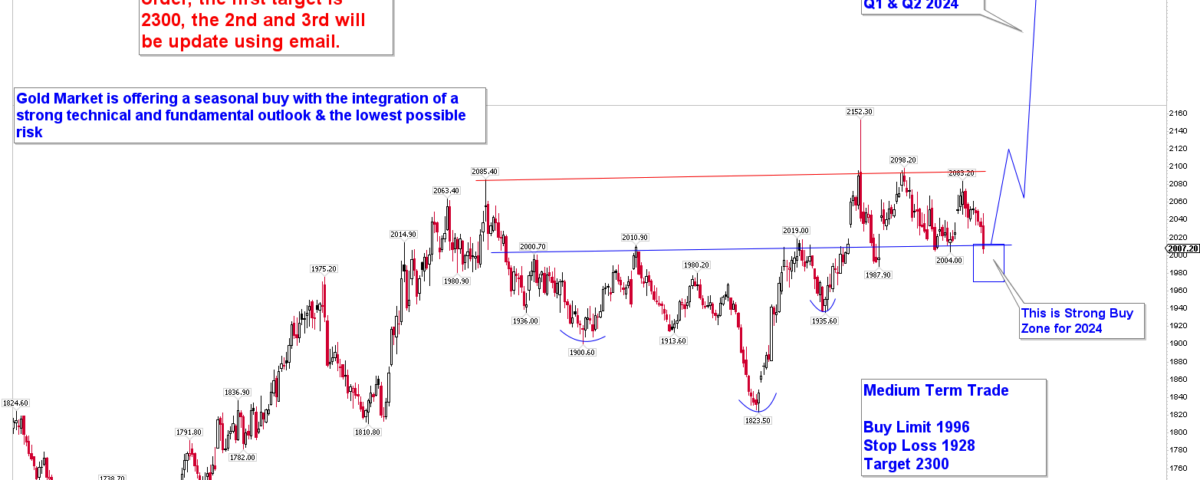
Entry Price: $1996 (Buy Limit Order)
Stop Loss: $1928
Target: $2300 (Initial), extended to $2369 (Final Exit)
Trade Duration: February 13, 2024 – April 19, 2024
Profit: +$373 per ounce
Chart-Based Strategy and Technical Justification
On February 13, 2024, a buy limit at $1996 was delivered to premium members, as gold reached a strong seasonal and technical support zone, highlighted on the chart as a “Strong Buy Zone for 2024.” The trade was triggered after a few hours of the delivery of the signal. The technical rationale was based on:
- Major horizontal support near $1990–$2000, which had previously acted as resistance (multiple tests in late 2023).
- Double-bottom structure near $1980 and $1823, indicating base formation and bullish reversal.
- Seasonal pattern: February historically marks a low-risk accumulation window for gold before Q2 rallies.
- Medium-term trendline support and consolidation breakout potential.
The setup defined a low-risk, high-reward swing trade, with an initial stop loss at $1928 and a target of $2300, as mentioned in the original trade plan.
Gold Trade Execution at $1996
Gold initially dipped slightly after the entry but quickly reversed. The price broke out of the consolidation range by late March, gaining strong momentum.
- Breakout confirmation: Gold moved above the $2,075 mark in March 2024, confirming trend continuation.
- Momentum Indicators: RSI entered overbought territory but stayed elevated, showing strength and institutional flow.

Trade Outcome: Exit at $2369
On April 12, 2024, the position was closed at $2369, producing a profit of $373 per ounce from the $1996 entry.
- This marked a +18.7% gain, a significant return in less than two months.
- The exit aligned with technical overextension and RSI overheating, justifying profit-taking.
Fundamental Drivers Behind the Gold Trade and the Major Buy Zone
The trade was not only supported by technical factors but also by macroeconomic and fundamental conditions at the time:
Central Bank Gold Buying
Central banks were set to buy 1,000 metric tons of gold in 2024, continuing the de-dollarisation trend. This long-term demand floor supported medium-term bullish outlooks.
US Economic Concerns
In Q1 2024, investors began pricing in potential Fed rate cuts due to rising jobless claims and softening inflation, which weakened the dollar. This macro backdrop created tailwinds for non-yielding assets like gold.
Geopolitical Tensions and Tariff Risks
Renewed tensions around global trade and US-China relations added safe-haven demand. Combined with real interest rates softening, gold’s bullish fundamentals aligned with the technical breakout.
Key Takeaways and Lessons Learned
- Seasonal Patterns Matter: February provided a low-risk entry supported by multi-year seasonality.
- Confluence of Support: Horizontal, trendline, and psychological support levels aligned near $1996.
- Ride the Momentum, Exit at Strength: The position was held through the breakout and closed when signs of short-term exhaustion appeared.
- Fundamentals Amplify Technical Setups: Central bank demand and macro conditions added conviction to the trade.
What You Can Learn from This Trade
- Enter trades with defined levels: entry, stop, target.
- Wait for the price to reach high-confluence zones before acting.
- Use seasonal context as part of your multi-layer analysis.
- Be patient with swing trades; the strongest moves often come late.
- Don’t hesitate to adjust targets upward when technical momentum accelerates.
Summary
This gold swing trade from $1996 to $2369 delivered a powerful example of how structured, evidence-backed trading can result in consistent profits. It combined technical precision, fundamental alignment, and patient execution.
To see the performance of all trades, please visit the performance page below.
Stay tuned for the next trade setup at Gold Predictors.
Gold Predictors Premium Membership
Get exclusive short-term and swing trade ideas with precise entry levels, stop-loss, and target prices, including justification and analysis — all delivered directly via WhatsApp.
Our premium service includes deep technical analysis on gold and silver markets. We cover cycle analysis, price forecasting, and key timing levels.
Members also receive a weekly market letter with detailed analysis, commentary from our Chief Analyst, including actionable insights, trade timing, and direction forecasts for gold and silver.
Stay ahead of the market — join our premium community today.
