


Why Gold’s Rally Is Just Beginning: Technical Breakouts and US Dollar Weakness Explained
The gold (XAUUSD) market has captured global attention with its powerful surge to new highs. However, the price has started consolidating after the drop from $3,500. Investors are closely monitoring whether this pullback signals a temporary pause or a continuation of the broader bullish trend. Technical patterns and historical movements clearly illustrate gold’s strengthening position against the US dollar. This article discusses the bullish setup in gold and explores the relationship between the US dollar and gold prices.
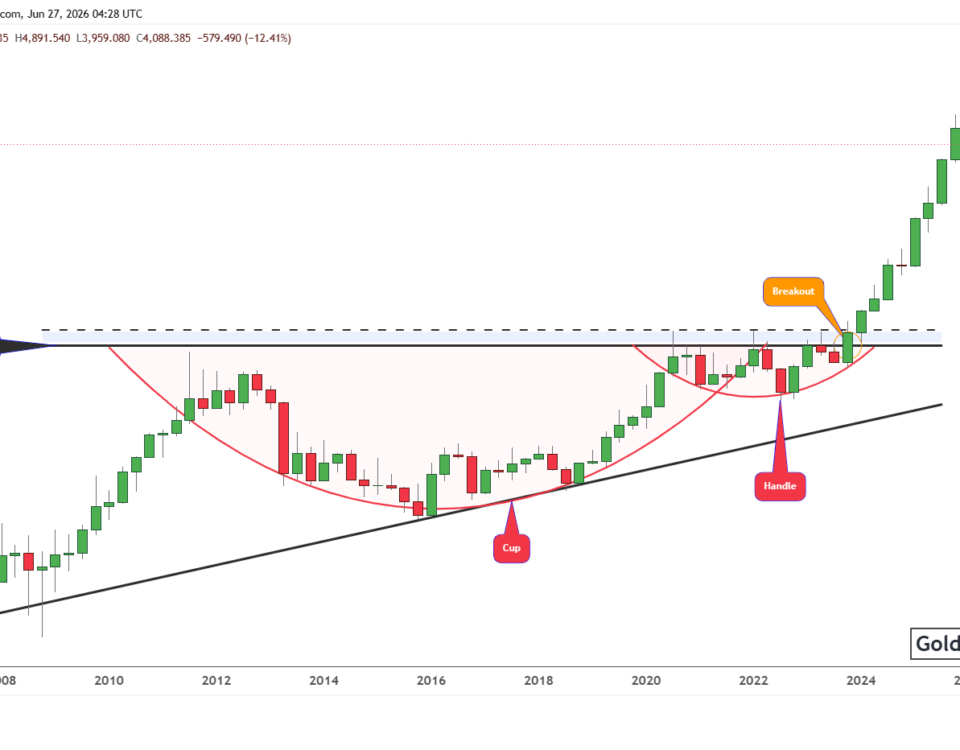
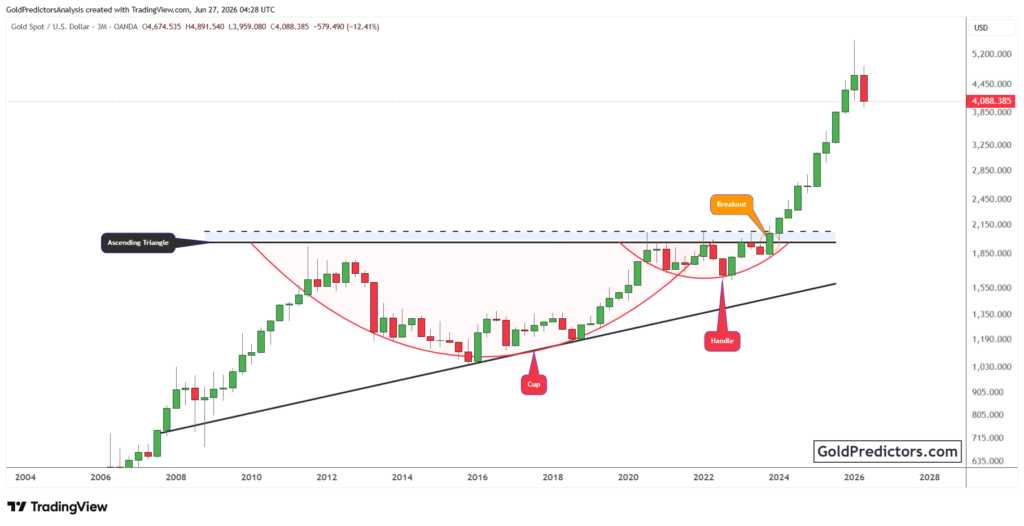
Gold’s Cup and Handle Pattern Signals Massive Upside
The weekly chart for gold shows a classic cup pattern that has been forming over several years. This bullish pattern developed from 2020 to early 2024. The base of the cup formed between mid-2020 and mid-2022, where gold prices consolidated after a steep rally. This smooth and rounded bottom indicated strong support levels and consistent buying pressure over time.
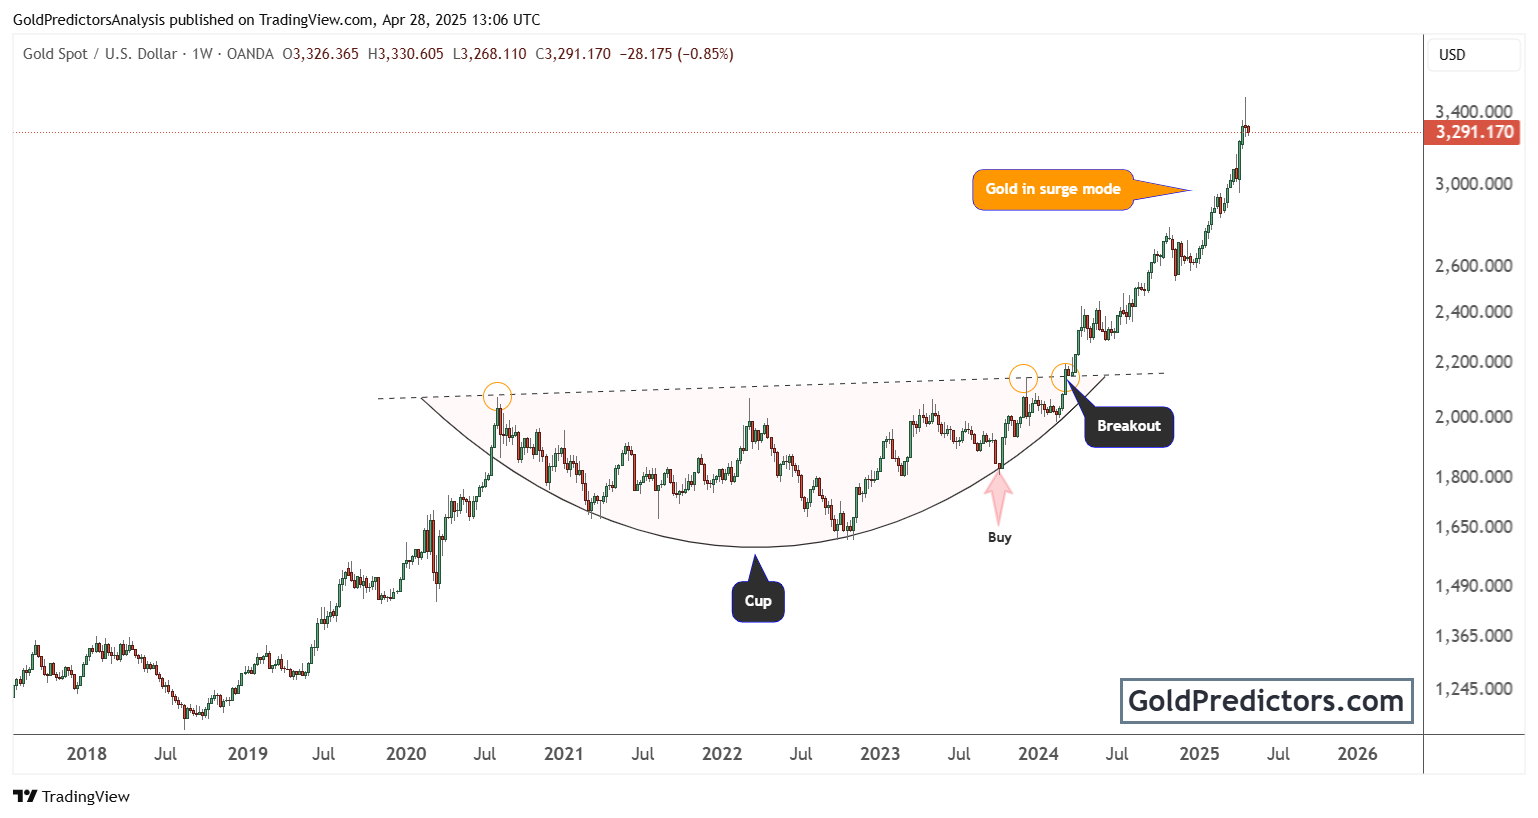
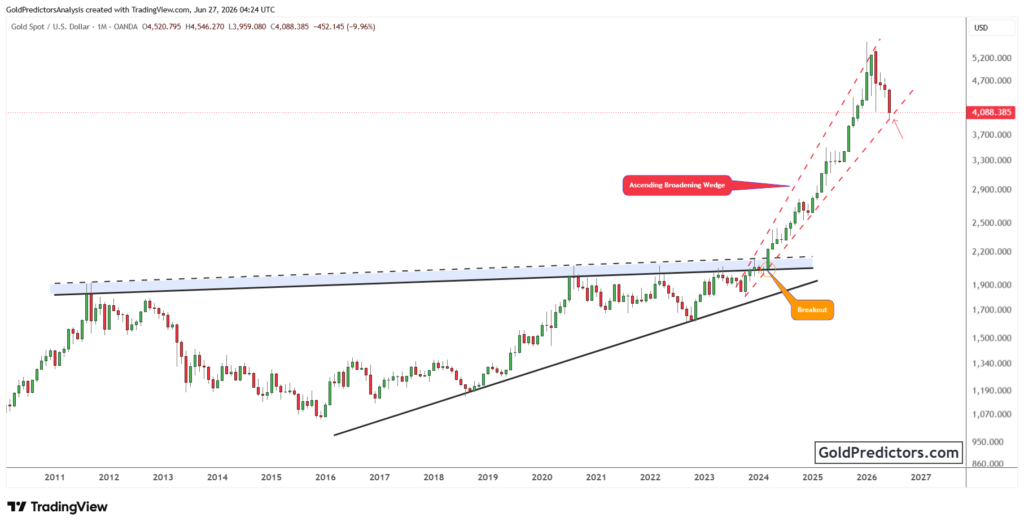
In 2024, gold broke out above the resistance zone around $2,100. This breakout was decisive, with substantial volume, confirming the validity of the pattern. After the breakout, gold entered a surge mode, rallying sharply above $3,200 by early 2025. In April 2025, the gold price reached a record high of $3,500 before beginning its correction.
The clear “Buy” signal appeared at the edge of the cup around $2,100, confirming the beginning of a strong upward trend. Technical traders often use the depth of the cup to project the potential upside target. In this case, the gold rally exceeded expectations and moved into a parabolic phase.
The chart clearly shows that gold is in a strong bullish trend, supported by long-term accumulation and a confirmed breakout of a significant technical pattern. This move signals a notable shift in investor sentiment toward gold as a preferred investment.
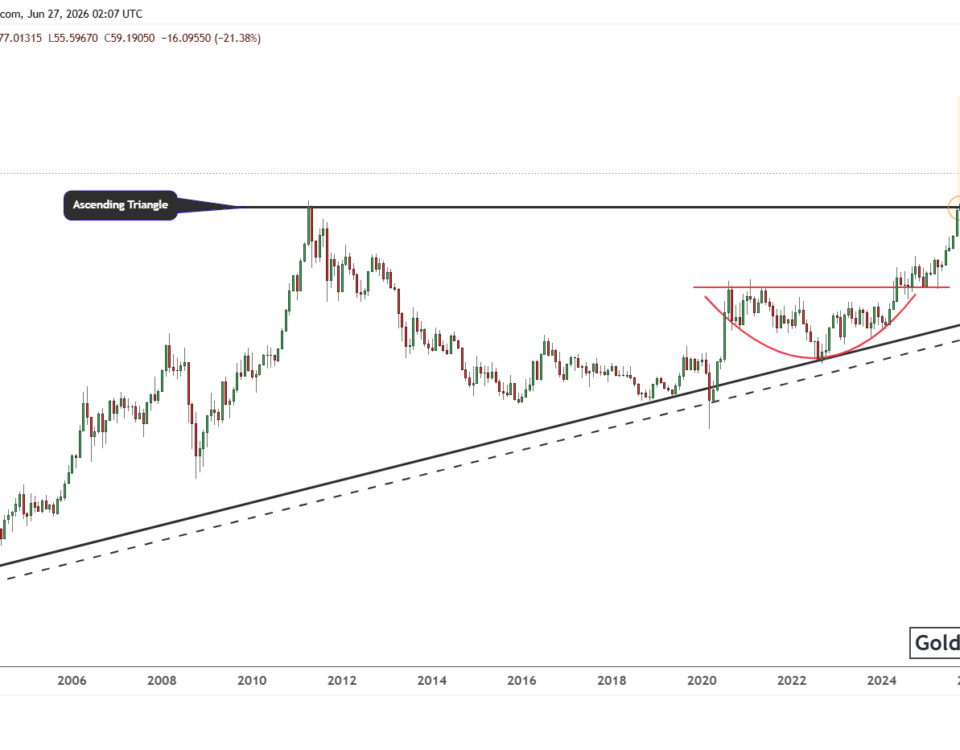
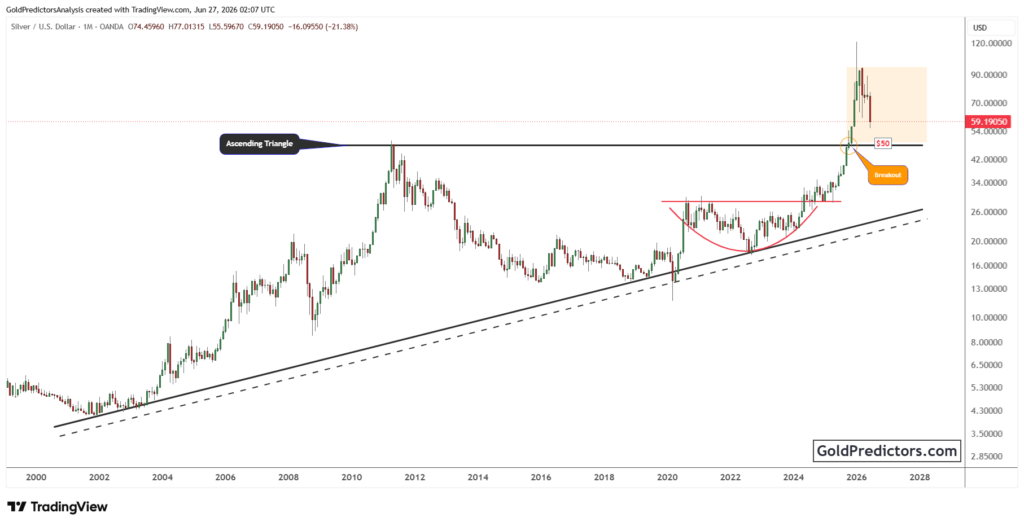
Why Gold Outperforms the US Dollar over Decades?
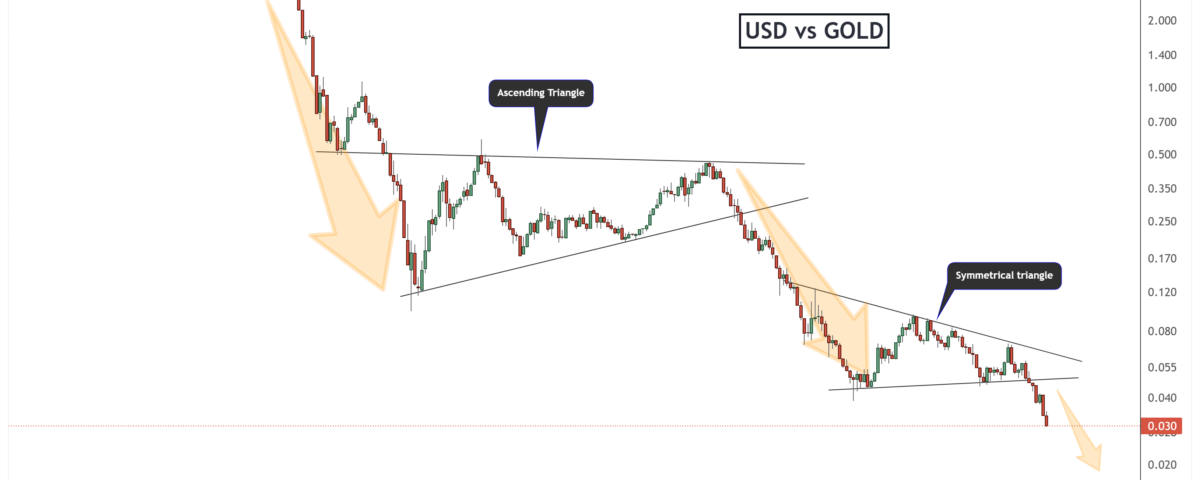
The quarterly chart for gold shows a broader historical view by comparing the US Dollar against gold over several decades. Starting from the 1970s, the US Dollar has been in a prolonged downtrend relative to gold. The chart highlights critical technical patterns, including the ascending triangle and the symmetrical triangle.
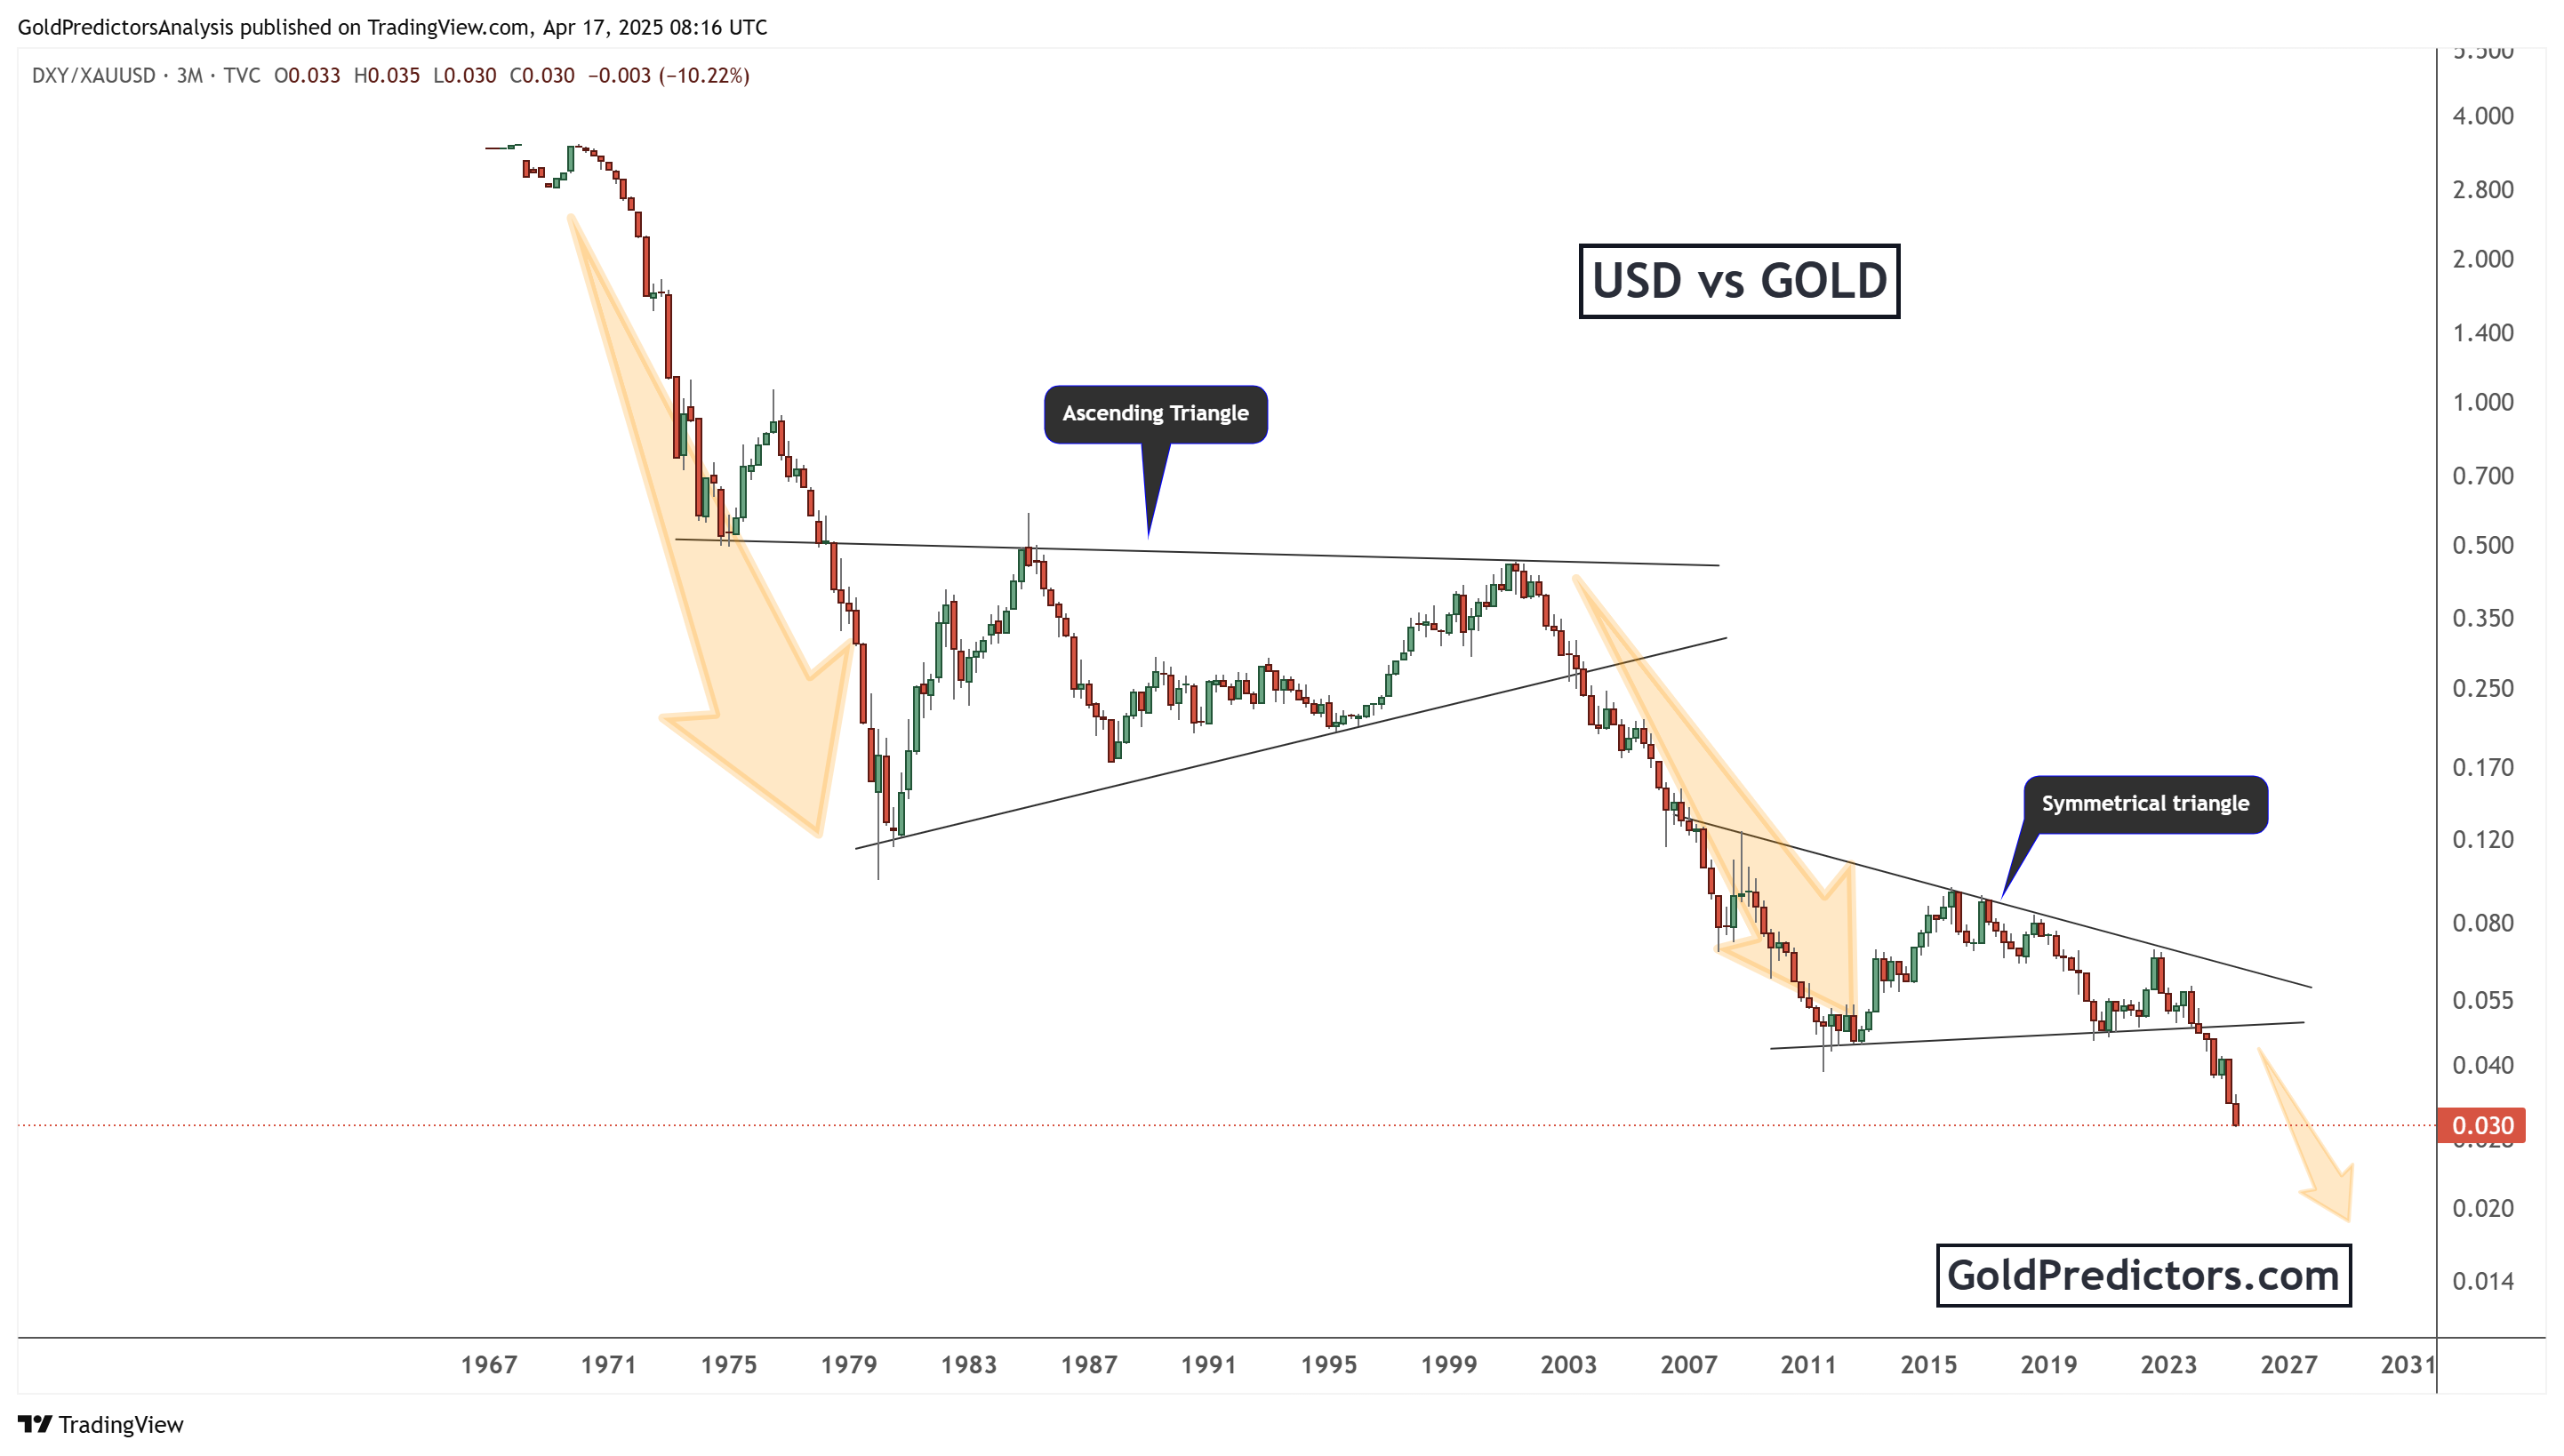
Between 1980 and 2000, the US dollar formed an ascending triangle pattern. Despite multiple attempts to break higher, the dollar failed to sustain gains against gold. After a breakdown in the early 2000s, the US dollar entered another significant downtrend phase.
Moreover, a symmetrical triangle pattern emerged between 2010 and 2023. This pattern indicated continued pressure for the dollar with lower highs and higher lows compressing into a tighter range. The breakout from the symmetrical triangle occurred in 2024, confirming the next leg of the downtrend.
The USD/Gold ratio has dropped to just 0.030, with a further downward trajectory indicated by the technical breakdown. Large yellow arrows on the chart emphasize the magnitude of the decline. A weaker US dollar typically supports gold prices, which aligns with the breakout and rise in gold shown in the chart above.
The historical perspective shows that structural weaknesses in the US dollar are essential. These weaknesses, driven by inflation, monetary policy, and global de-dollarization trends, are contributing to a super-bullish outlook for gold. As the US dollar continues to lose value against gold, the long-term trend strongly favors holding gold assets.
Conclusion: Why the Dollar Keeps Losing to Gold
Gold’s breakout signals a significant shift in the market. The strong bullish price structure in the gold market supports a powerful bullish phase. Moreover, the long-term weakness of the US dollar further strengthens gold’s outlook. Historical patterns show that the dollar has steadily lost value against gold for decades. Recent breakdowns in the USD vs. gold chart suggest that this trend will continue.
Looking ahead, gold appears ready for further gains. The combination of technical breakouts and dollar weakness creates a strong foundation for higher prices. Any correction in gold is considered an opportunity to buy.
Gold Predictors Premium Membership
Get exclusive short-term and swing trade ideas with precise entry levels, stop-loss, and target prices, including justification and analysis — all delivered directly via WhatsApp.
Our premium service includes deep technical analysis on gold and silver markets. We cover cycle analysis, price forecasting, and key timing levels.
Members also receive a weekly market letter with detailed analysis, commentary from our Chief Analyst, including actionable insights, trade timing, and direction forecasts for gold and silver.
Stay ahead of the market — join our premium community today.