


Gold Market Decline Driven by Fed’s Hawkish Tone Presents Buying Opportunity
The recent downtrend in gold prices was triggered by the hawkish tone set during the U.S. Federal Reserve’s policy meeting, compounded by stronger-than-expected business PMI data from the United States. The preliminary U.S. Composite PMI surged to its highest level over two years, showing significant growth from the previous month. This robust data and the Fed’s hawkish remarks have dampened aggressive rate cut expectations for the year, exerting additional downward pressure on gold prices. On the other hand, the technical picture also confirmed a strong breakdown from the descending triangle, indicating a strong drop. However, this drop is a strong gold buying opportunity for medium to long-term investors. Investors can consider buying the dip scenarios during May and June 2024.
Gold Prices Under Pressure Amid Fed’s Hawkish Stance
The gold prices induced the downtrend after the hawkish tone set by the U.S. Federal Reserve’s policy meeting. This decline was also driven by stronger-than-expected business PMI data from the United States (U.S). The preliminary U.S. Composite PMI, which tracks the manufacturing and services sectors, jumped to 54.4 this month, the highest level since April 2022, up from a final reading of 51.3 in April. This strong U.S. data, combined with recent hawkish remarks from the Fed, has tempered aggressive Fed rate cut expectations for the year, placing additional downward pressure on the Gold price. The Fed Minutes highlighted a willingness to tighten policy further if inflation risks materialize, increasing concerns about persistent inflation due to significant increases in goods and services prices.
The reduction in bets for multiple Fed rate cuts in 2024 has led to a stronger U.S. Dollar, drawing safe-haven flows away from Gold. Additionally, the expectation of higher interest rates has negatively affected global stocks, which traditionally support Gold; however, the inverse relationship between Gold and the U.S. Dollar has overshadowed this effect. Furthermore, supply-side concerns have emerged after reports from Reuters about Russian metals giant Nornickel’s plans to construct a platinum group metals refinery in Bahrain, which could increase precious metals supply and further pressure Gold prices. Gold appears vulnerable as the U.S. Dollar enters a bullish consolidation phase, supported by rising U.S. Treasury bond yields and critical upcoming economic data. The market is now waiting for new catalysts for the next direction.
Understanding the Technical Breakdown in Gold & Buying Opportunity
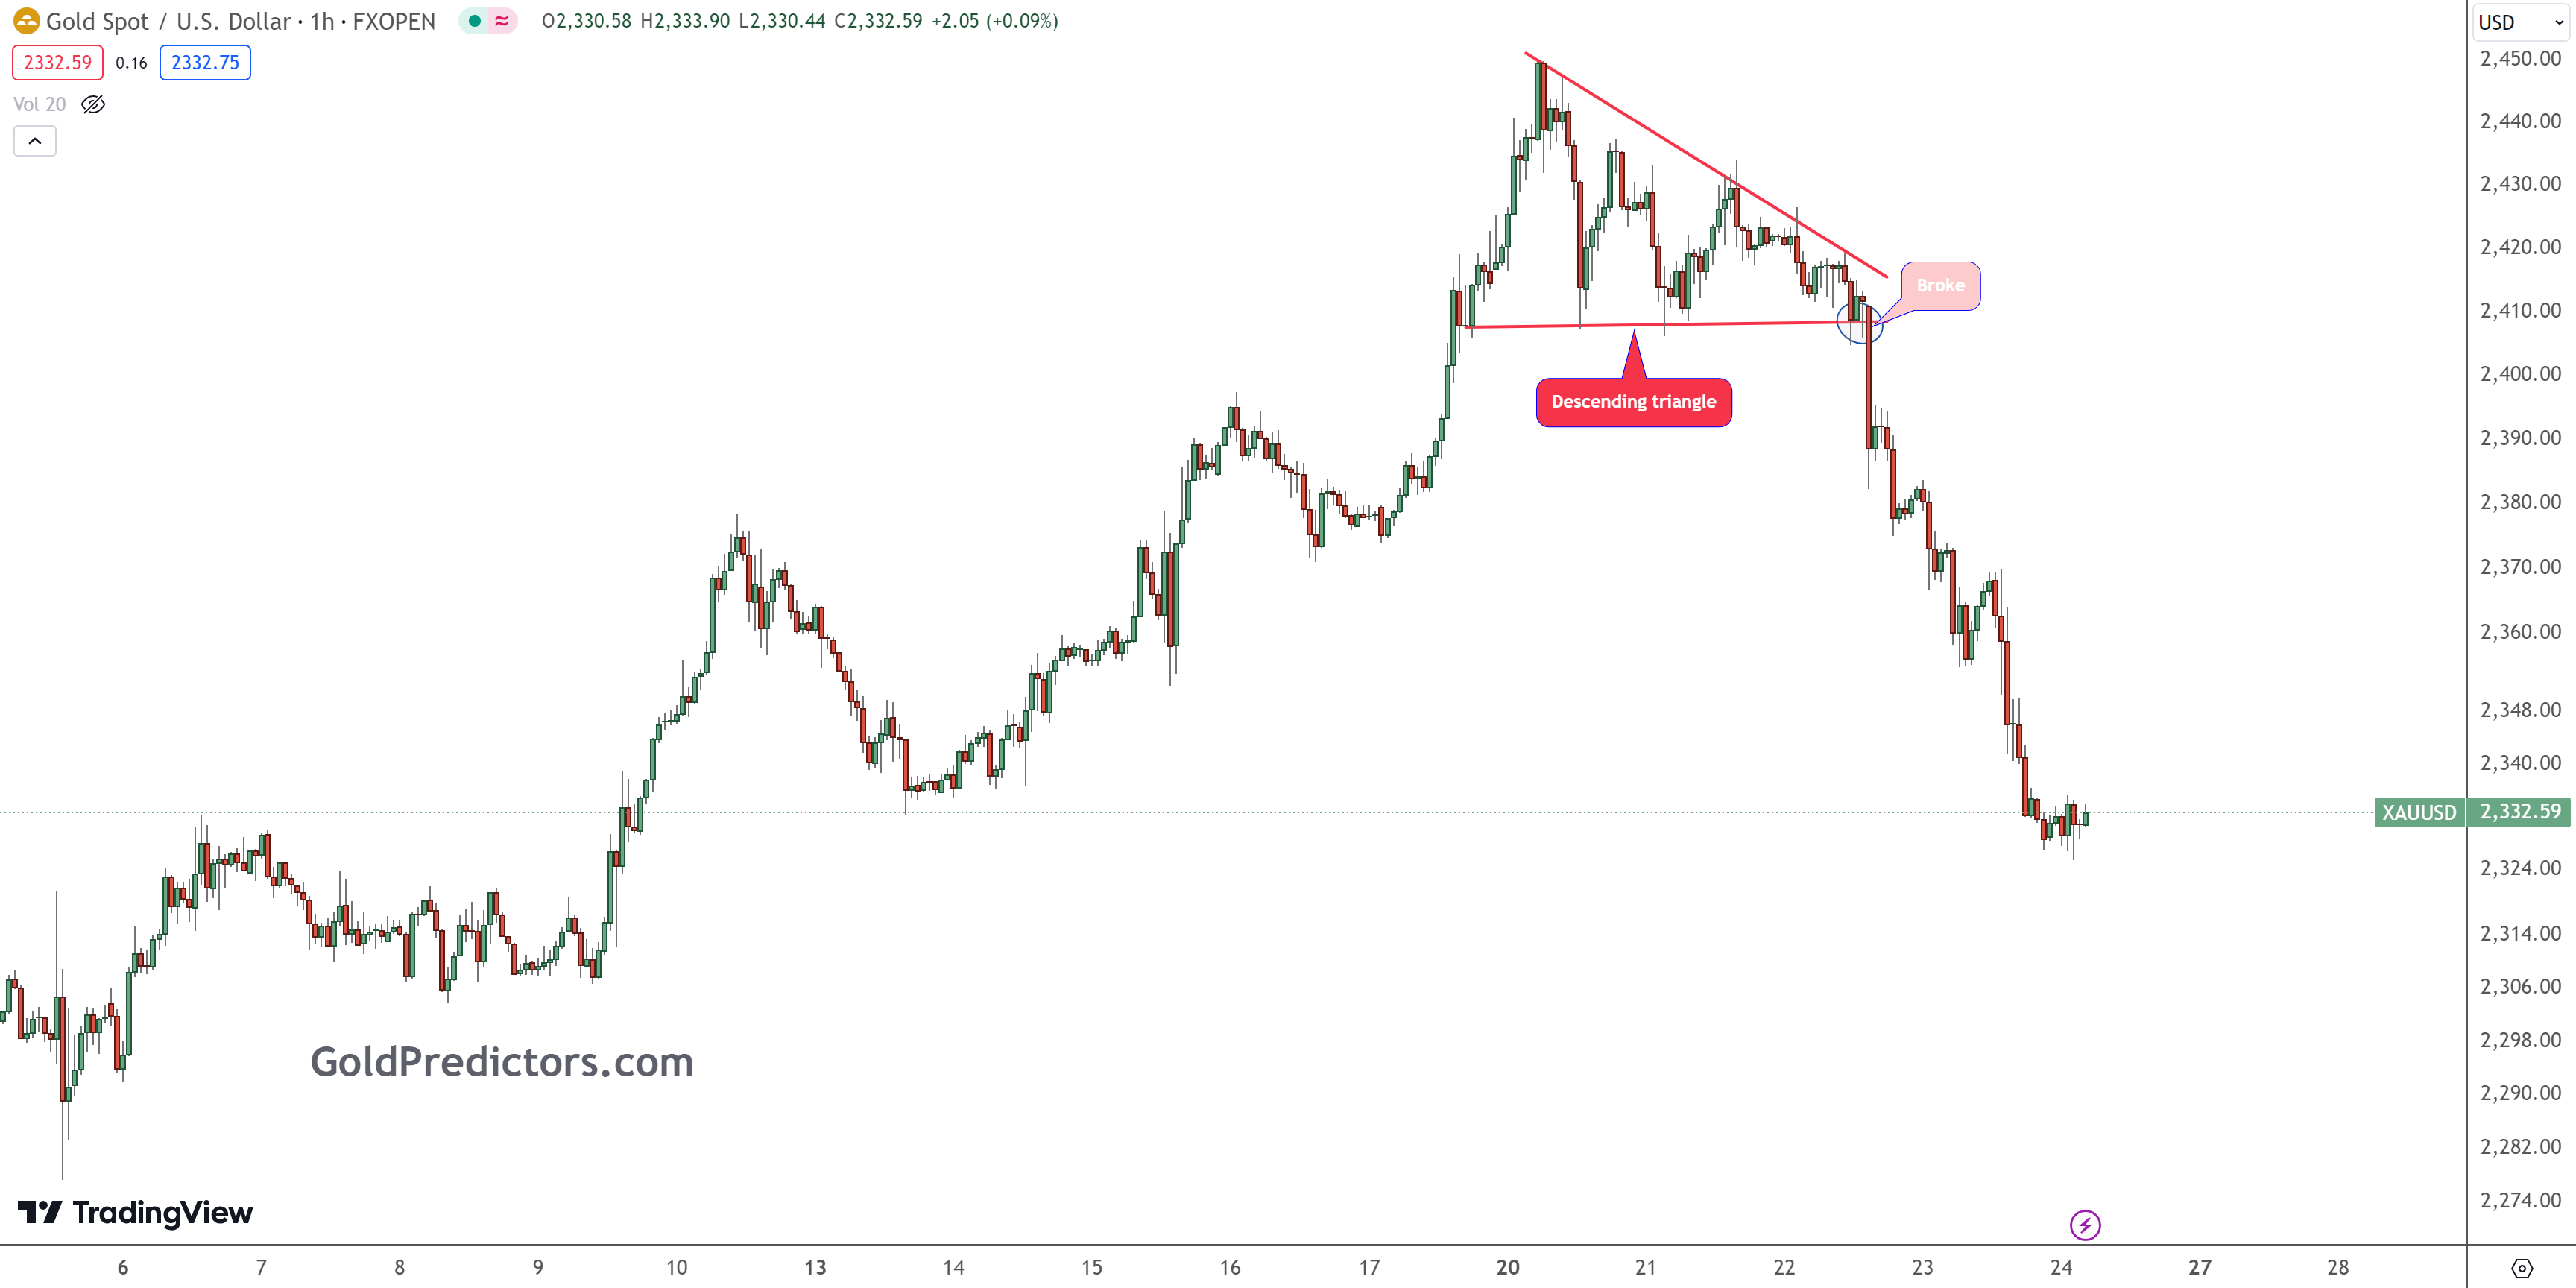
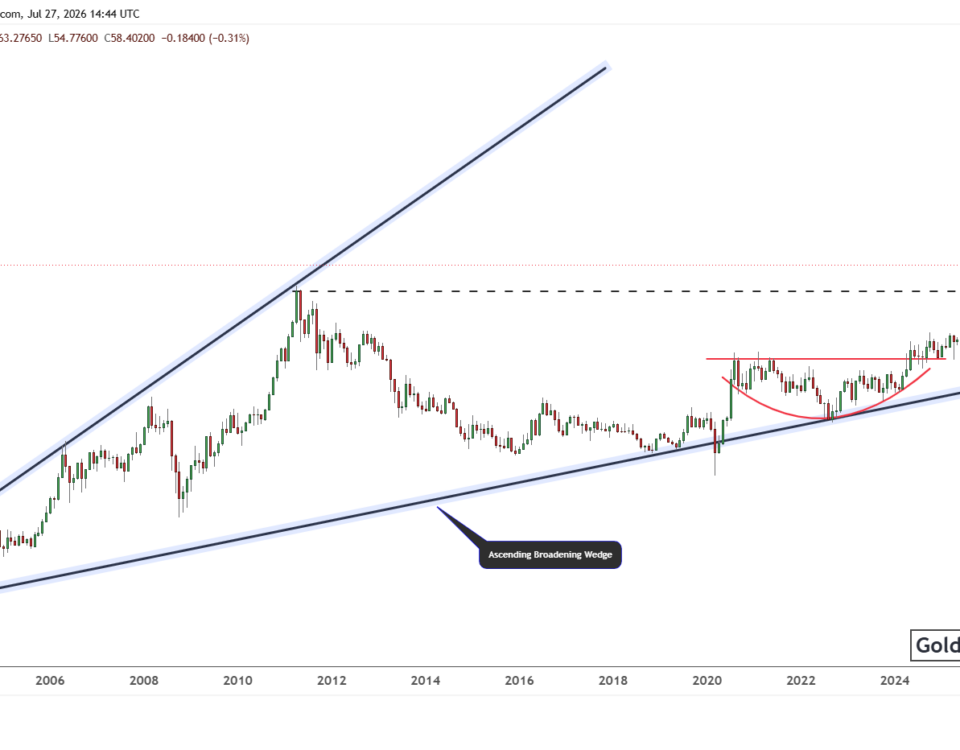
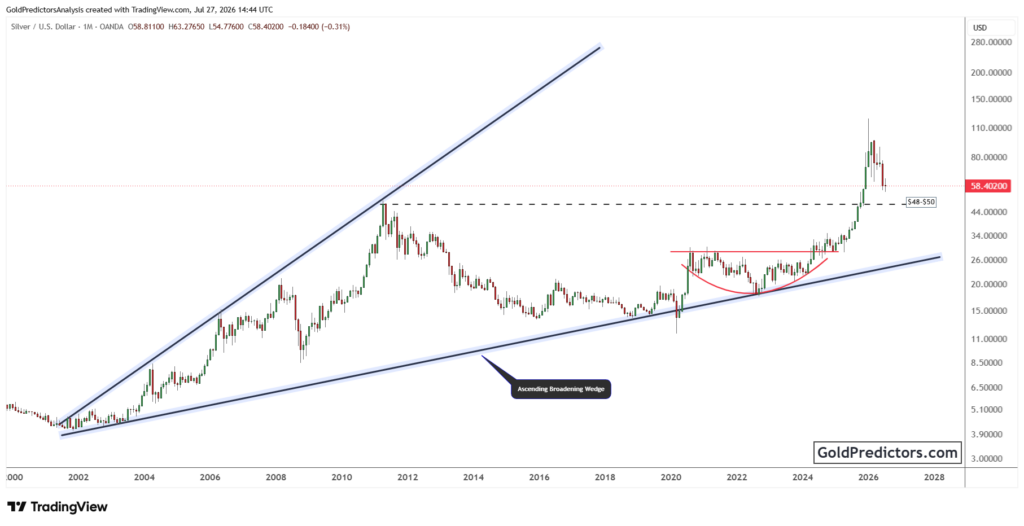
The gold market has been forming a descending triangle. The prices are compressing towards the wedge of this triangle, indicating a strong price compression. Eventually, the break of this triangle initiated a significant price drop, ignoring the weekly support at $2,385-$2,375 and closing the daily candle below $2,380. The daily close below $2,380 opened the way for lower prices, targeting the support region of $2,320-$2,300, where a strong rebound is expected.
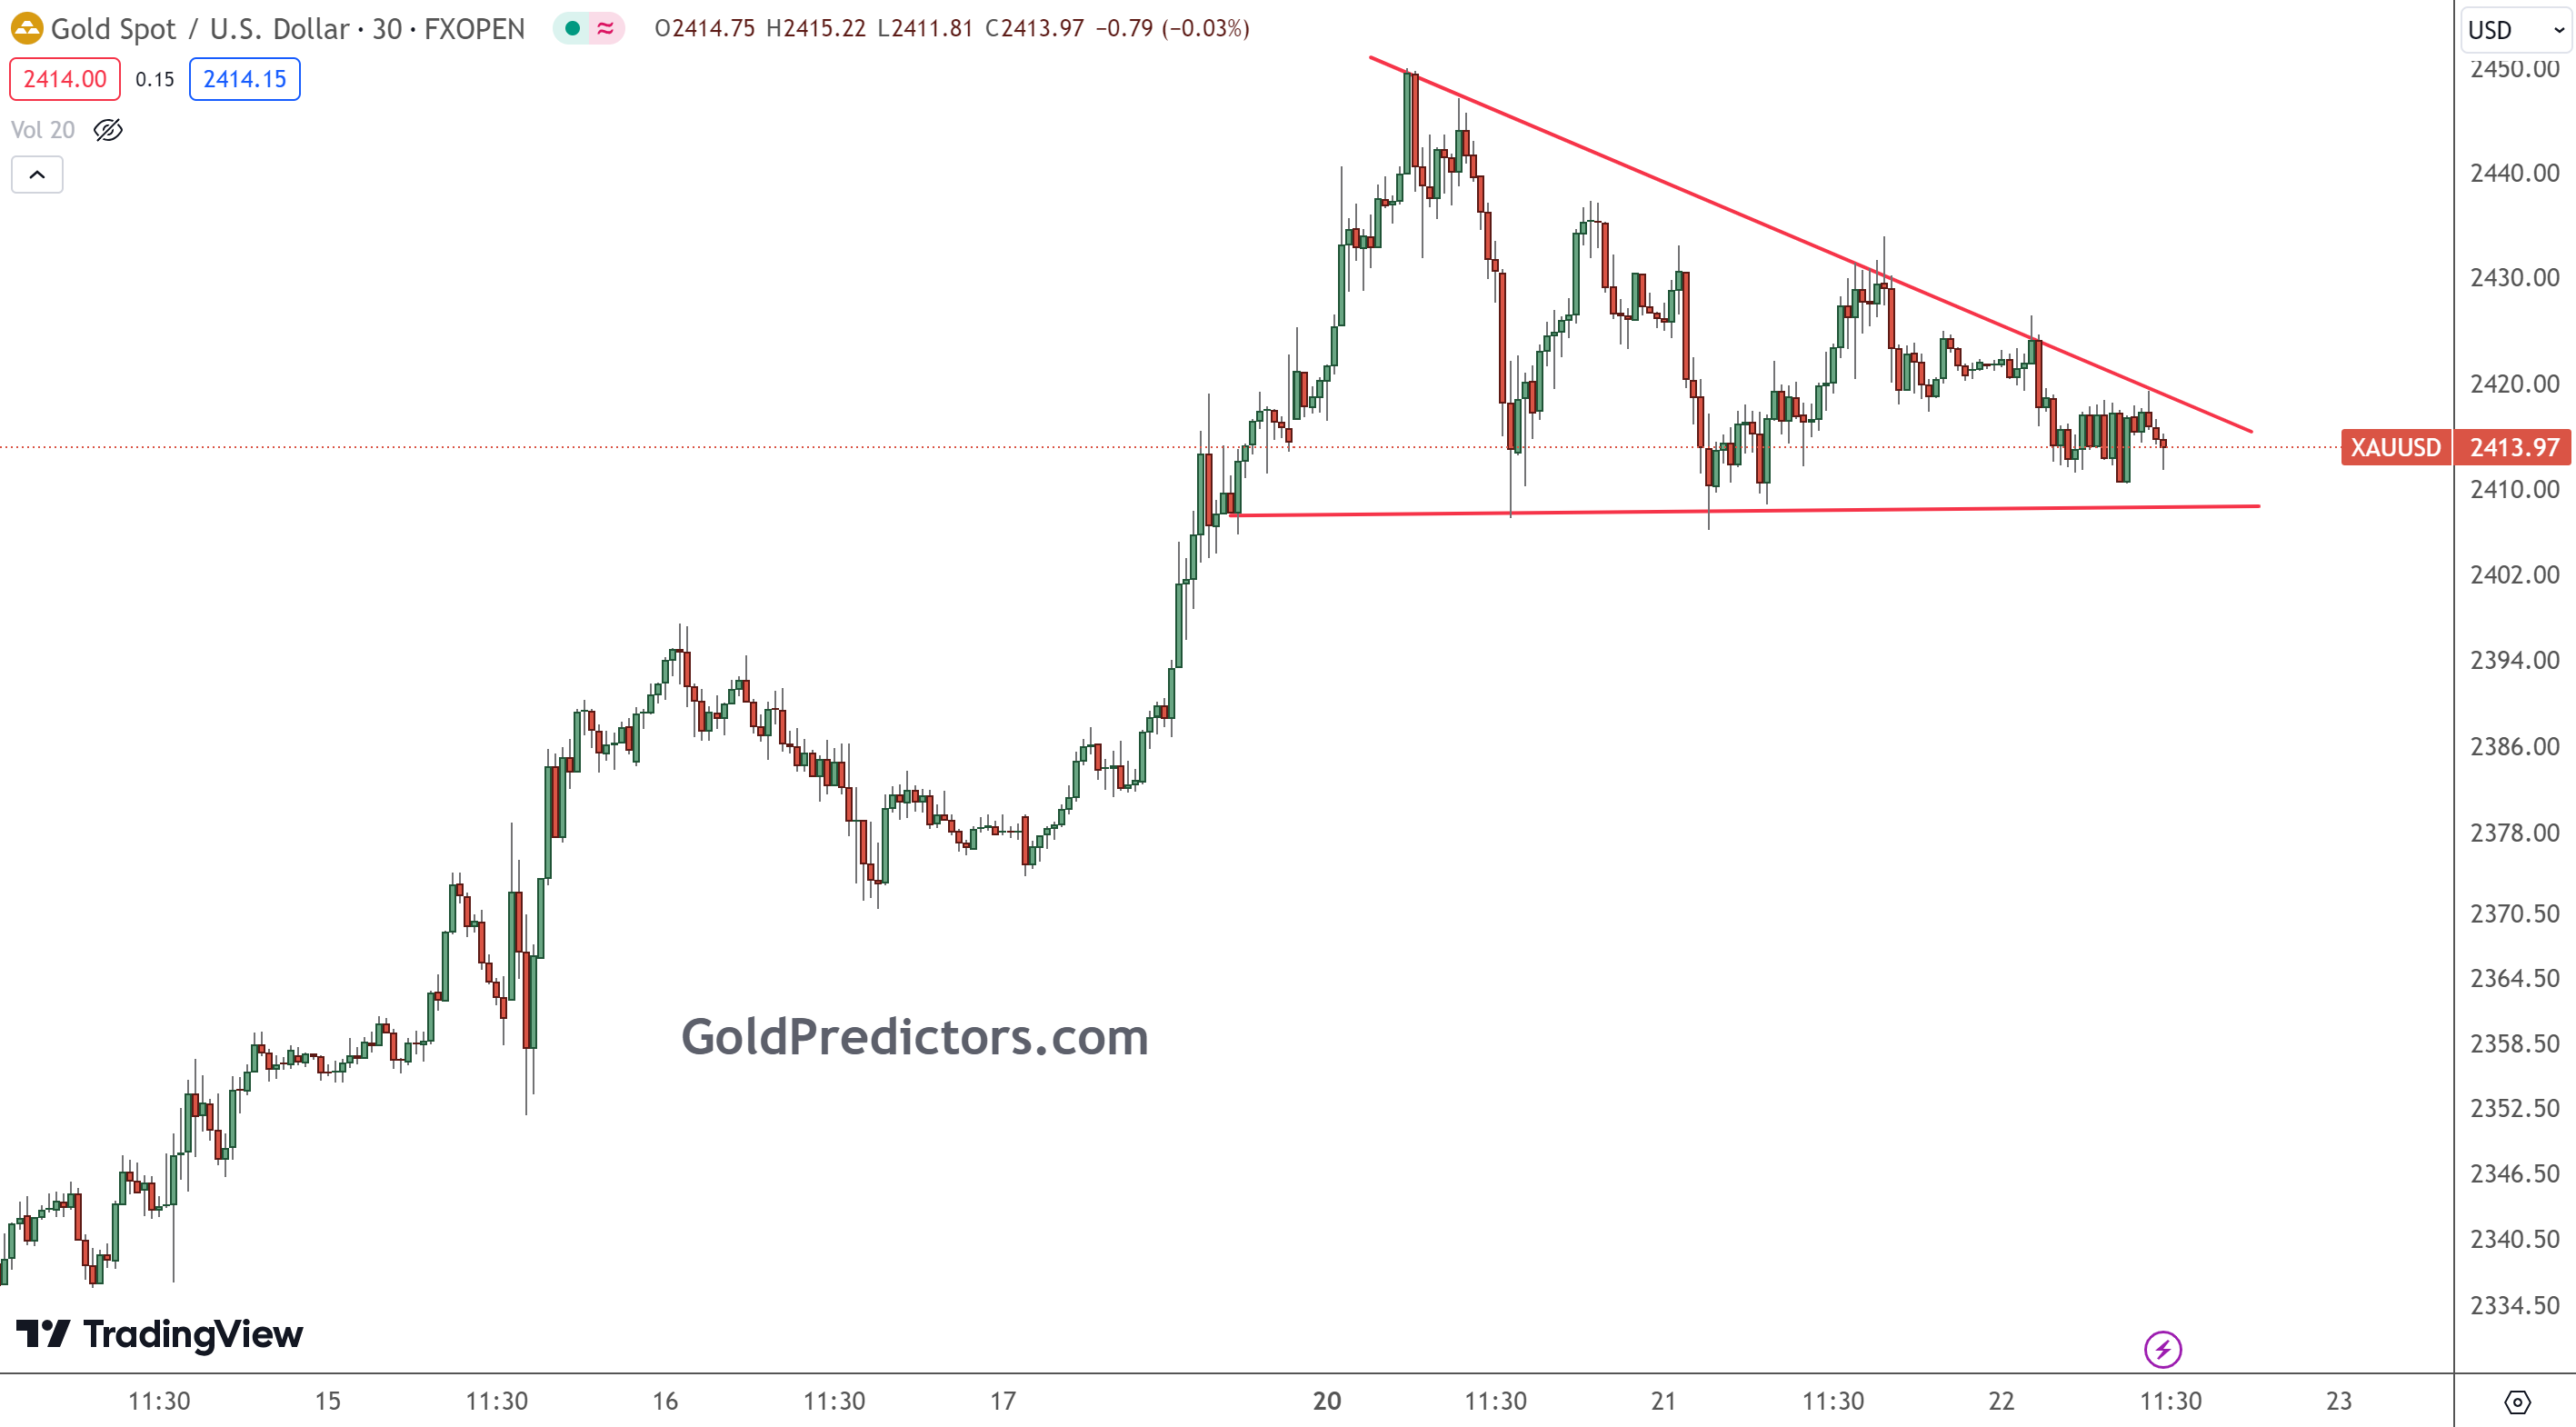
The chart below, discussed on Twitter/X, illustrates the breakdown in gold prices. It shows that this decline has not yet experienced any significant rebound, with prices closing lower at the end of the day. This pattern suggests price pressure and targets $2,300-$2,320 region by Friday as the first support. The support regions around $2320 or below offer gold buying opportunity.
How to Trade Gold During Current Market Conditions
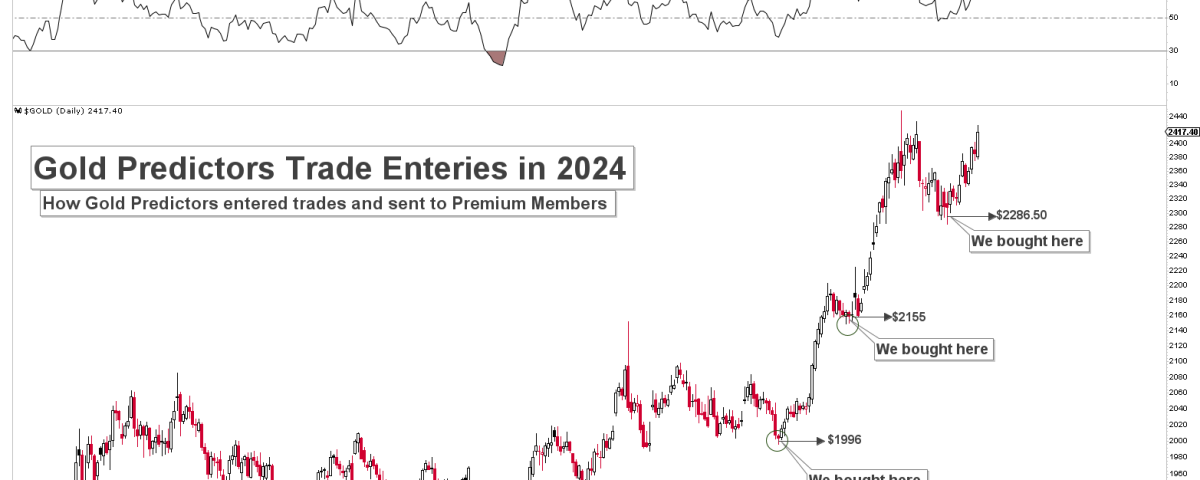
The gold market has been highly volatile in 2024 due to geopolitical crises in the Middle East and their impact on the global economy. Additionally, the ongoing Ukraine-Russia war has added to market uncertainty. While these events have positively impacted the gold market, the increased volatility has also raised market risk. To trade gold and silver during such crises, entering the market after gold has completed a correction and found support is suggested. For instance, Gold Predictors exemplify this strategy by entering trades and notifying premium members via WhatsApp and Emails. The chart below presents the gold swing trade entries for the past few months.
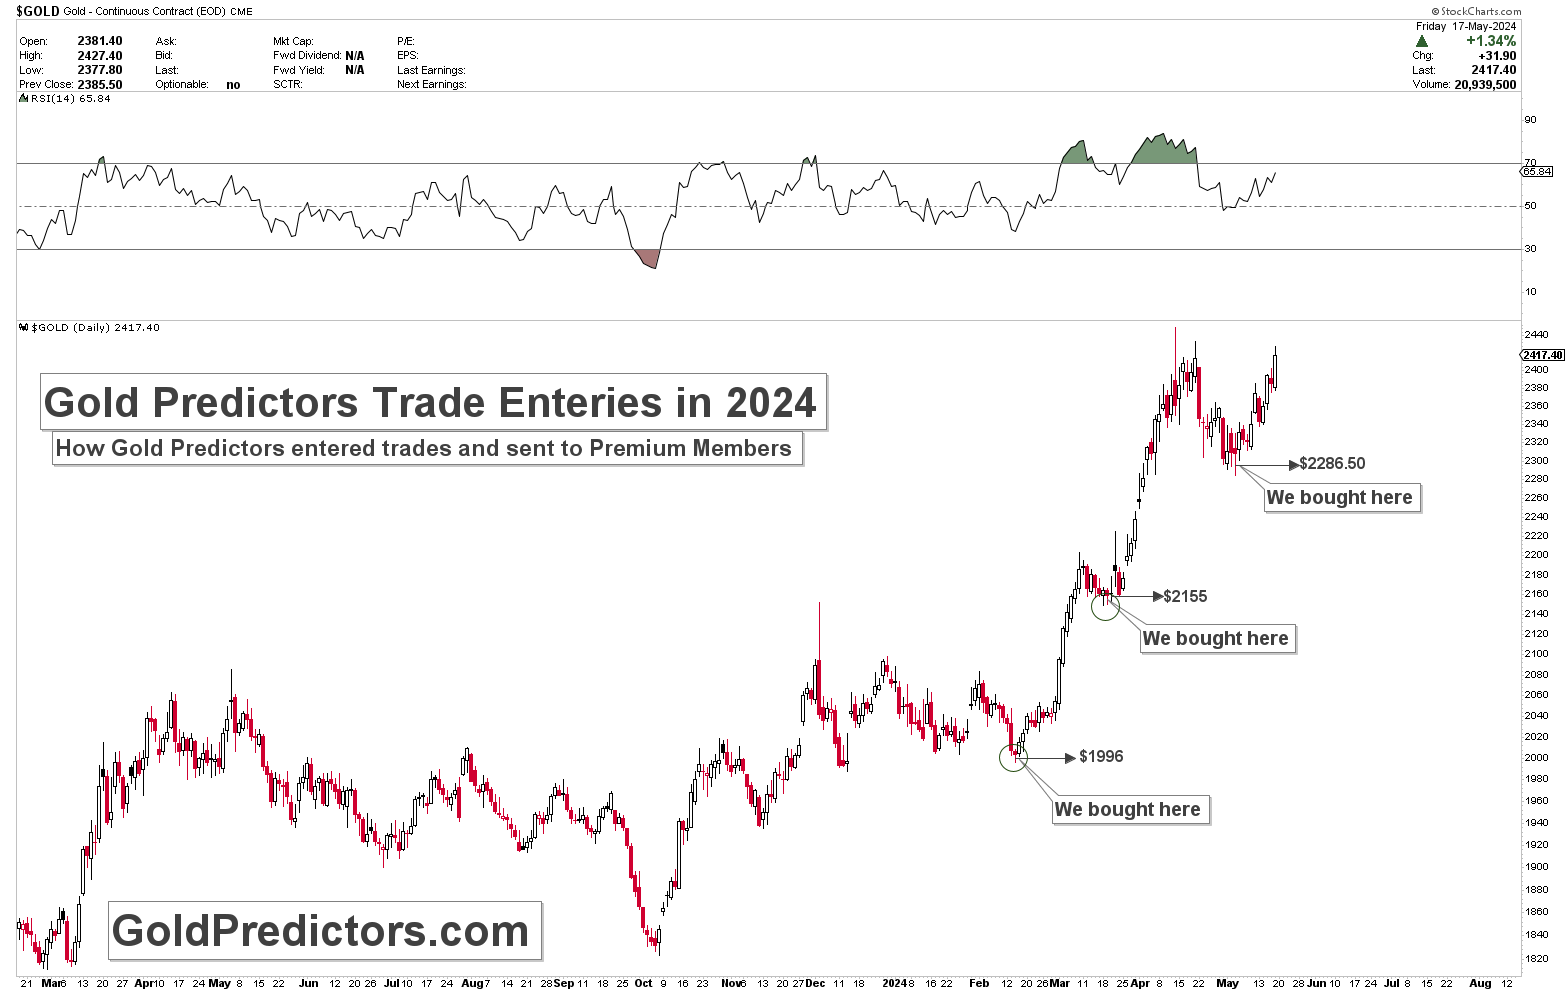
One notable entry was at $1,996 when the market analysts expected further decline. However, our analysis indicated a strong upward move due to complex cycles at the time, and the buy signal targeted $3,000. The price indeed surged the next day. Another entry was at $2,155 when market analysts were expecting consolidations. Despite market expectations, we confidently sent signals to premium members. This trade entry also leads to a new record high. The third entry was at $2286.50. We expected gold to produce a low at $2,285, which was confirmed at $2,277 in spot gold. This entry also proved successful. In the current market conditions, it is crucial to avoid attempting to pick bottoms and tops and instead enter when the market presents a clear opportunity.
Conclusion
In conclusion, the recent downtrend in gold prices has been driven by the hawkish tone set during the U.S. Federal Reserve’s policy meeting and stronger-than-expected business PMI data from the United States. The significant increase in the U.S. Composite PMI and the Fed’s indications of a possible policy tightening to address inflation have tempered expectations for aggressive rate cuts, adding downward pressure on gold prices. A stronger U.S. Dollar and emerging supply-side concerns have further impacted the market.
As gold prices navigate through these economic challenges, market participants should remain cautious, avoiding attempts to predict bottoms and tops, and instead look for clear opportunities to enter the market when conditions stabilize. The recent breakdown in the gold market from the descending triangle will likely produce a bottom in May/June as the seasonal correction completes and the next strong bullish momentum is coming. Therefore, investors may consider this correction in gold as a buying opportunity.
To receive detailed analysis and short-term and medium-term trading signals for gold and silver, and premium updates, please subscribe using the link below.