


Gold Emerges a Strong Buying Opportunity
Last week, precious metals markets remained in high demand due to market sentiments regarding additional rate hikes by the Federal Reserve in the coming months to combat high inflation. The inflation rate remains elevated, and January PCE data indicates. The PCE increased by 5.38% in January compared to the same month last year, and it continues to advance at a monthly rate of 0.5%. Inflation is a concern of higher gold prices, but central bank buying of the metal is also a source of high gold prices. The high inflation in the economy suggests that any pullback in the gold market must be treated as a strong buying opportunity.
Due to geopolitical tensions and fiat currency risk, central banks see the need for hard currency in reserves. According to the World Gold Council, central banks purchased 31 tonnes of gold in January, representing a 16% monthly increase. China is the leading purchaser of gold reserves. In 2022, central banks increased their gold reserves by 150% compared to 2021. According to the World Gold Council, the monetary gold demand will continue in 2023.
Gold Market Analysis
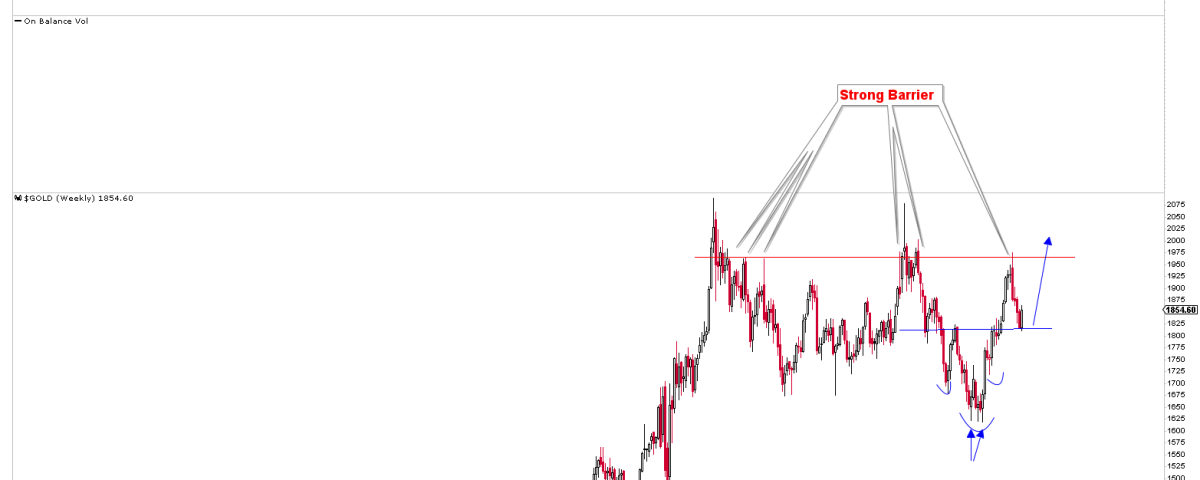
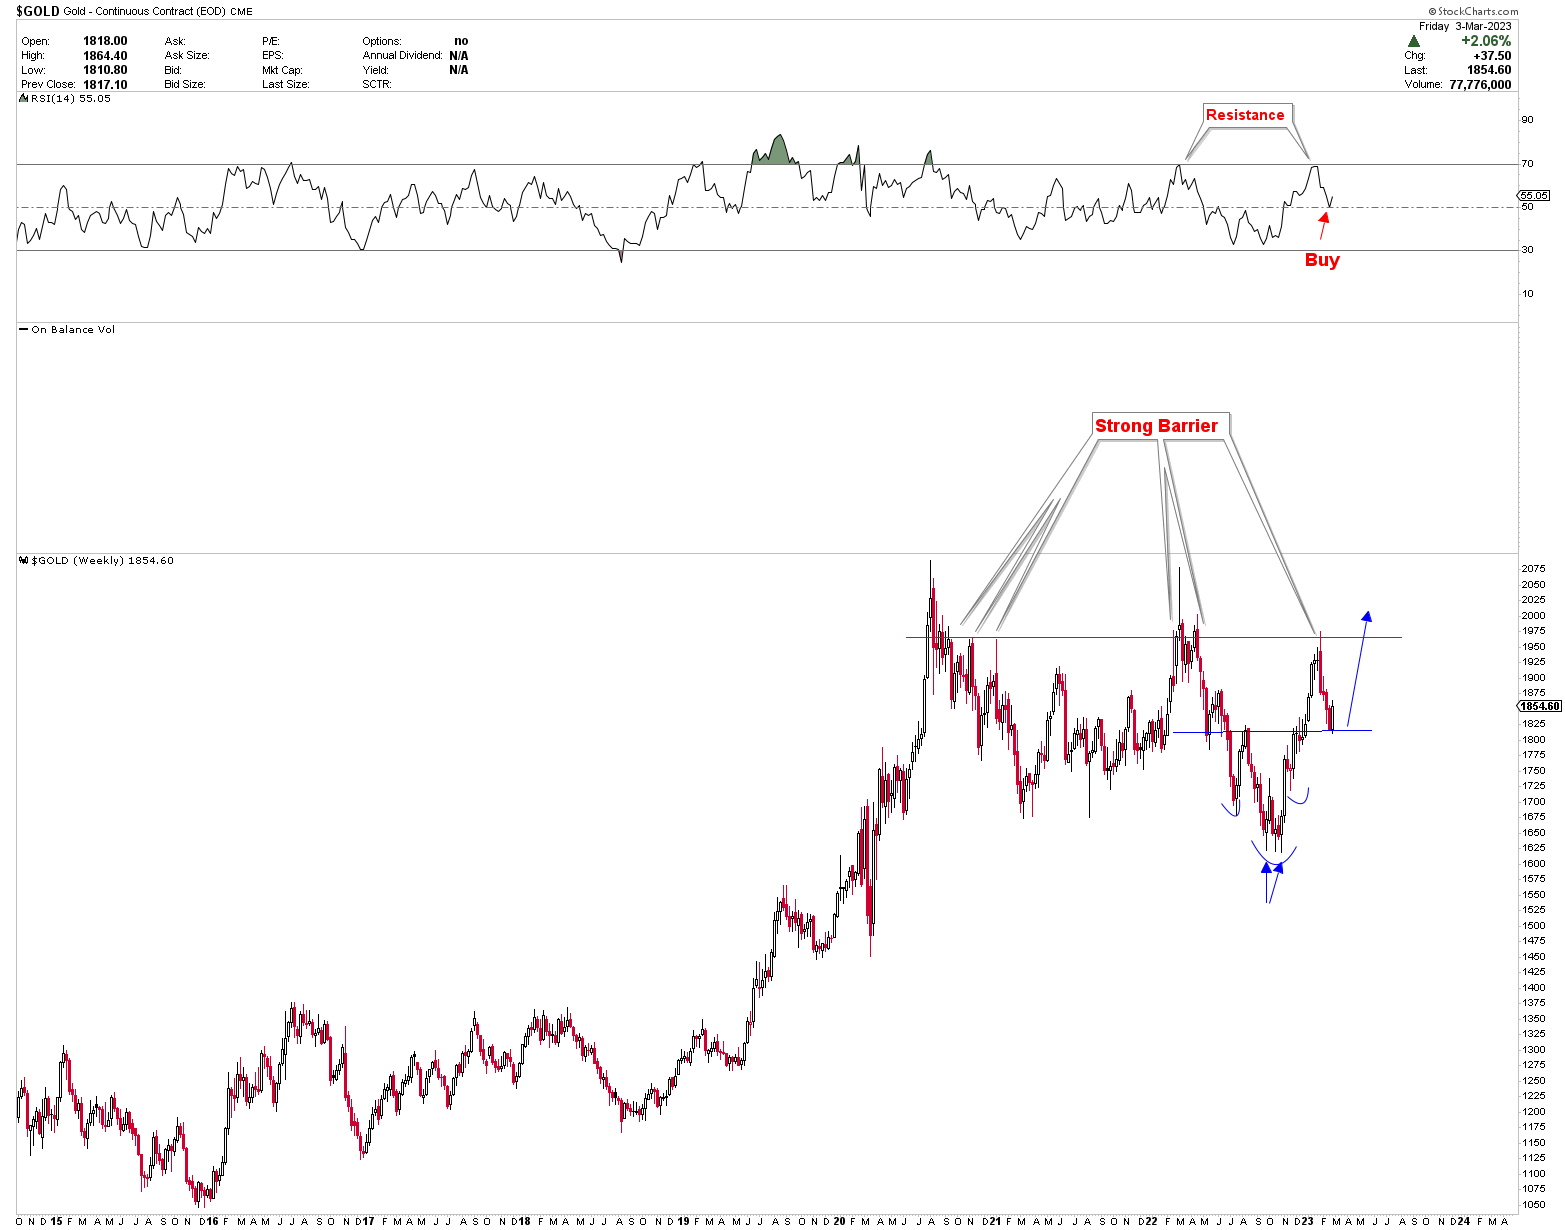
The gold market has established a solid bottom near $1600 and continues to rise. According to our previous update, we anticipated $1,975 to be a formidable barrier and a pullback towards $1,800 to $1,820. The decline has already occurred and the price reached the region of strong support. The chart below depicts the formidable barrier in the gold market where the pullback originated. The blue line represents the neckline of an inverted head and shoulder that was broken to increase prices.
Currently, the gold price is testing the blue neckline and bouncing off the support zone. The market produced a weekly reversal candle last week. The weekly reversal indicates that this level is significant and that the gold price will rise from here. The RSI is also supportive at the midpoint and indicates price increases in this region. The combination of RSI, bullish reversal and support at neckline indicates a strong strong buying opportunity.
Gold Daily Outlook
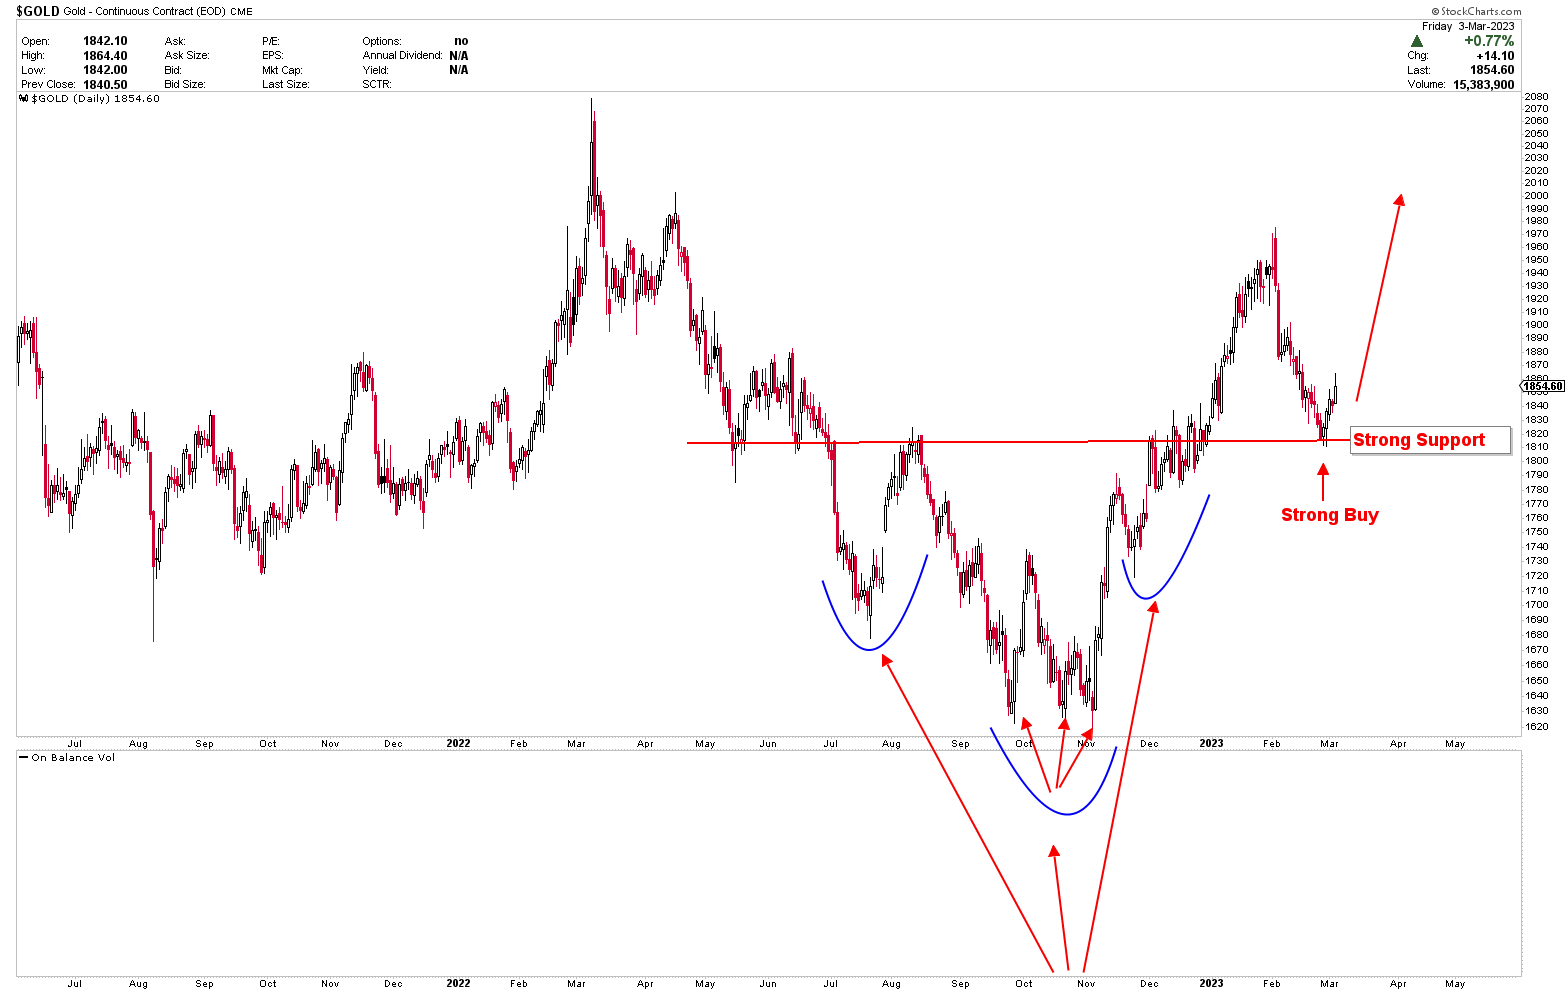
The chart below illustrates the daily gold price action and is bullish. We suggested a strong buying range for investors between $1800 and $1820. The low was $1804.68. The appearance of inverted head-and-shoulders patterns on the gold chart reveals its bullish structure. Because it indicates a potential reversal of a downtrend, the inverted head and shoulders pattern is considered a bullish pattern.
The pattern is comprised of three troughs. The middle trough is lower than the other two to form the head and shoulders shape. The neckline is formed by connecting the peaks between the two troughs on either side of the head. When the price breaks above the neckline, it indicates that the bears have lost control. And the bulls are gaining the upper hand. This scenario signals a possible uptrend. One can estimate the potential upside target based on the distance between the head and neckline. The pattern has been broken, and the price is currently retesting the pattern’s neckline. This test is a strong buying opportunity for the gold market.

