


US Dollar Sell-Off Continuation
The US dollar fell to multi-month lows against major currencies as a result of continued optimism and US data that weighed on the FED’s monetary policy. First, the news from the Bank of Japan that the central bank is ready to withdraw stimulus if inflation numbers are too high hurt the US dollar. Similarly, news from China about the new chain of Covid-19 pushed Asian and European equities higher, reducing demand for the US dollar. In contrast, the Personal Consumption Expenditures (PCE) index increased by 6% in October, while the Core PCE increased by 5%. Similarly, the ISM manufacturing PMI fell by 2.39%, the first drop since May 2020.
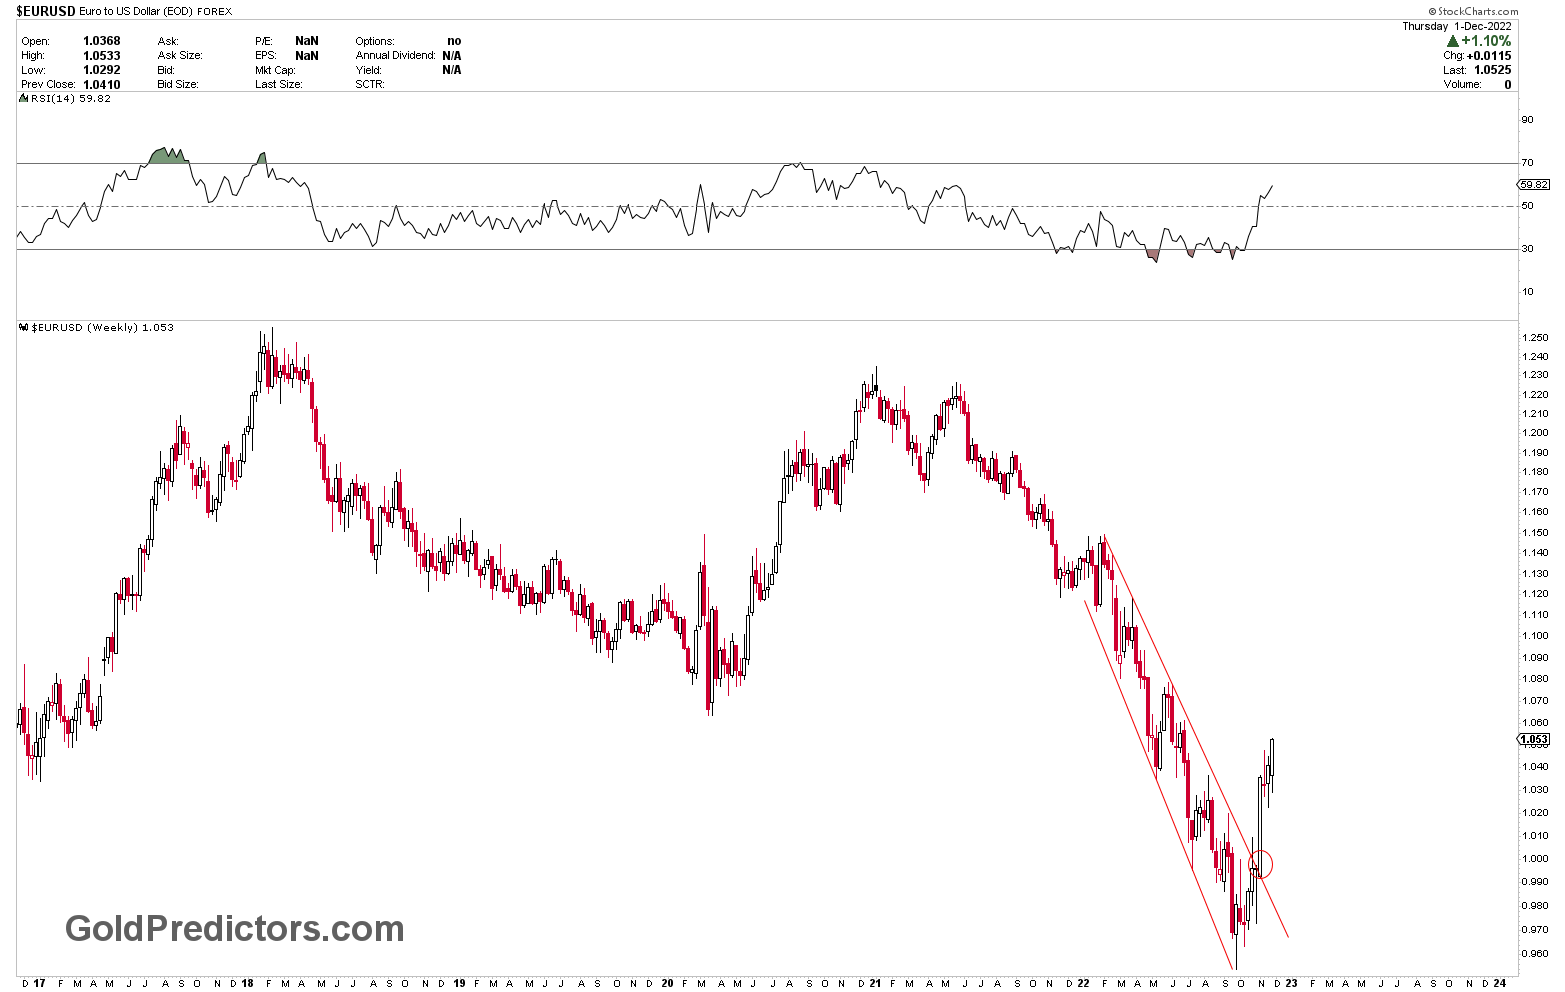
Since the US Dollar index is proportional to the Euro, the EURUSD gained the 1.05 level and is now trading above it. Similarly, correlated pairs such as GBPUSD, AUDUSD, USDCHF, and USDCAD have reacted as expected from the US dollar market. The gold price has risen to our target of 1780-1800, which we announced to members a few weeks ago.
Technical Outlook for US Dollar
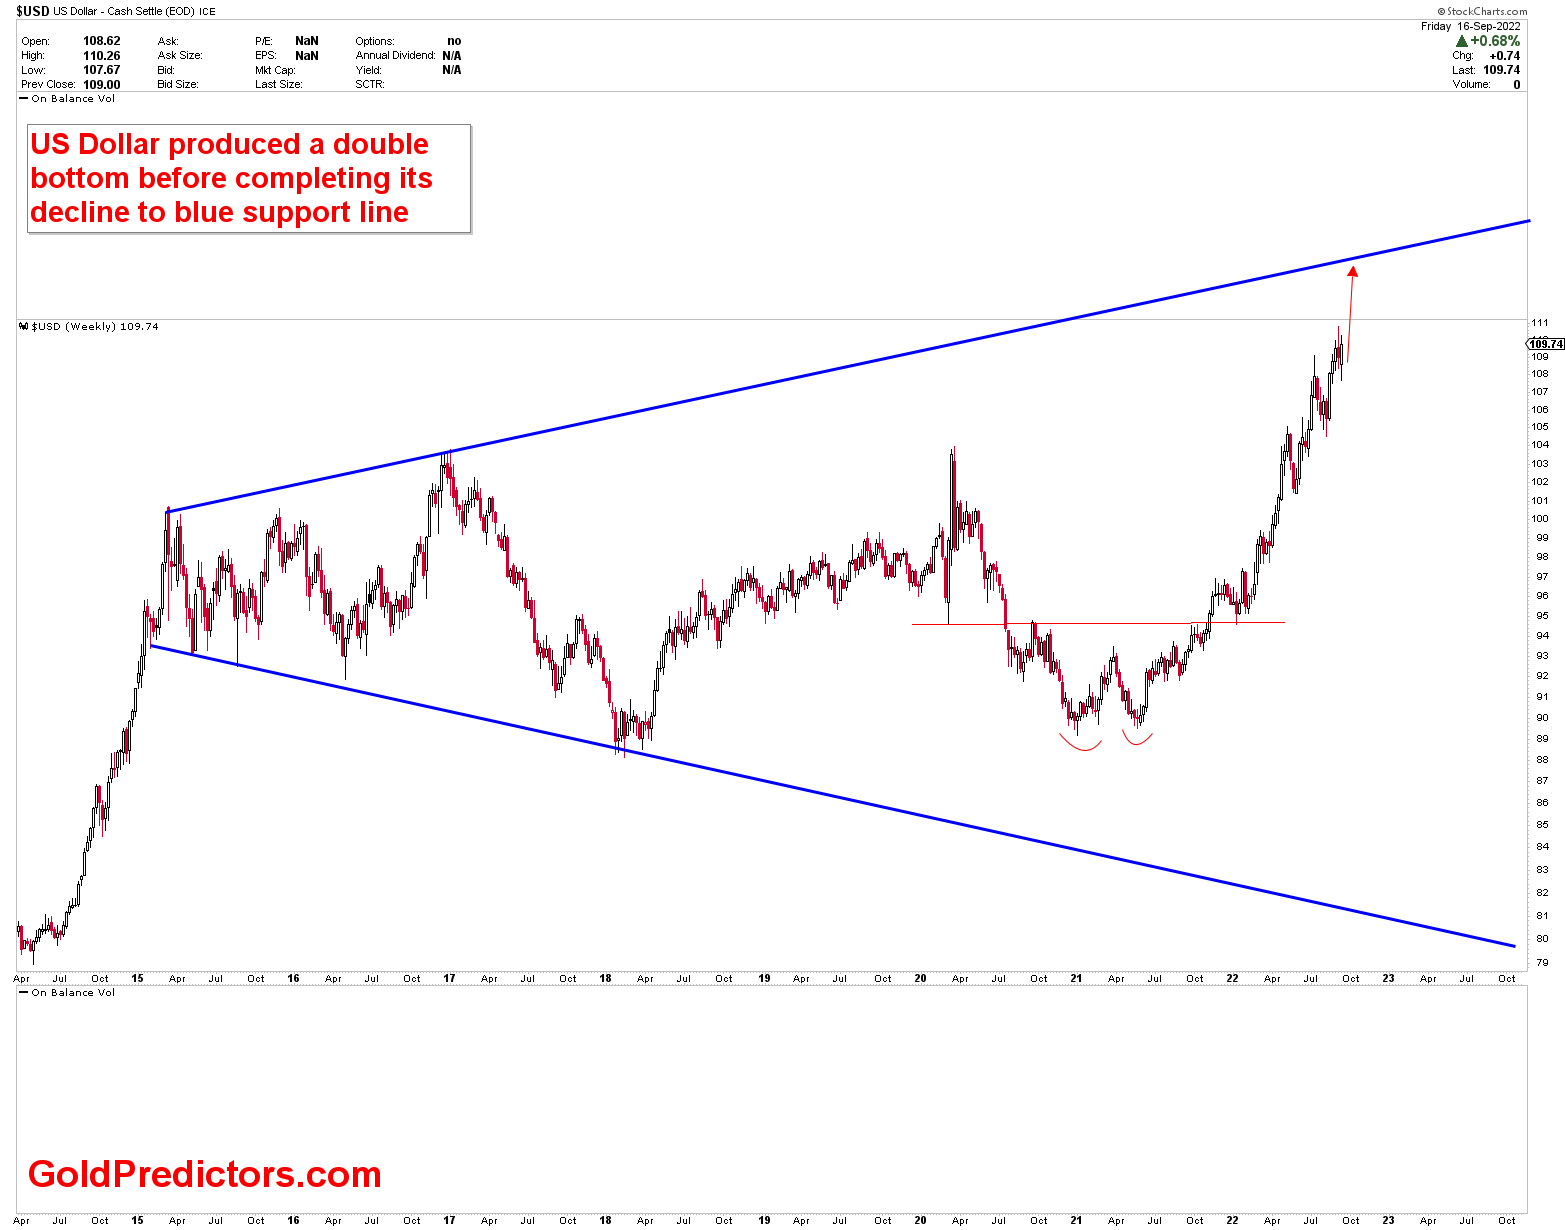
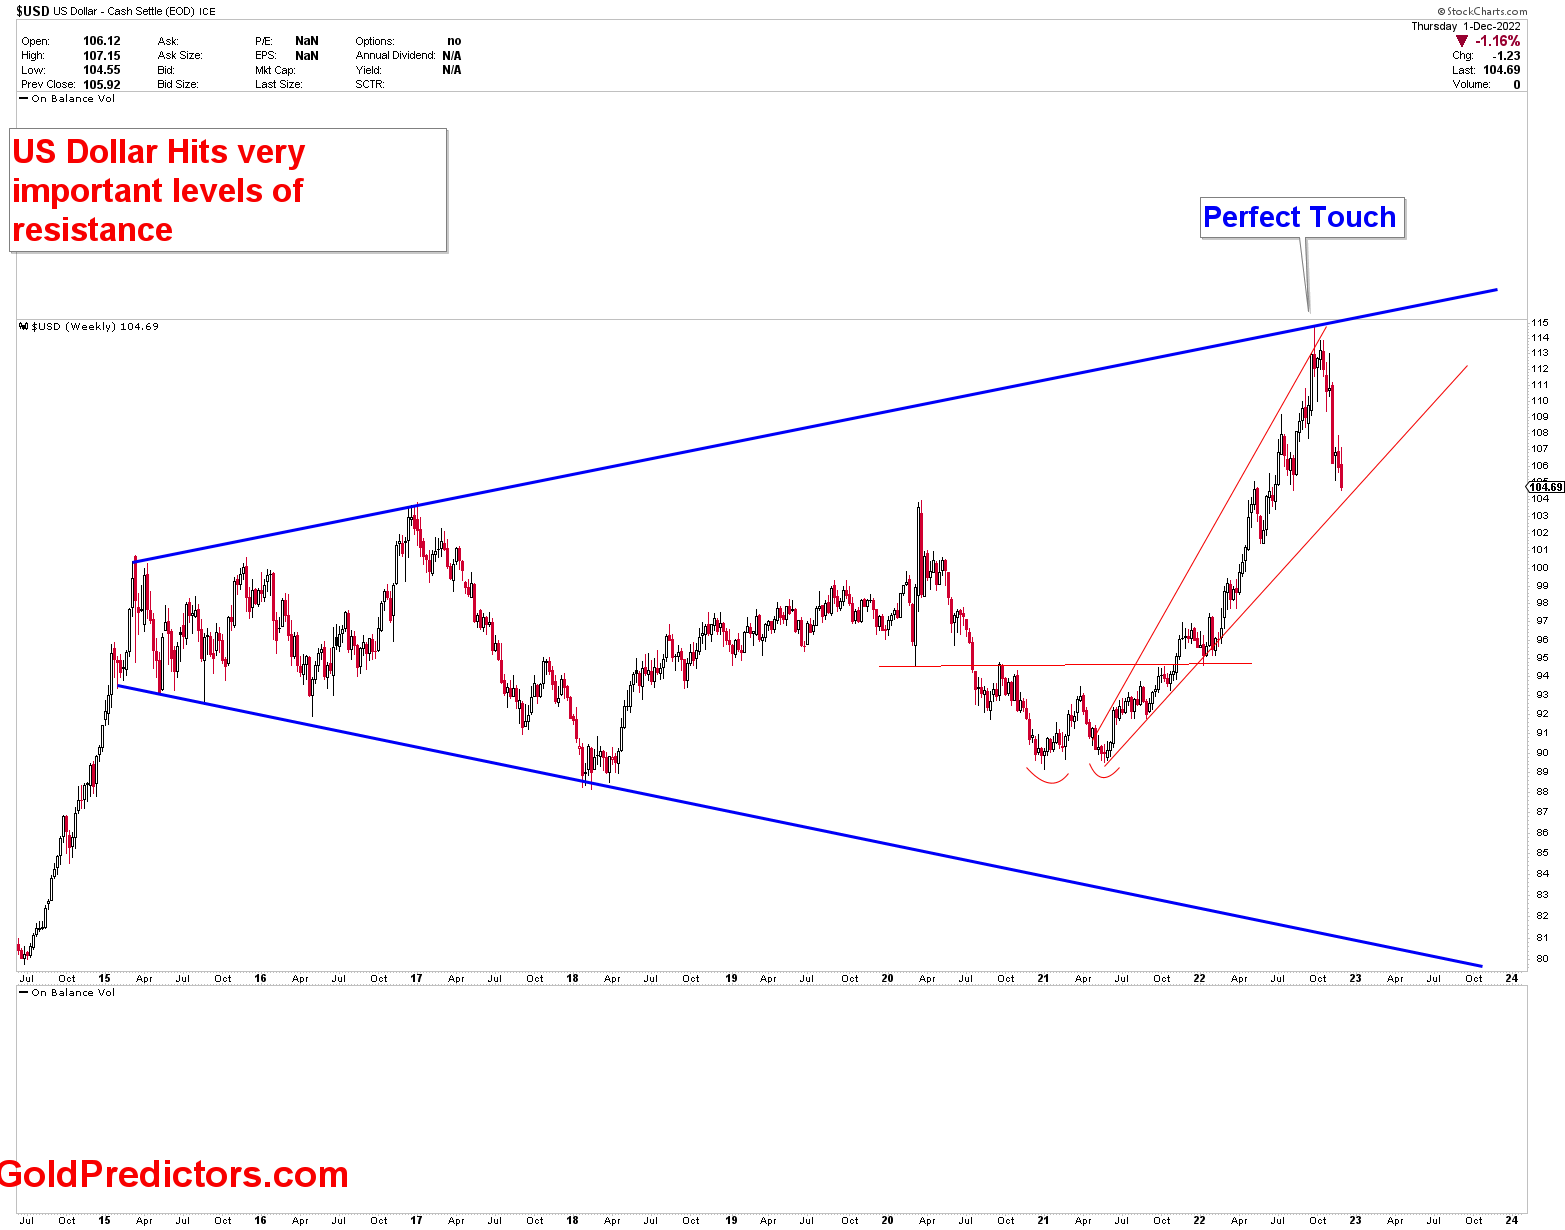
For quite some time, the US dollar has been bullish, and we have identified some critical key levels in the US dollar market. The chart, which was presented to members on September 16, 2022, clearly indicated that a quick rally in the US Dollar was expected to hit the symmetrical broadening wedge at the blue resistance line. Members were clearly informed that a quick rally to the symmetrical wedge would almost certainly result in a quick decline from the blue resistance line. The chart that was presented is shown below.
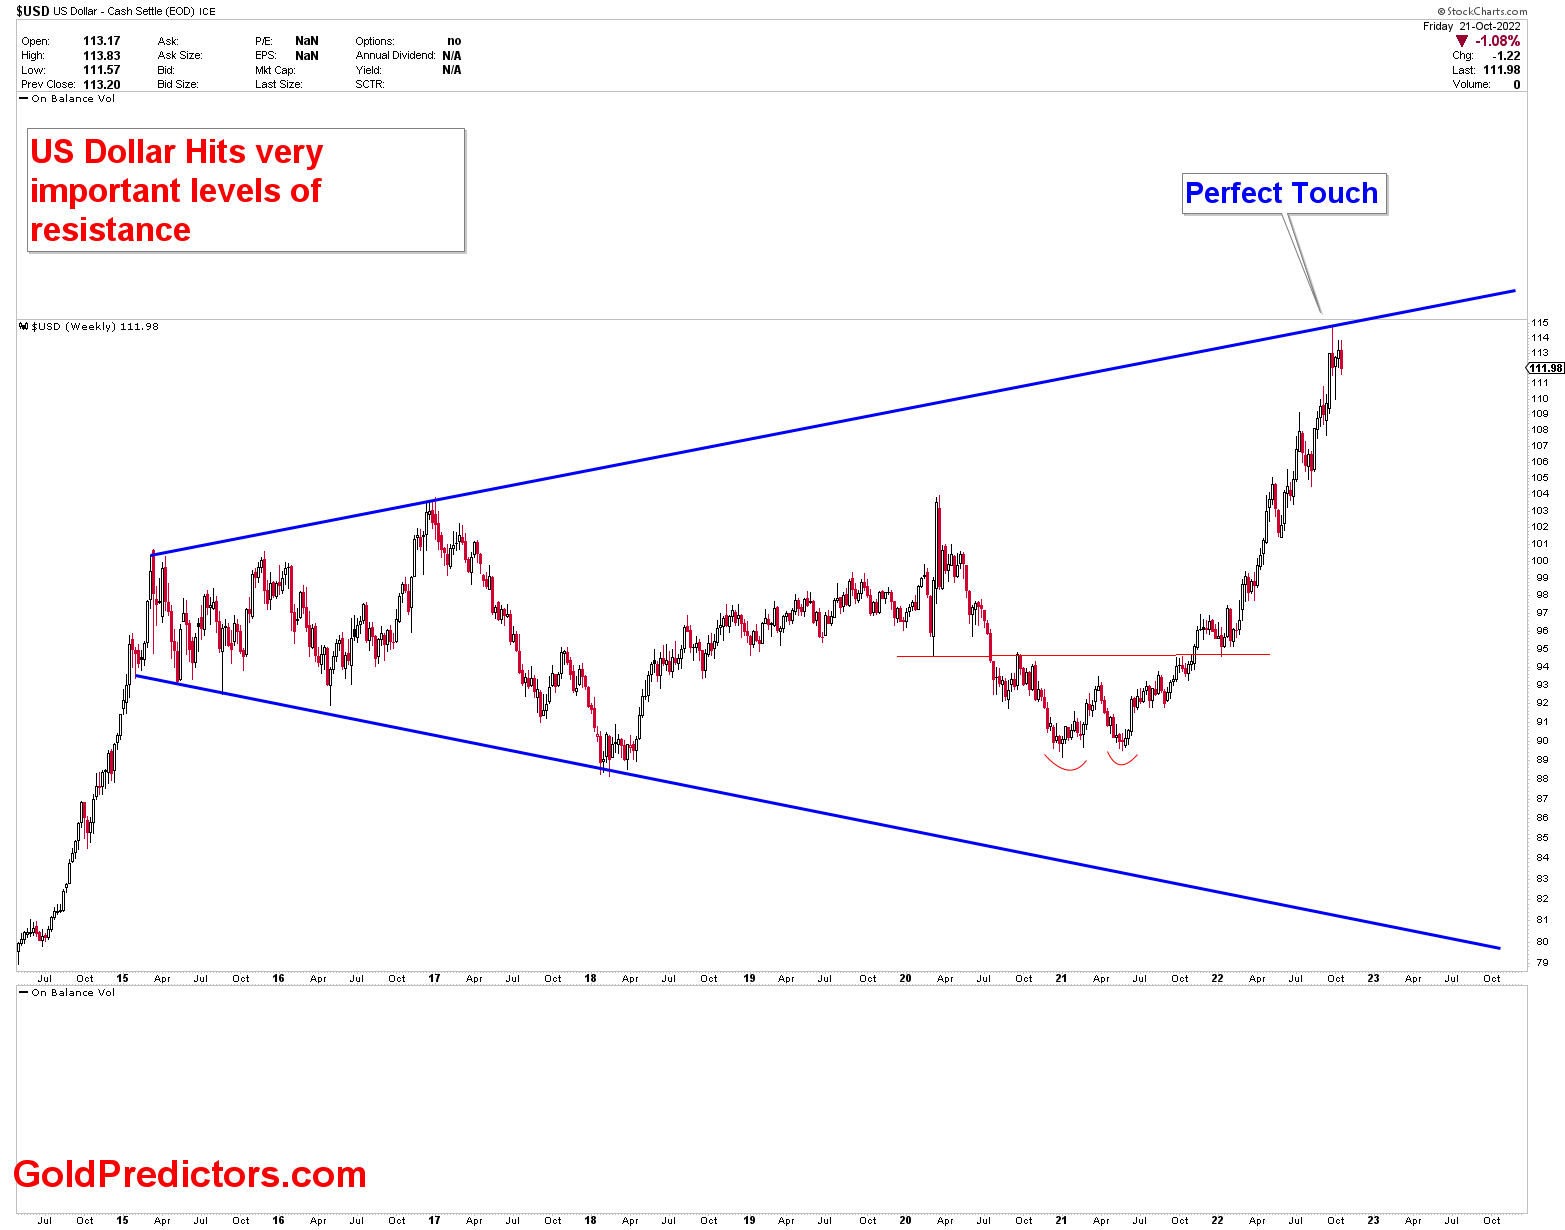
The following chart was presented on 21 October 2022, when the rally met expectations and the US Dollar produced some consolidation at key levels, which was regarded as the consolidation before a major drop. The chart is again presented as below.
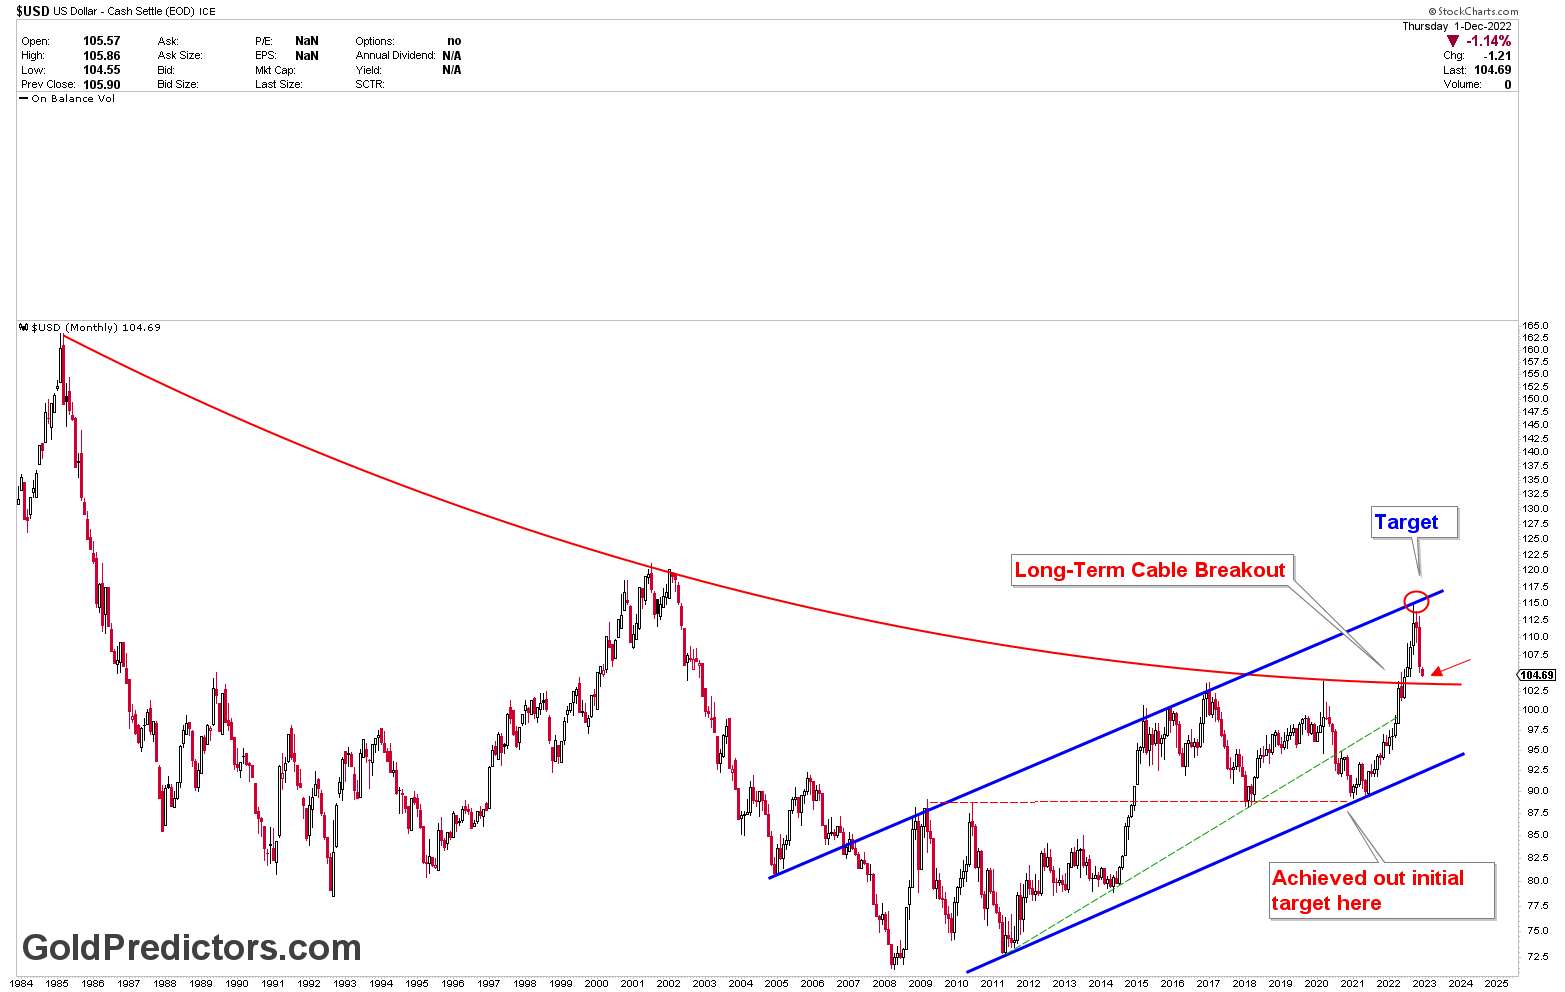
The monthly chart of the US Dollar validated the chart by presenting the same outlook due to strong resistance at the blue channel. The monthly chart was used to identify a target, which was confirmed by the weekly chart, as shown below.
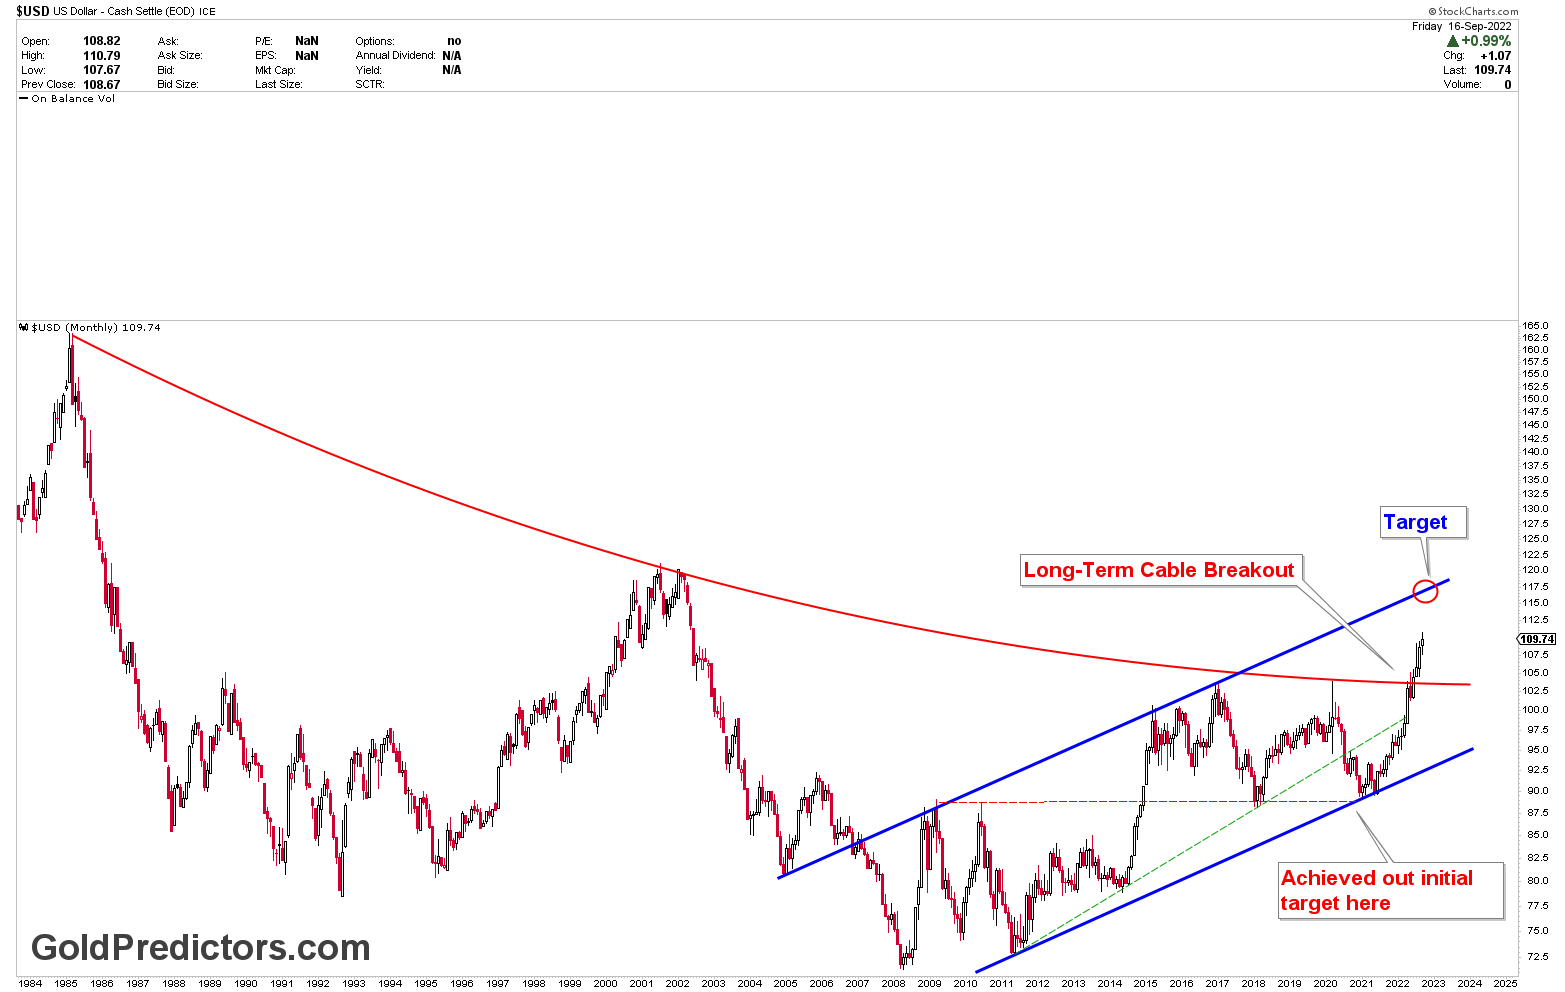
The US dollar has followed the same scenario depicted in the charts, and the price is now acting in accordance with these two strong resistance points. The channel resistance is on the monthly chart, and the symmetrical broadening wedge resistance is on the weekly chart. These two resistances have caused the US dollar to fall more rapidly.
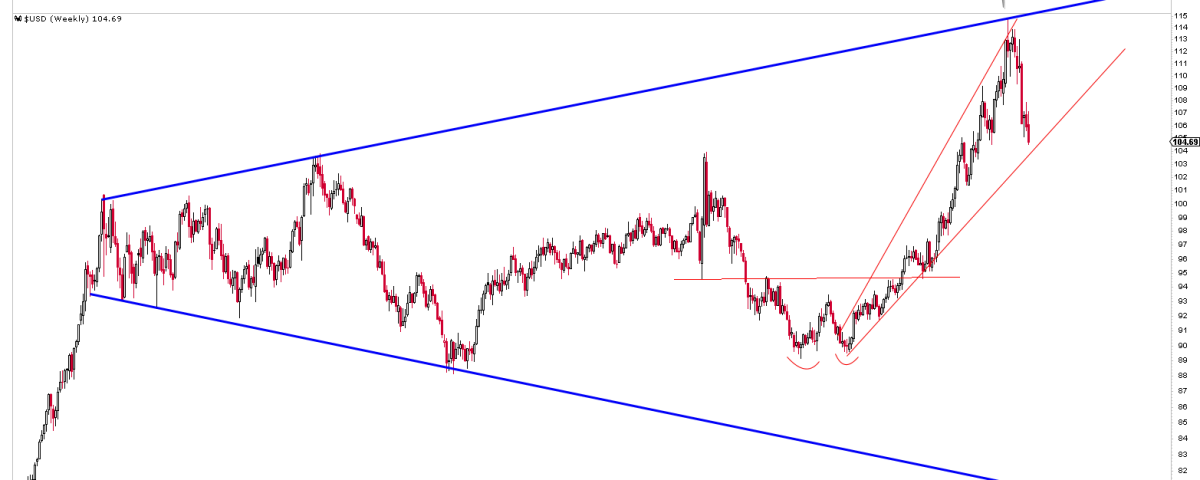
The updated monthly chart below shows that the price has retreated from the strong resistance and is now finding support at the red arc. There may be some bounce from this support region, but it may be brief. The weekly chart also confirms this area of short support.
Last week, the weekly chart was presented with the formation of ascending broadening patterns whereby the US dollar had some more room to fall towards the support. The support is currently approaching as the US Dollar falls towards the support region. The chart below shows that after a small drop in the US dollar, there may be a small bounce from this support region. The same is true for the gold market, which is also approaching the first resistance level where a consolidation could occur. The chart also suggests that ascending broadening is a bearish pattern, and any breakdown in the US dollar index will likely produce a dramatic decline in the US Dollar.
Interpretation of EURUSD Rally
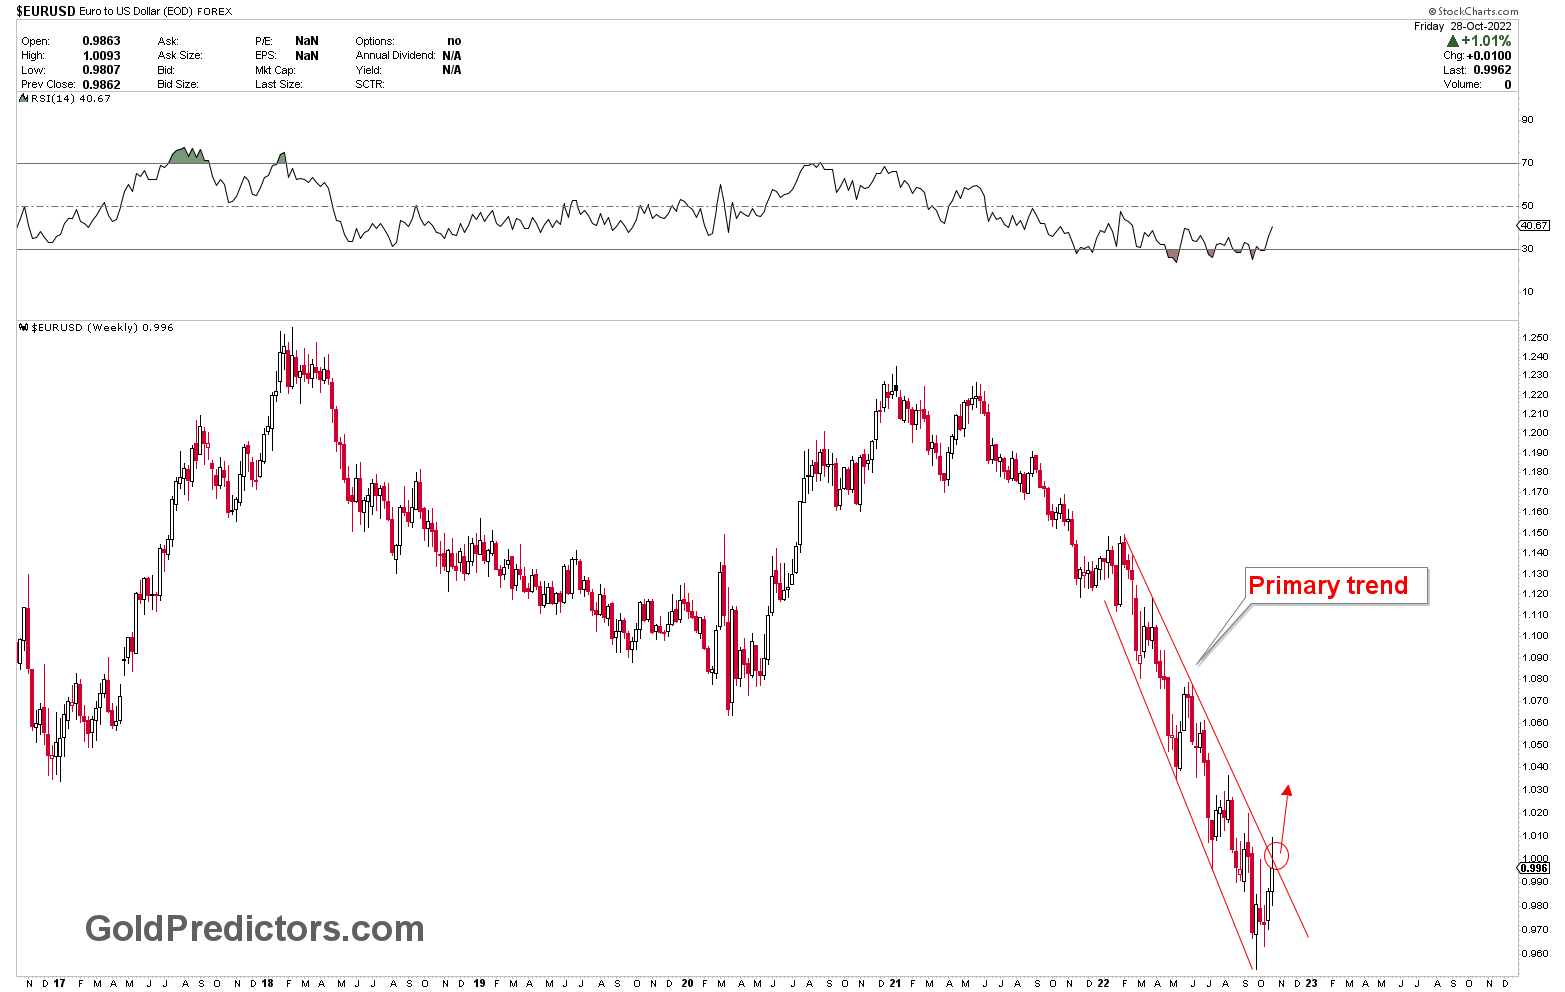
EURUSD is technically inversely proportional to the US Dollar. We forecasted EURUSD to be a bullish case because the US Dollar index was trading at significant resistance. The technical formation of a falling wedge, as shown in the chart below, identified the bullish case for EURSUD on 28 October 2022.
The current view of the chart is as expected given that the price has risen significantly, as shown below. The EURUSD appears to have some more room to rise, but a pullback on daily charts is possible due to the emergence of overbought conditions in the EURUSD chart.


