


Gold Triple Bottom Leads Prices Higher
The USD and Treasury bond yields are suffering from damage from the dovish US FED November meeting minutes and bad economic reports. On the other hand, the preliminary S&P Global Composite PMI for USA dropped by 3.95%, indicating increased recession risks in the world’s biggest economy. The US weekly Jobless Claims reached a three-month high of 240K, as layoffs in the US technology industry increased. The markets disregarded the 1% increase in US Durable Goods Orders as the US economy slowed. The significant economic events in USA almost clinched a 50-basis point (bps) rate rise by the FED in December, causing a strong sell-off in USD along with US Treasury bond rates which improved the price of Gold. Lower interest rates often enhance the non-yielding gold price.
Gold price has ignored China’s Covid revival and new limitations despite the fact that these factors have hurt physical gold demand in Asia this week. Gold premiums in the world’s leading hub, China, have decreased further, while increased domestic costs in India have reduced demand for the yellow metal. India and China are the world’s two largest consumers of gold. Thursday’s official statistics revealed that since the beginning of the epidemic, the number of daily coronavirus cases in China has reached a record high. The nation registered 31,454 domestic cases, and lockdown limits were reinstated in large areas. The market attitude is cautiously optimistic as the Federal Reserve’s dovishness overshadows China’s covid fears.
Technical Outlook for Gold Market
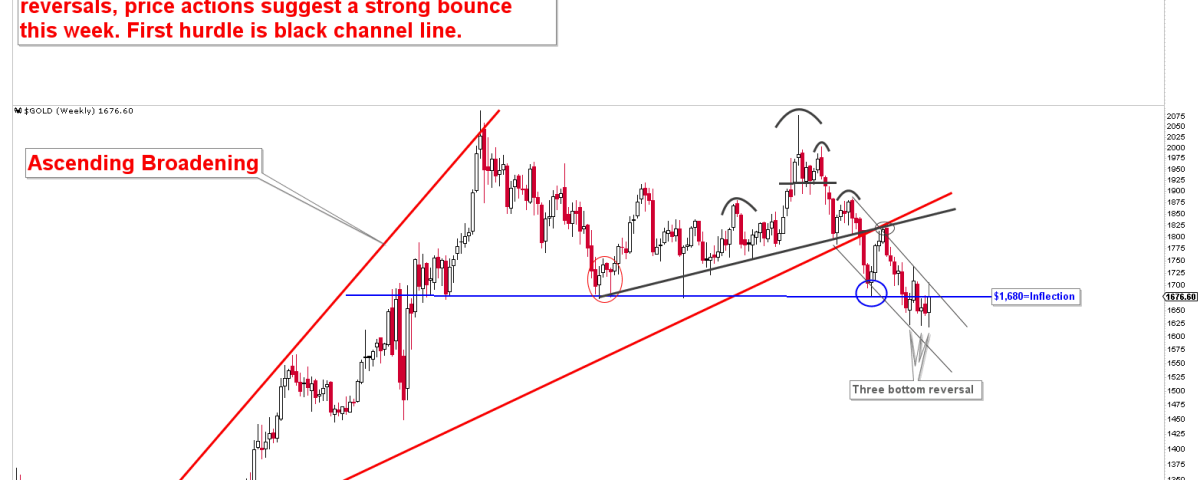
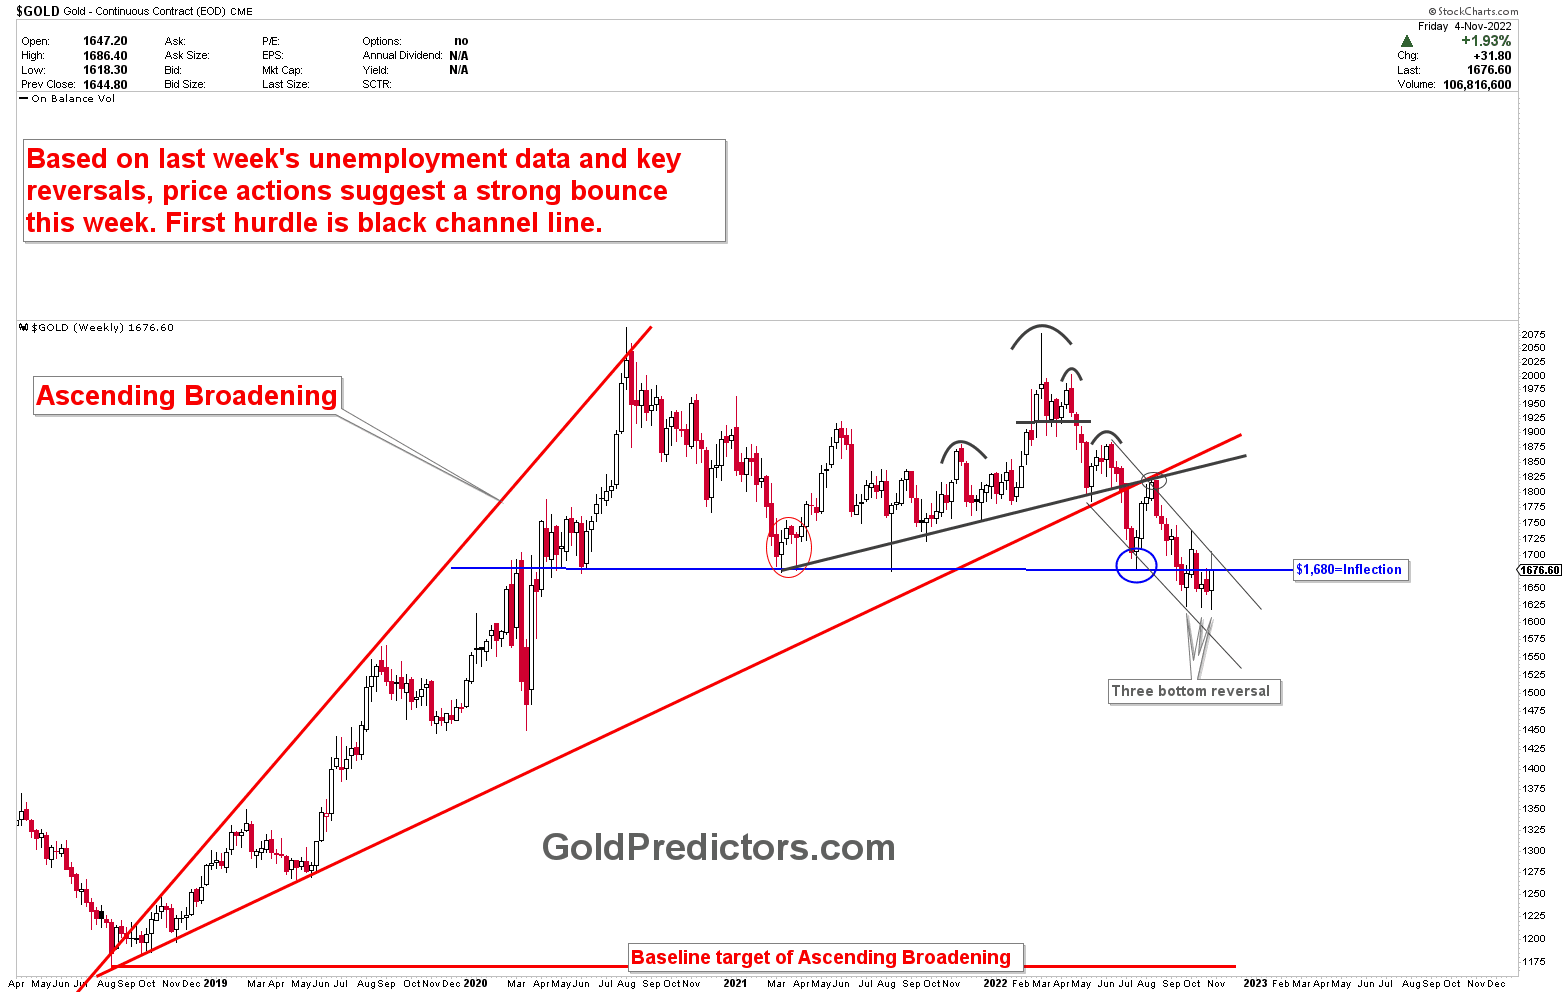
The gold weekly chart below explains the technical outlook for the gold market. The chart was presented to premium members during the weekly letter on November 4th, and it was clearly stated that three bottom reversals from the massive support indicate a quick rise higher.
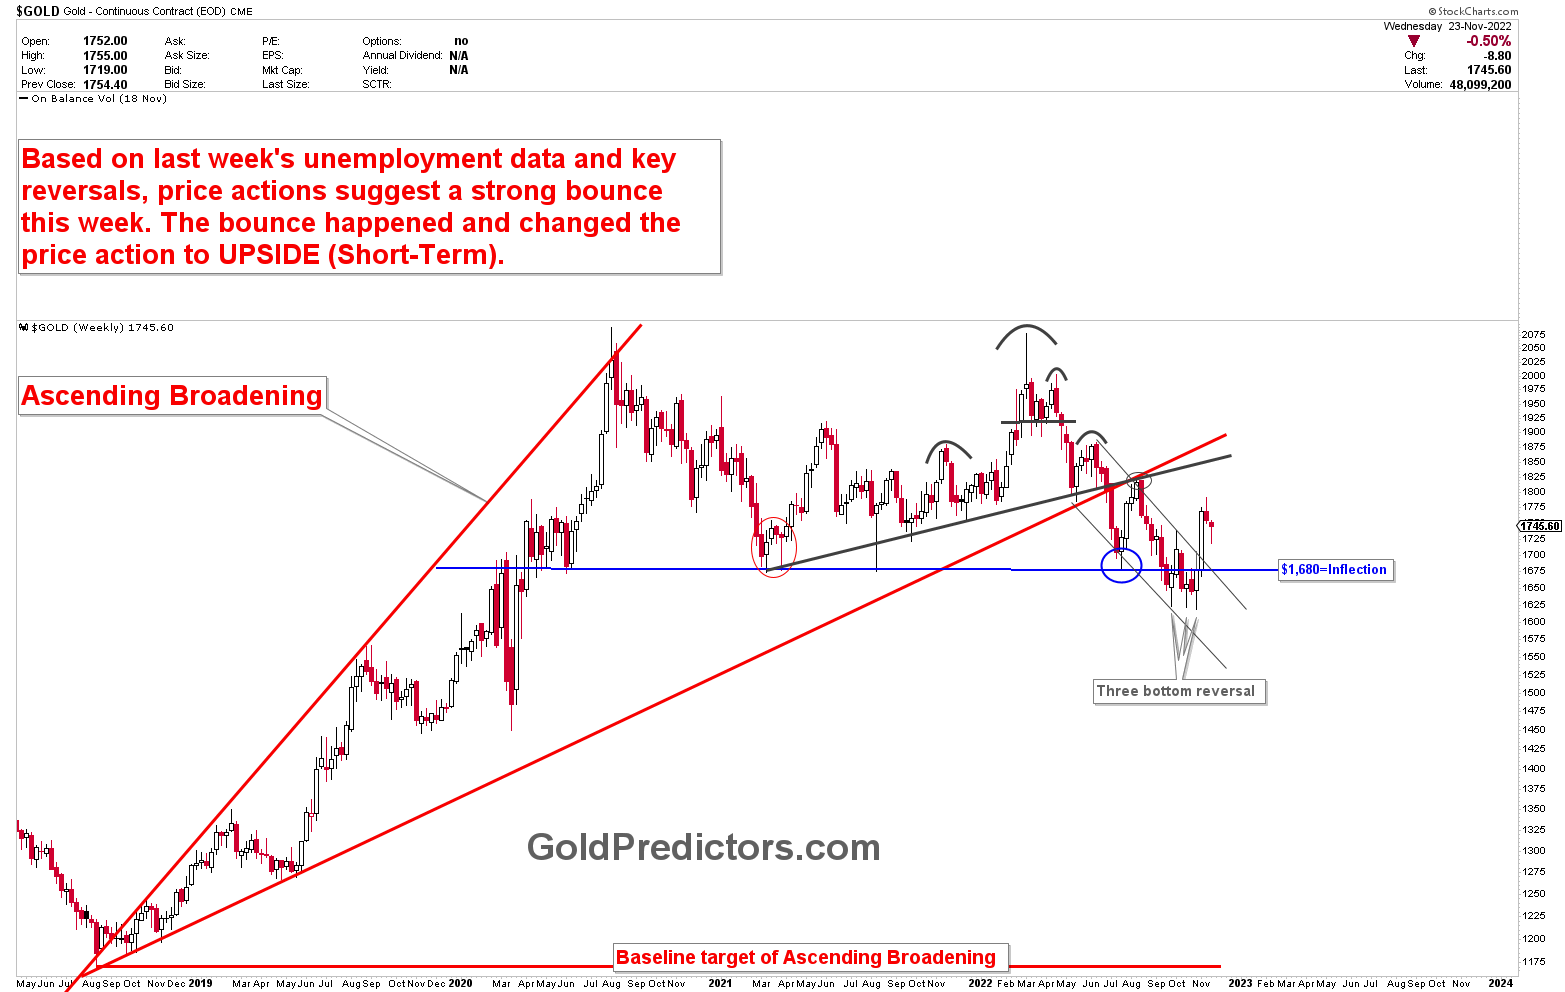
The chart that was updated following our expectations is shown below. In the gold market, a rapid and unstoppable rally began, propelling prices higher. The reality of gold market technicality is that the price has been forming bearish patterns for the last few months, and it has just flushed below the 1680 inflection point before shooting higher. Since we are approaching the end of the year, low volatility can cause some uncertainty in markets.
How to trade current gold environment?
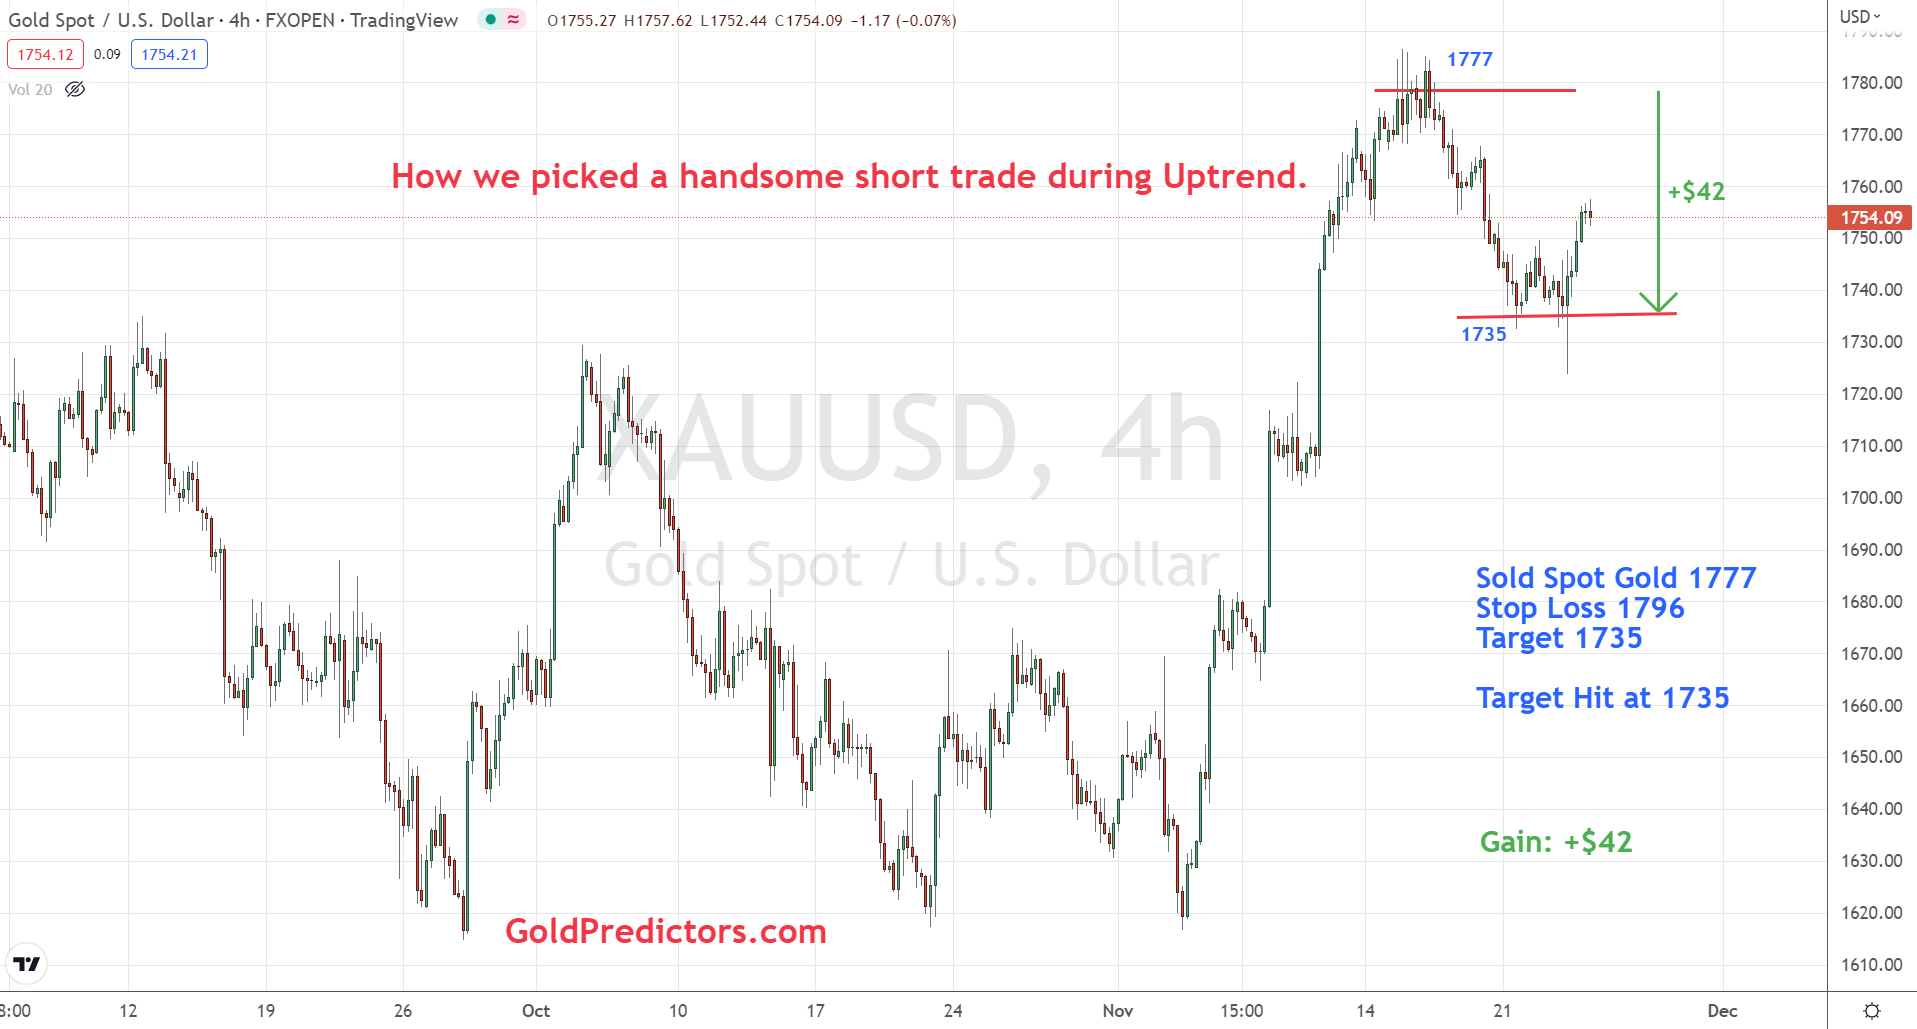
The gold market experienced three reversals and formed a solid bottom. The gold market’s short-term trend has shifted upwards, but 1780-1800 has been identified as a strong resistance. We executed a sell trade at 1777, and the trade was delivered to premium members via WhatsApp. The trade generated a tidy profit of $42. We sold 1777 and the high was 1786 and booked profits at 1735 and the low was 1725. We highlighted 1725-1735 as the area where we expected a rally to begin again.
Please login to read full article!
Please subscribe to the link below to receive free updates.


