


Will Gold Break The Inflection Point?
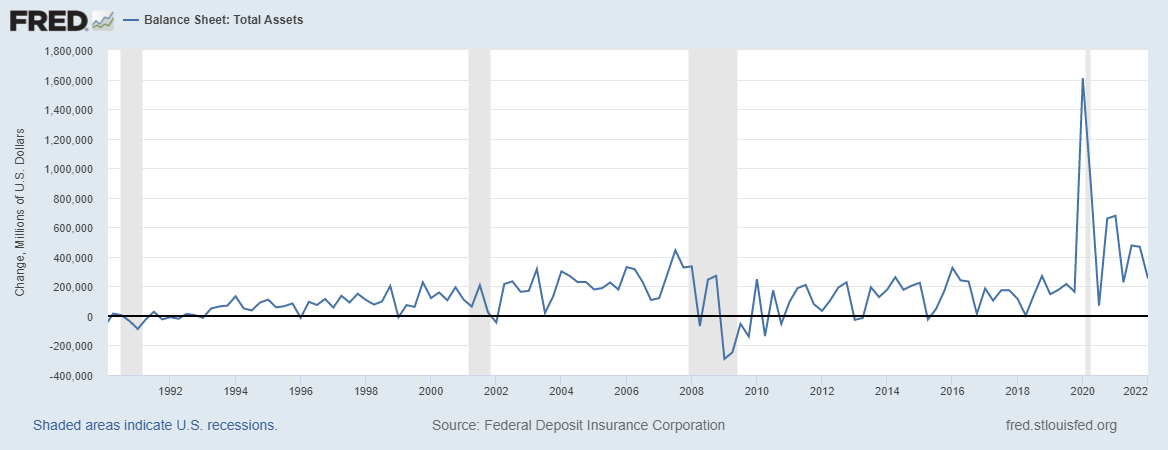
The Fed raised the federal funds rate by 75 basis points to 2.25-2.50%, the year’s second largest move, making the current tightening cycle the steepest in modern history. Despite all of the hawkish rhetoric, the Fed raised interest rates to their highest levels of the year, but there is still a long way to go before reaching the restrictive levels. This is disappointing news for gold because higher interest rates are inversely proportional to gold. The chart below depicts the Fed’s balance sheet, which barely decreases in the first quarter of 2022 despite quantitative tightness.
According to the Bureau of Economic Analysis, the United States’ GDP fell by 0.9% in Q2 after falling by 1.6% in Q1. Rates could rise more decisively due to high inflation, but the economy would struggle to absorb higher interest rates. In fact, the US economy will slow, but it will still be difficult to control inflation, which may benefit gold prices.
Technical Situation of Gold Market
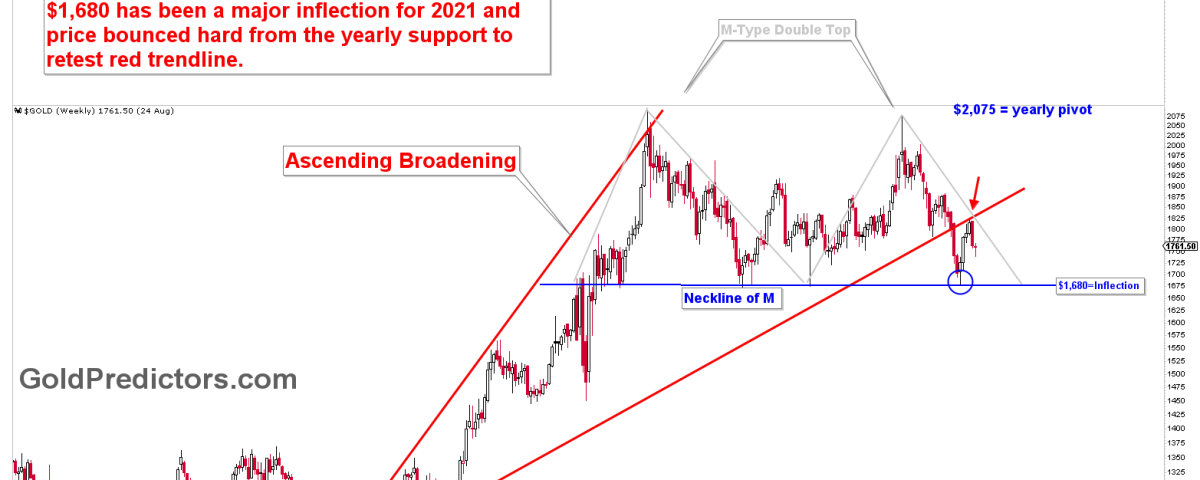
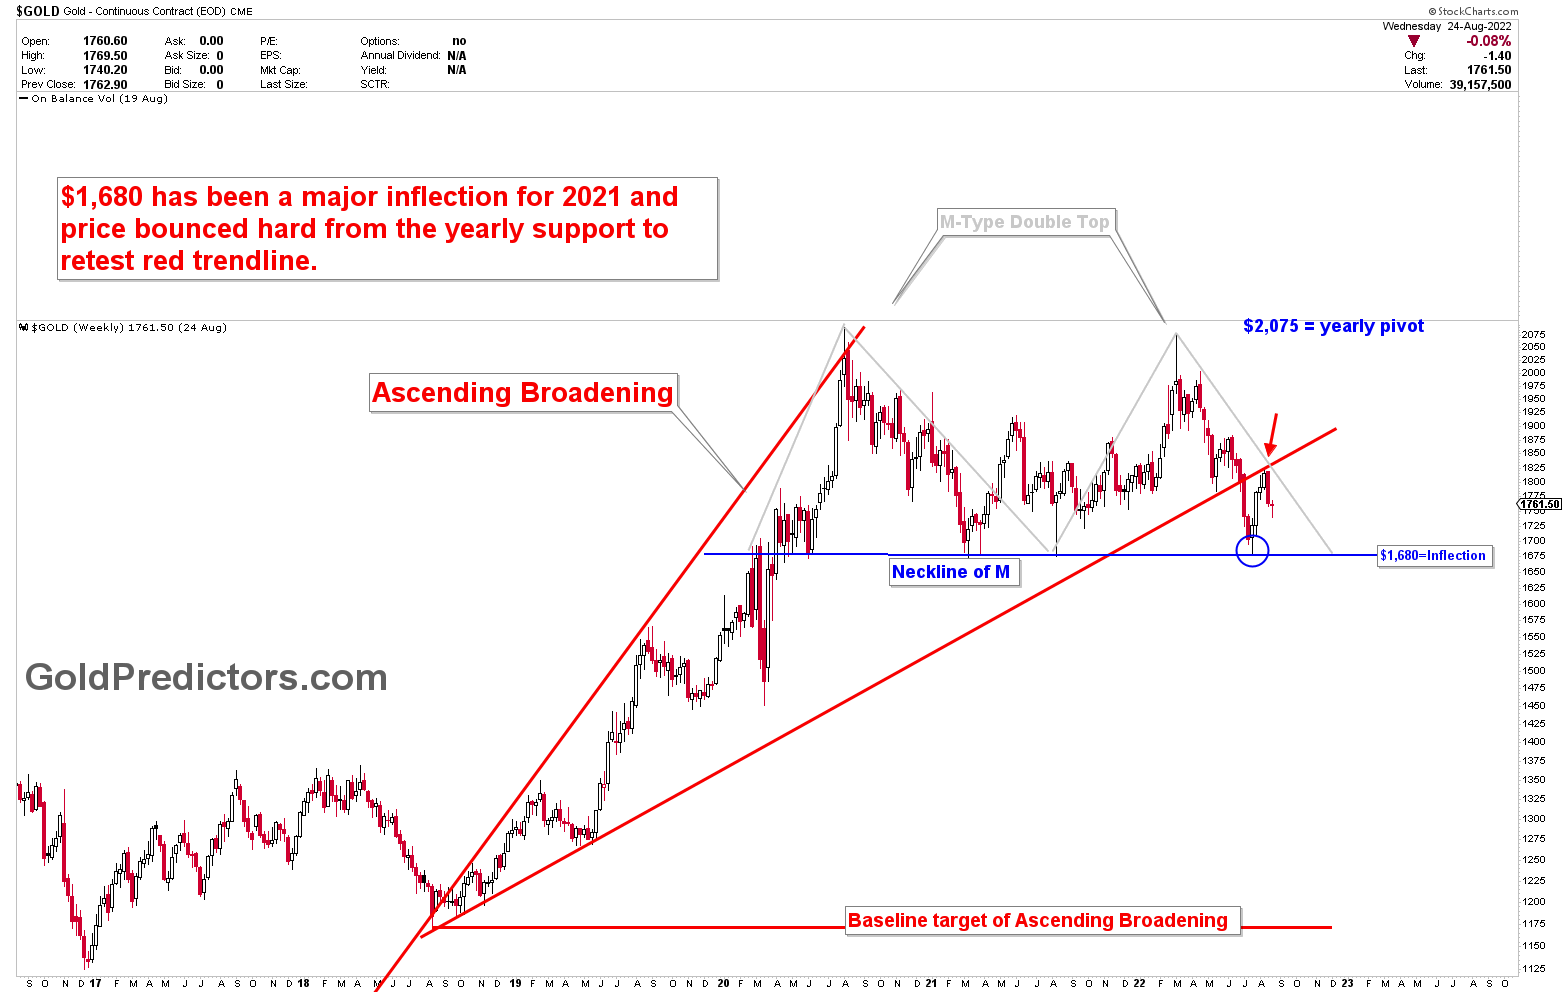
The technical situation in the gold market is complex, with Ascending Broadening patterns broken at $1,800 levels to reach the yearly inflection point of $1,680. According to recent discussions, gold was expected to test the 1680 inflection point, from which buyers will enter the market to target the breakout area, which is the red line of Ascending Broadening at $1772-$1833. Things went very well, and the gold market bottomed at $1,680 before bouncing hard to the $1,800 region. The gold market’s overall structure was bearish due to the strong bearish implications of multiple types of double tops on weekly and daily charts, indicating an upcoming major breakdown in the gold market. The $1,680 inflection protects the major breakdown in the gold market. This article will go over the detailed outlook of the pivots and support if gold breaks down from here. There are two cases in the gold market that have been discussed in recent months. The probability calculations for these cases have been completed and discussed in the sections that follow.
How to Trade the Gold Current Dynamics
Trading in precious metals has been extremely difficult in recent years due to the high volatility caused by geopolitical uncertainty in various aspects of the fundamental market. Because the risk is high, the reward is also high if trading fundamentals such as emotions and risk management are properly executed.
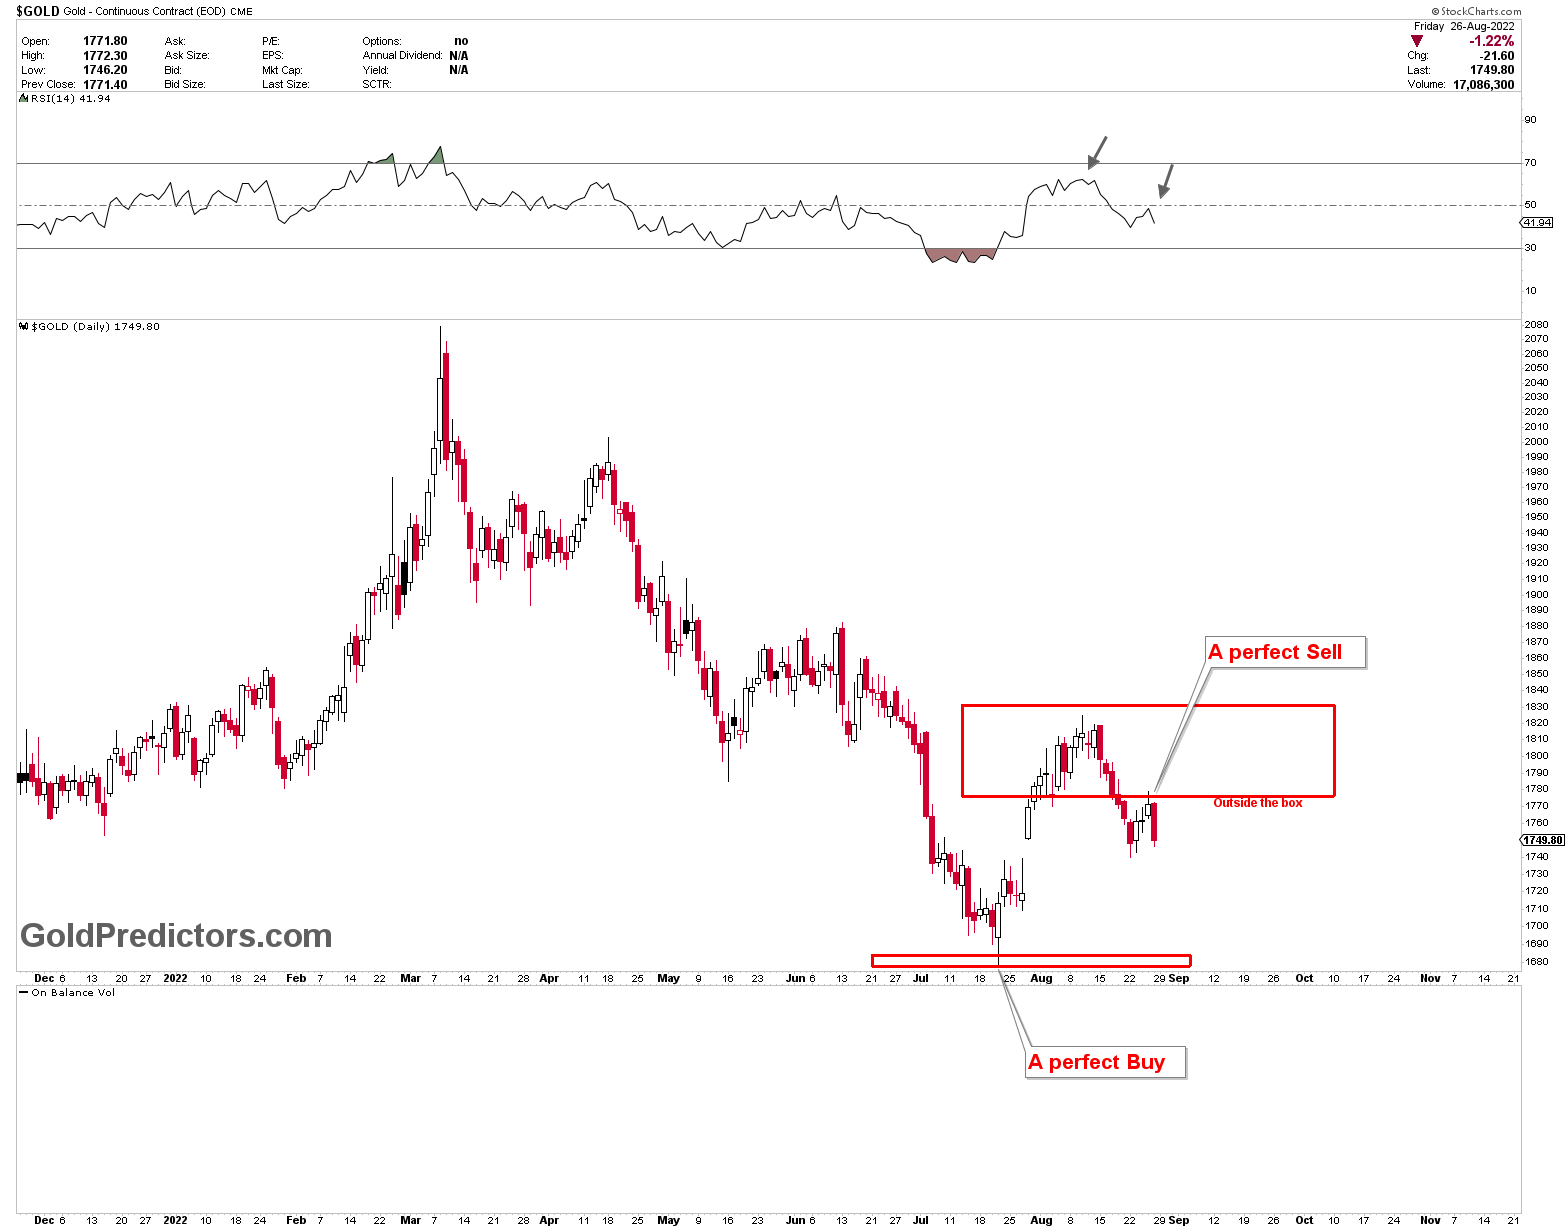
The most recent trading signals sent to members suggested a buy in $1,680 and a sell in $1,772-$1,833. However, when spot silver reached $20.80 (target), where we booked profits, the gold market shifted and began to fall, producing another selling signal that was slightly risky. Because the three conditions of the bullish side of the gold and silver markets were not met (as discussed in premium article), gold remained bearish with the advancement of the development of the bearish structure.
Please login to read full article!
Please subscribe to the link below to receive free updates.


