


Gold Achieved Forecasted $1,860
The Fed generally fulfilled expectations, igniting a buy-everything surge in the face of widespread bearish sentiment across global markets after a well-publicized move. While Chair Powell ruled out 75bp rises, the deck was weighted in favor of this result from a positional standpoint. Price action is following our script, which also emphasizes the scarcity of individuals with a desire to purchase gold, with just a few participants left. The consensus trade is long, with some complacent gold length remaining related to the Ukraine conflict. The few surviving shorts have a sizable position and are expected to benefit as prices increase, contributing to gold’s continued advance amid the buy-everything trade. In the near term, the attention of gold traders will be drawn to the imminent publication of the US labor market data for April on Friday. If the report finds further evidence of rising wage pressures, this increases the upside inflation risks for the US economy and increases the possibility of the Fed making a significant further hawkish turn this summer. In this situation, gold may soon relinquish recent gains and hit weekly lows around $1,850. If not, and if the bulls accomplish a stronger upward breach of $1,920, the immediate term trend will convert to bullish.
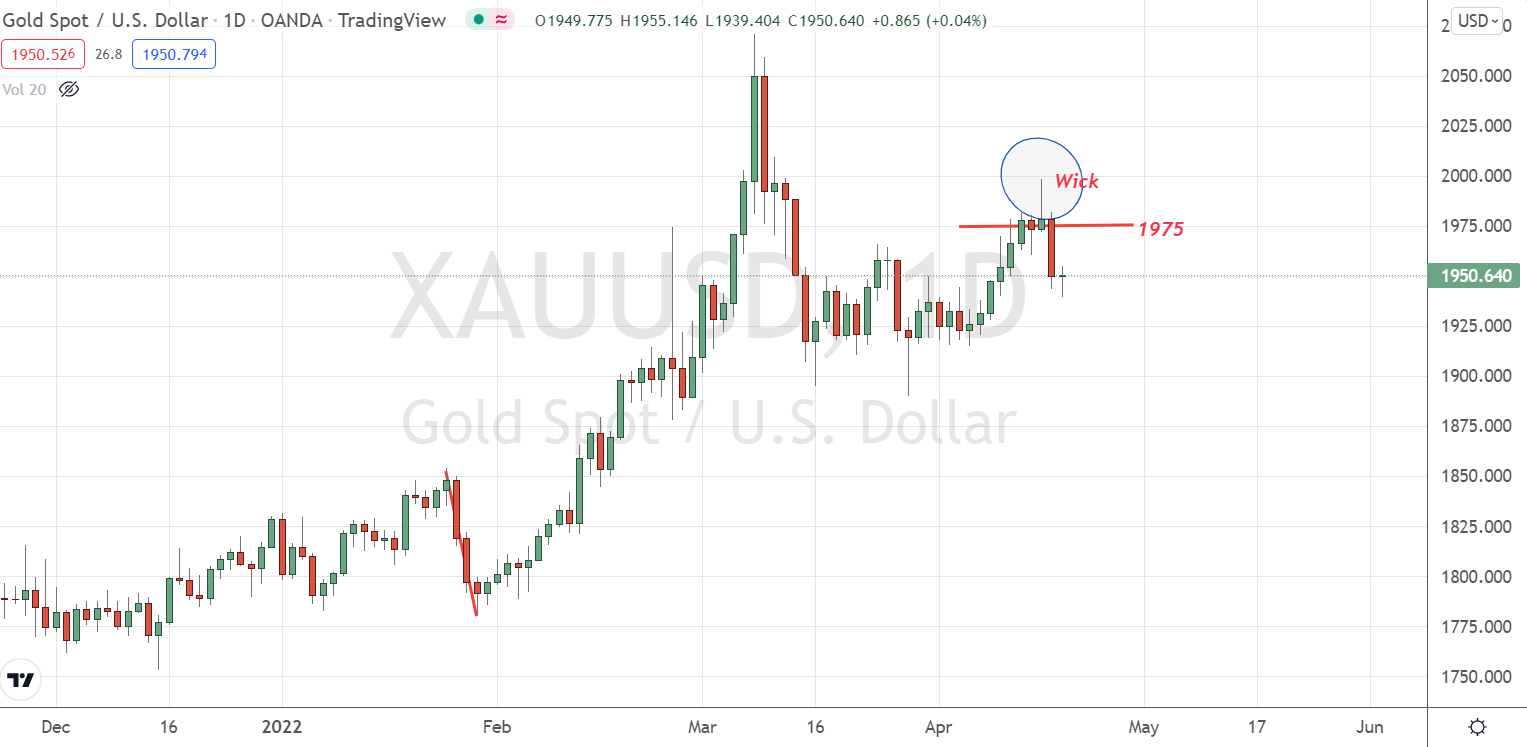
According to our interpretation of the technical gold chart, the price bottomed in $1,975 last week and bounced back towards $1,920, when the major decision was due. The $1,920 produced strong resistance once more, and the price is attempting to pullback. It was mentioned in previous premium articles that gold could fall from $1,919 to $1,860, and a selling opportunity to see at $1,919 was posted. This wave’s objective has been met since gold reached $1,850 levels. The chart region from $1,850 to $1,920 would be critical in determining the next course of action. To confirm the cycle’s bottom, gold must close above $1,920. Prior to the release of NFP data, the market typically behaves sideways. However, the current market environment has created a great deal of uncertainty in gold prices.
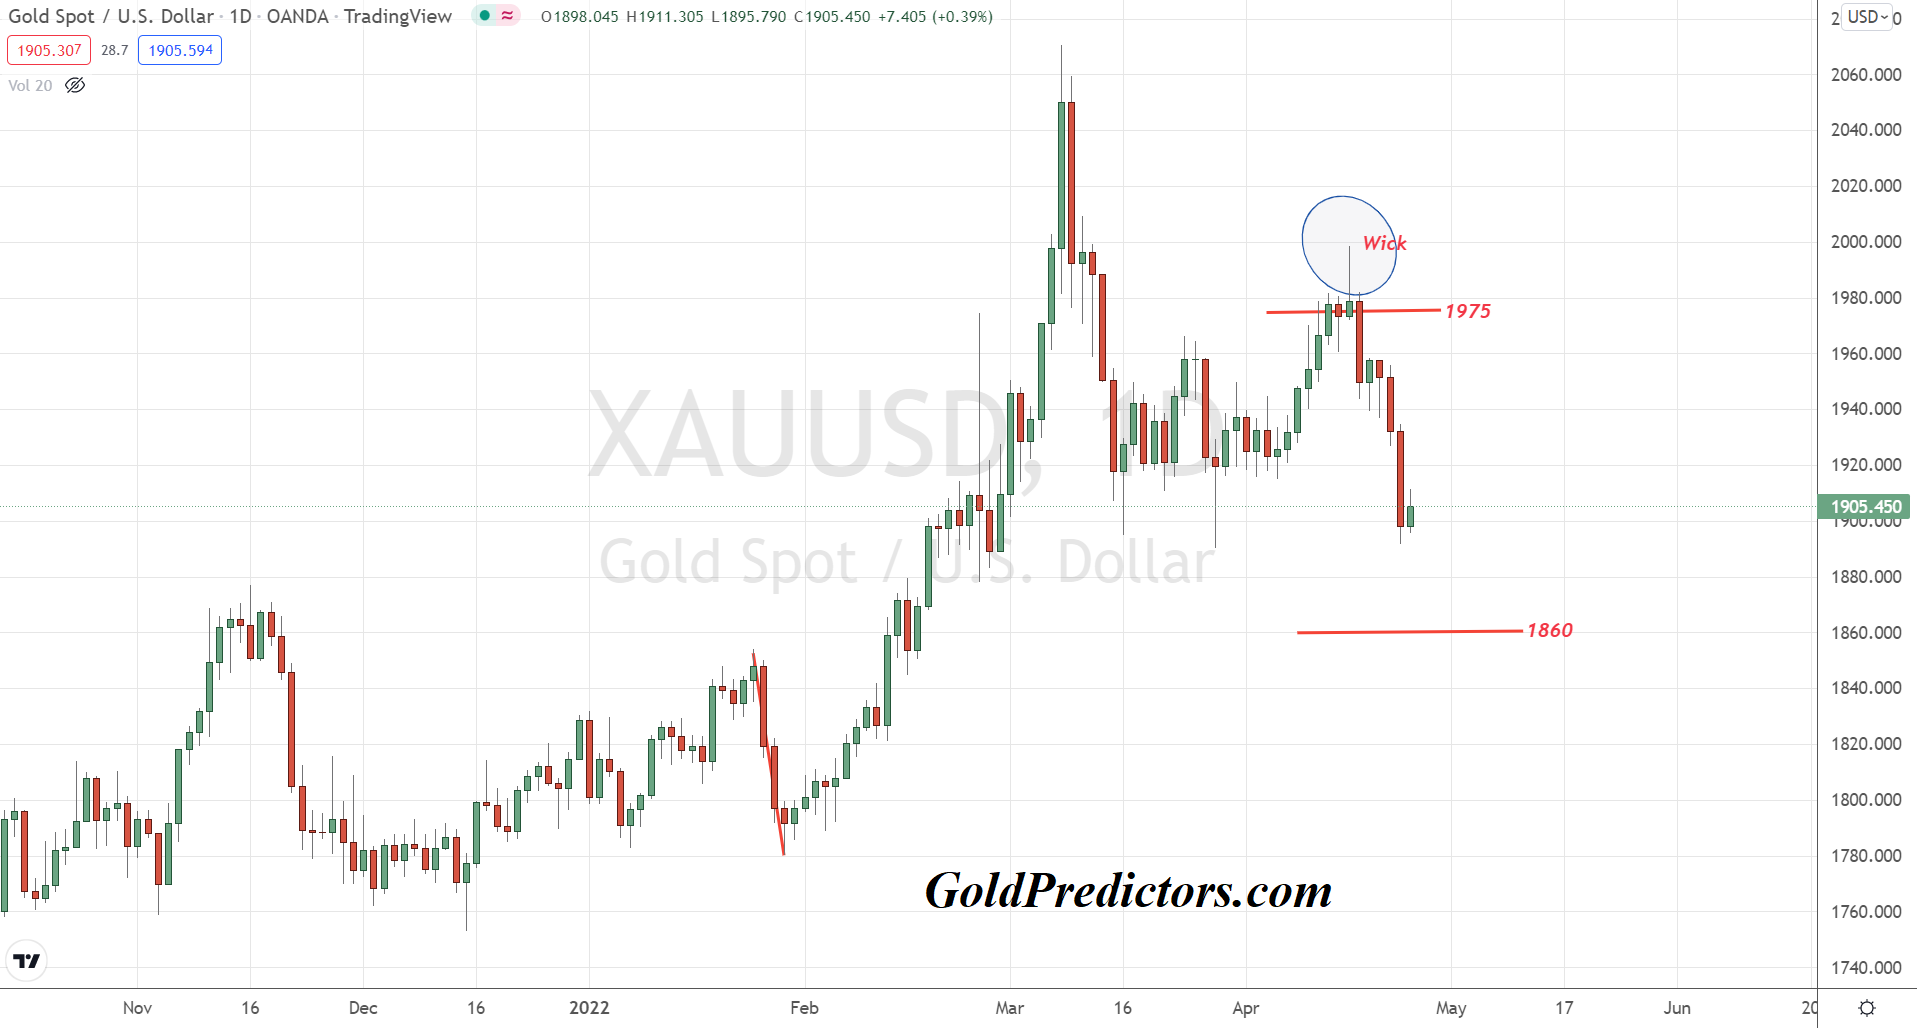
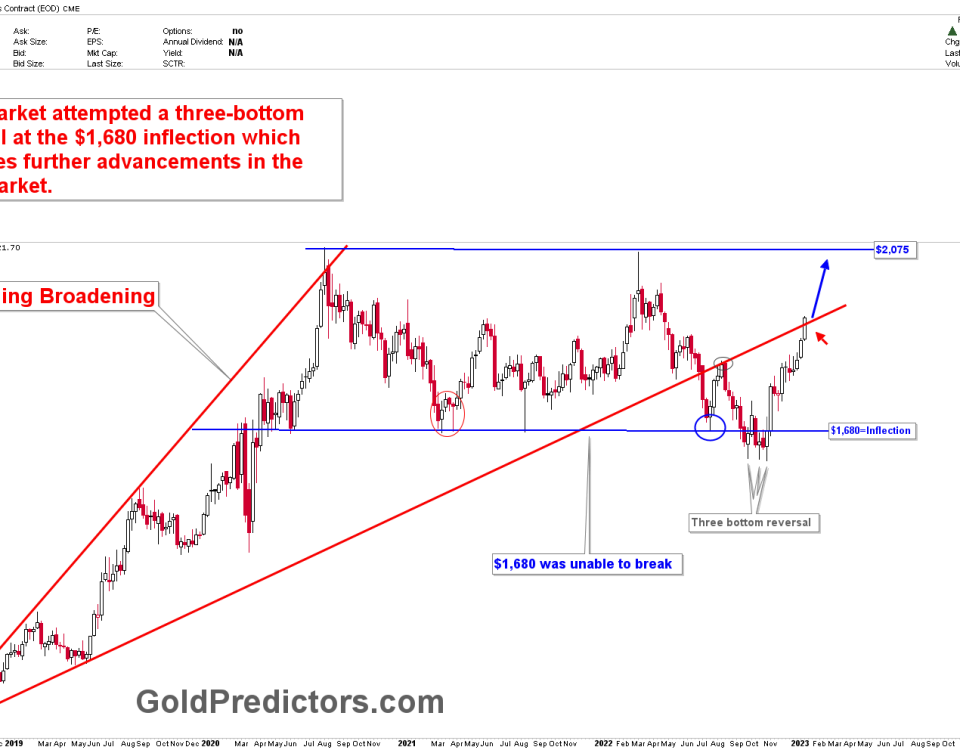
The chart below was presented 2 weeks ago. The chart shows that how price followed our prediction of drop from $1,920 to $1,860 region. The chart shows the formation of wish at defined $1,975 resistance which indicated a drop.
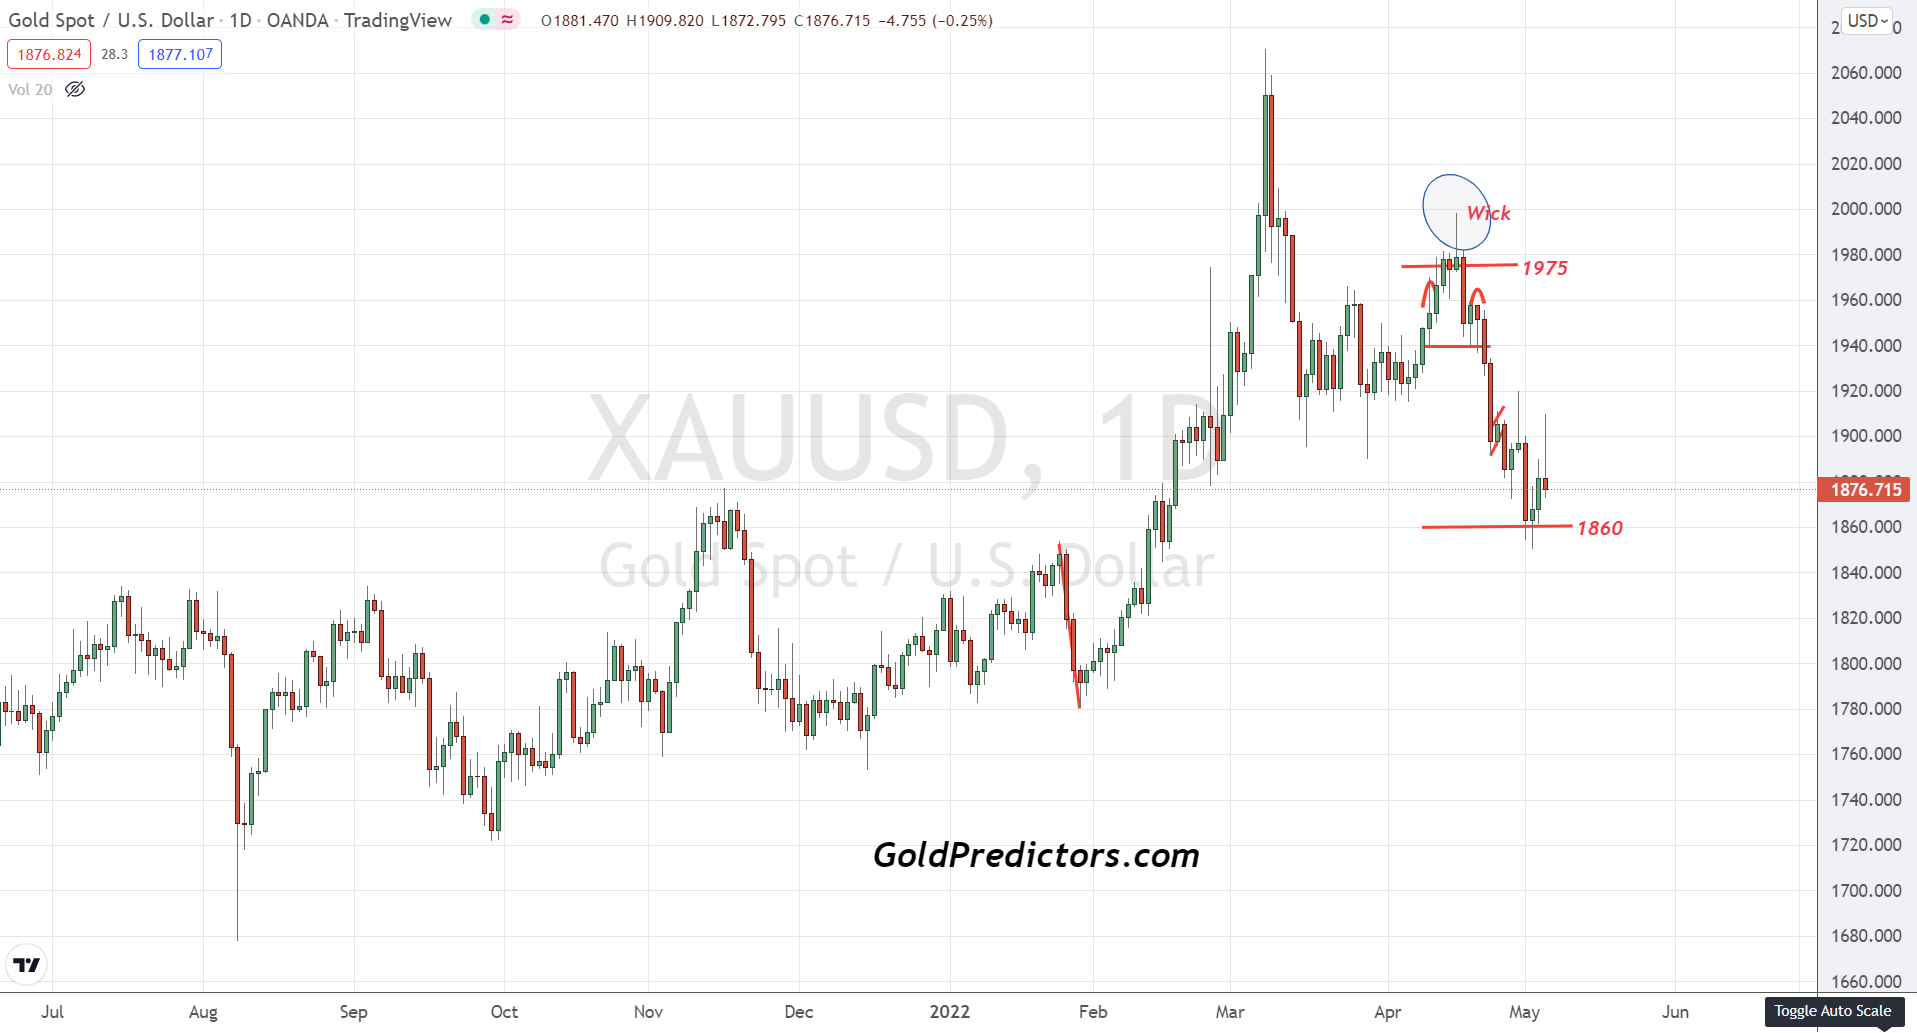
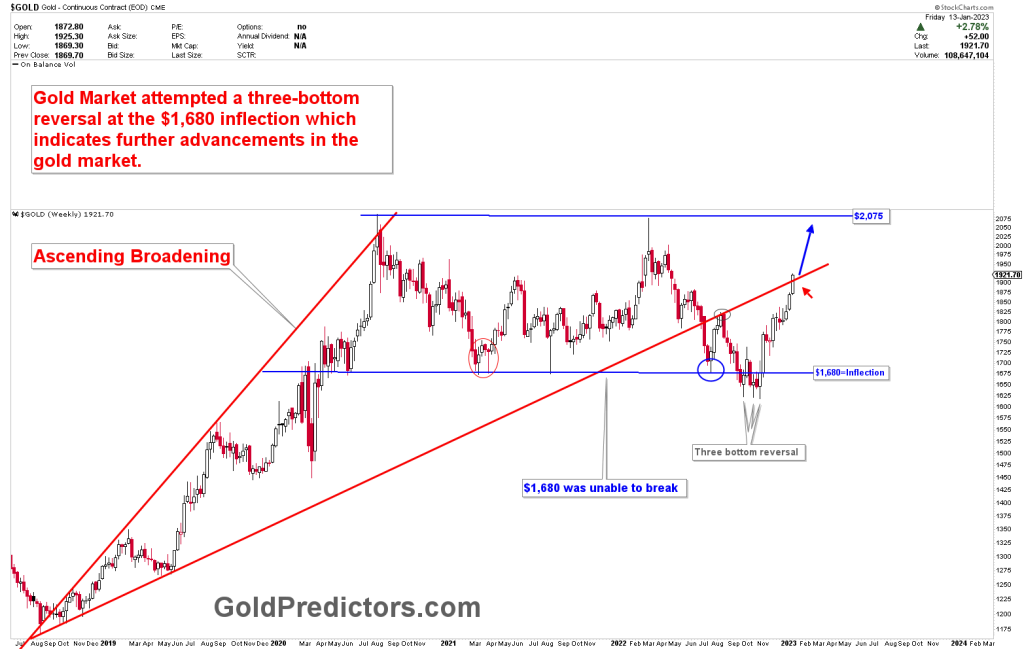
We also posted the formation of head and shoulders and bear flag flag in trading signals section whereby the target of $1,860 was estimated. Price has now achieved the target and aiming for next direction. The latest updated chart is shown below.
Gold Predictors Celebrates 6th Anniversary!
Please login to read full article!
Please subscribe to the link below to receive free updates.