


Japanese Yen on Fire
The US dollar index has reached a strong resistance level, suggesting that a pullback is possible. However, there is no indication that the bounce in the US dollar index has finished. The Japanese yen remains the weakest currency on the board, while the GBPJPY and USDJPY are poised to increase.
Highlights
- The US dollar index is still trading in a wide range and has reached a strong resistance level.
- The Japanese yen remains the weakest currency on the board, and the GBPJPY is triggering through an important area after forming strong patterns.
Weakest Currency: JPY
Strongest Currency: CAD
Best Instruments to Focus:
Long GBPJPY
Long USDJPY
US Dollar Index
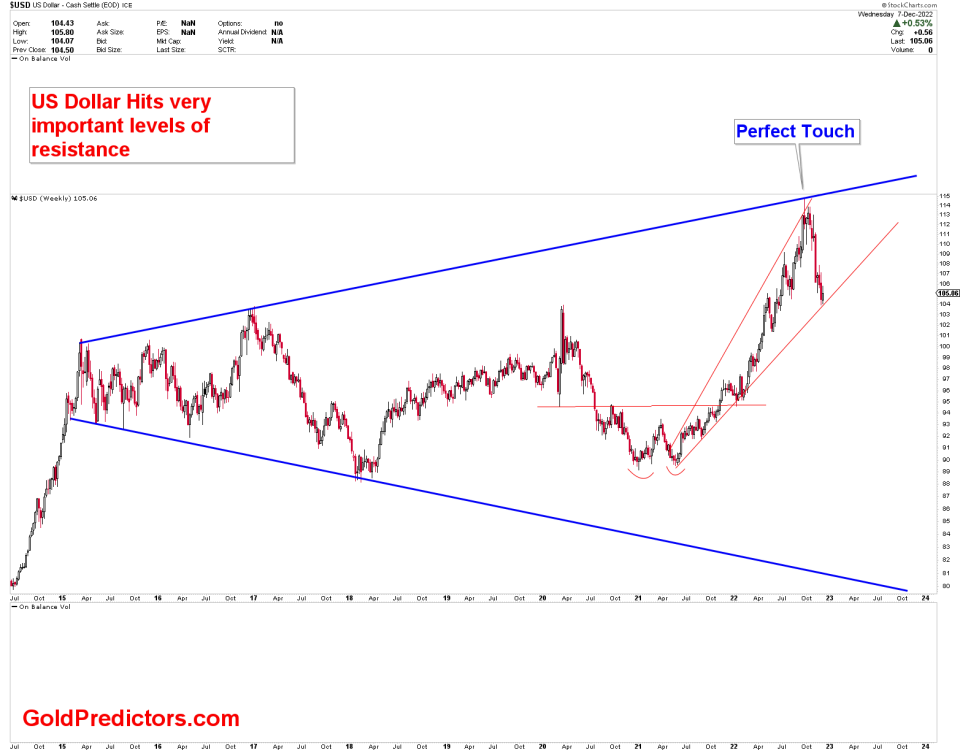
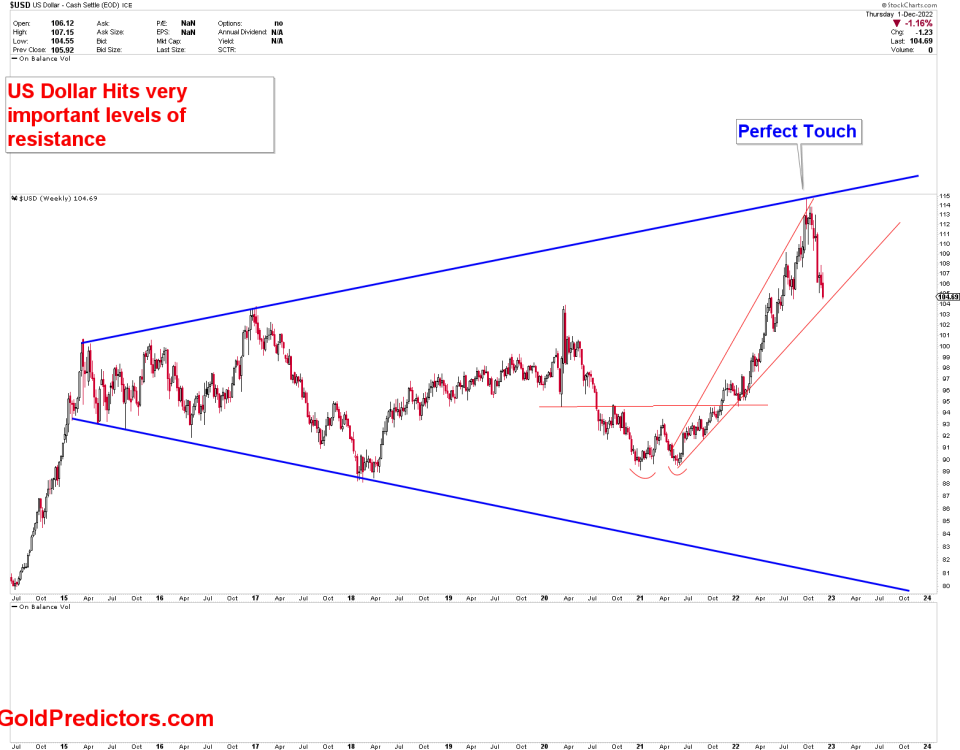
The chart from the most recent premium article demonstrates the significance of the US dollar index at current level. The index is trading at a critical juncture where a pullback is expected. The neckline of the double bottom and the rising wedge trendline define this juncture. If the rising wedge is broken to the downside, it is a bearish pattern. Several times in recent months, it has been stated that the long-term outlook for the US dollar is bearish. However, a significant bounce from 89-90 to the region of 93-94 was expected. The bounce was initiated, and the US dollar index had reached the resistance level of 94.
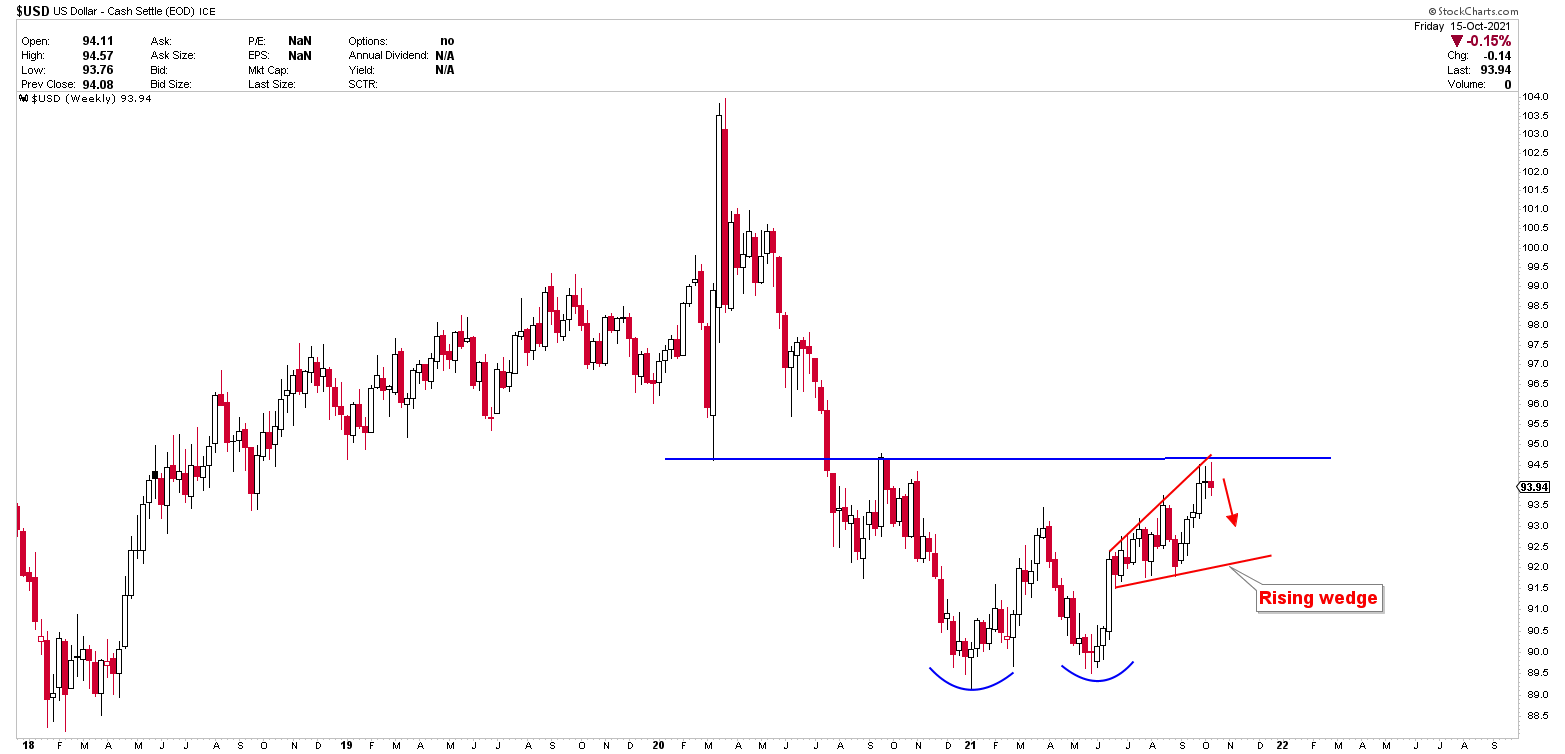
There are multiple of charts explaining this scenarios where the bounce from 89-90 towards 94 was expected. Now the initial targets are there. We expect further sideways in US dollar index. The one of the reason for forecasting a wide range in spot gold was the US dollar index. As the index could see a strong pullback at any time. However, there is no indication of a turn in the index until there are confirmations.
GBPJPY Outlook
The Japanese Yen, on the other hand, has been the weakest current on the board. The instrument of GBPJPY and USDJPY are breaking through significant barriers. The USDJPY has yet to cross an important resistance level, but the GBPJPY has made a strong breakout since last week. Let’s take a look at the monthly chart below to better understand this breakout.
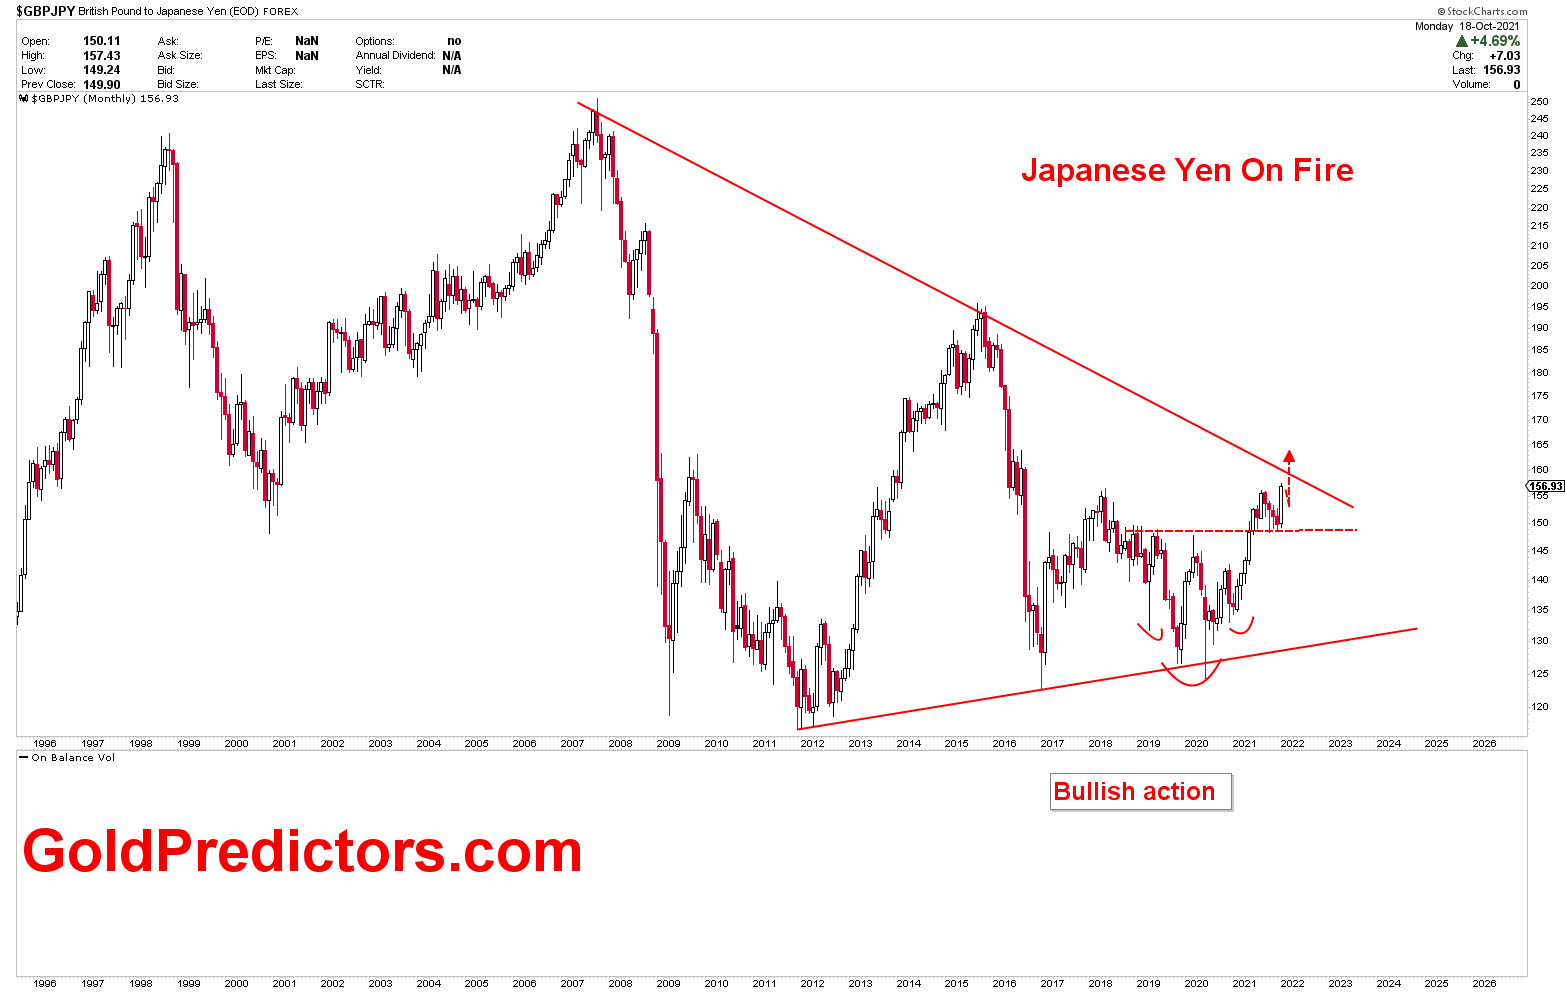
The above monthly chart depicts a symmetrical triangle in which price reversed from the lower angle of support, resulting in multiple spikes. These multiple spikes contributed in an inverted head and shoulder, the neckline of which was broken last week. With the monthly candle pointing upward, the retest of this neckline provided strong support. In this chart, the price must close the month of October at or above its current level in order to confirm a mega breakout.
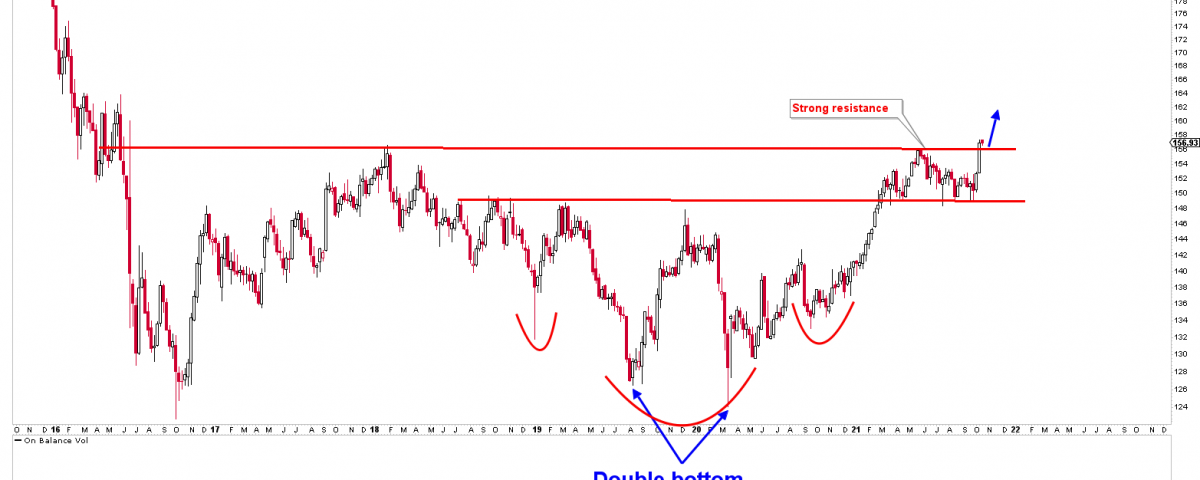
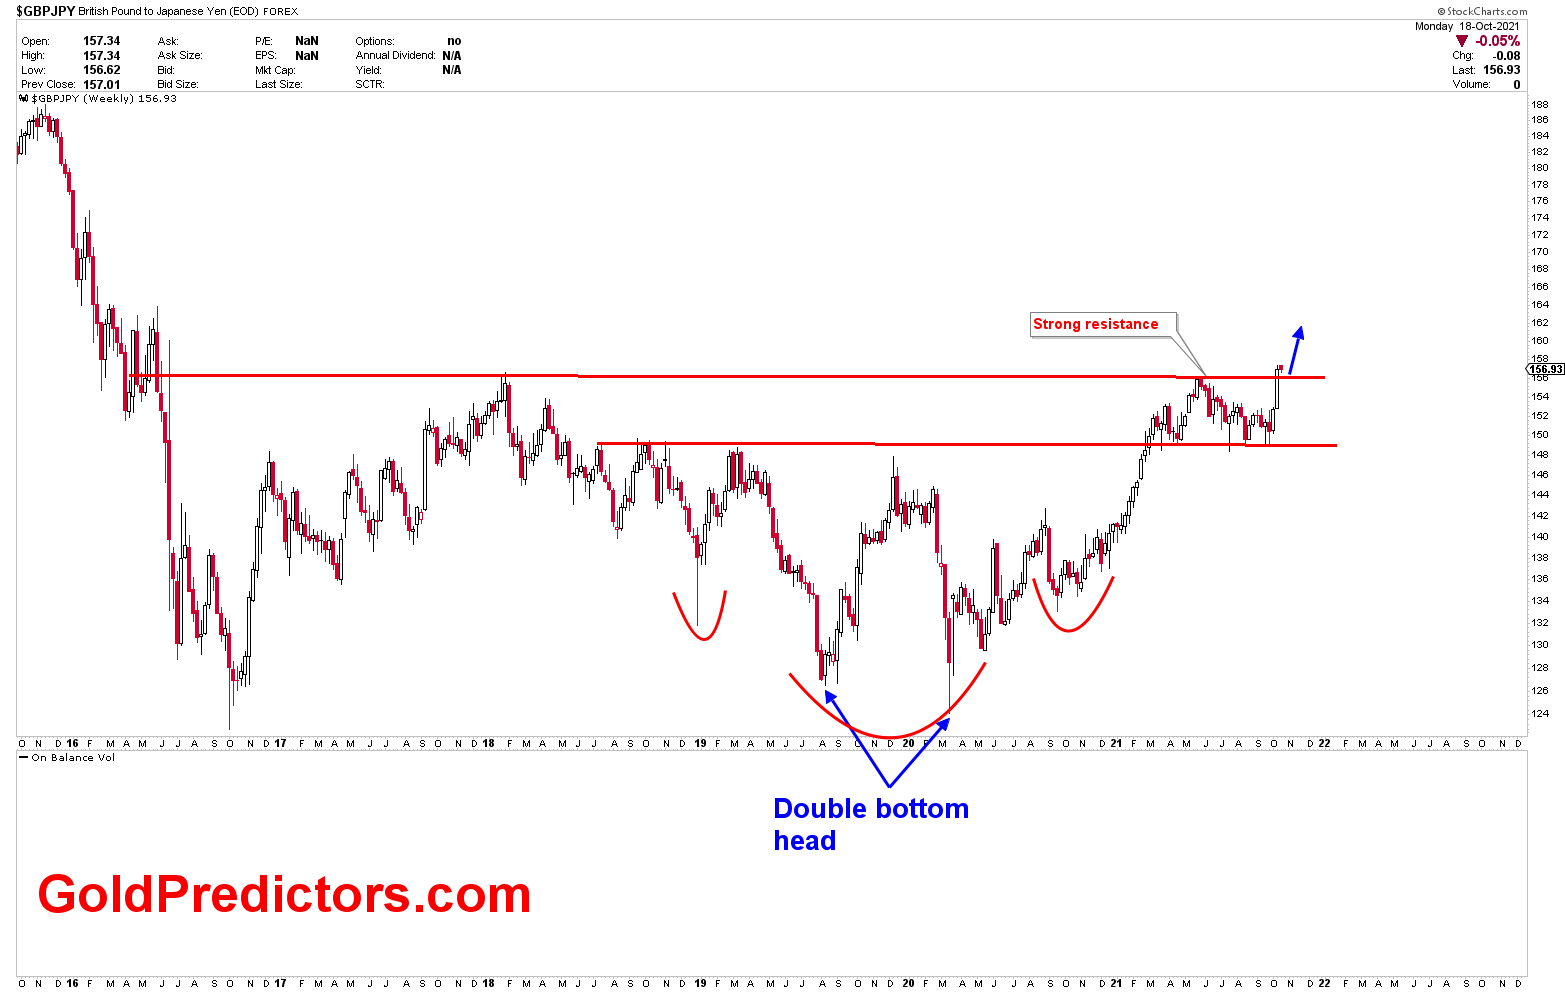
The zoom out view shows the weekly chart for GBPJPY, where the patterns indicate a strong bullish momentum. The inverted head and shoulder are also supported by the double bottom. These types of patterns usually result in large upward moves.
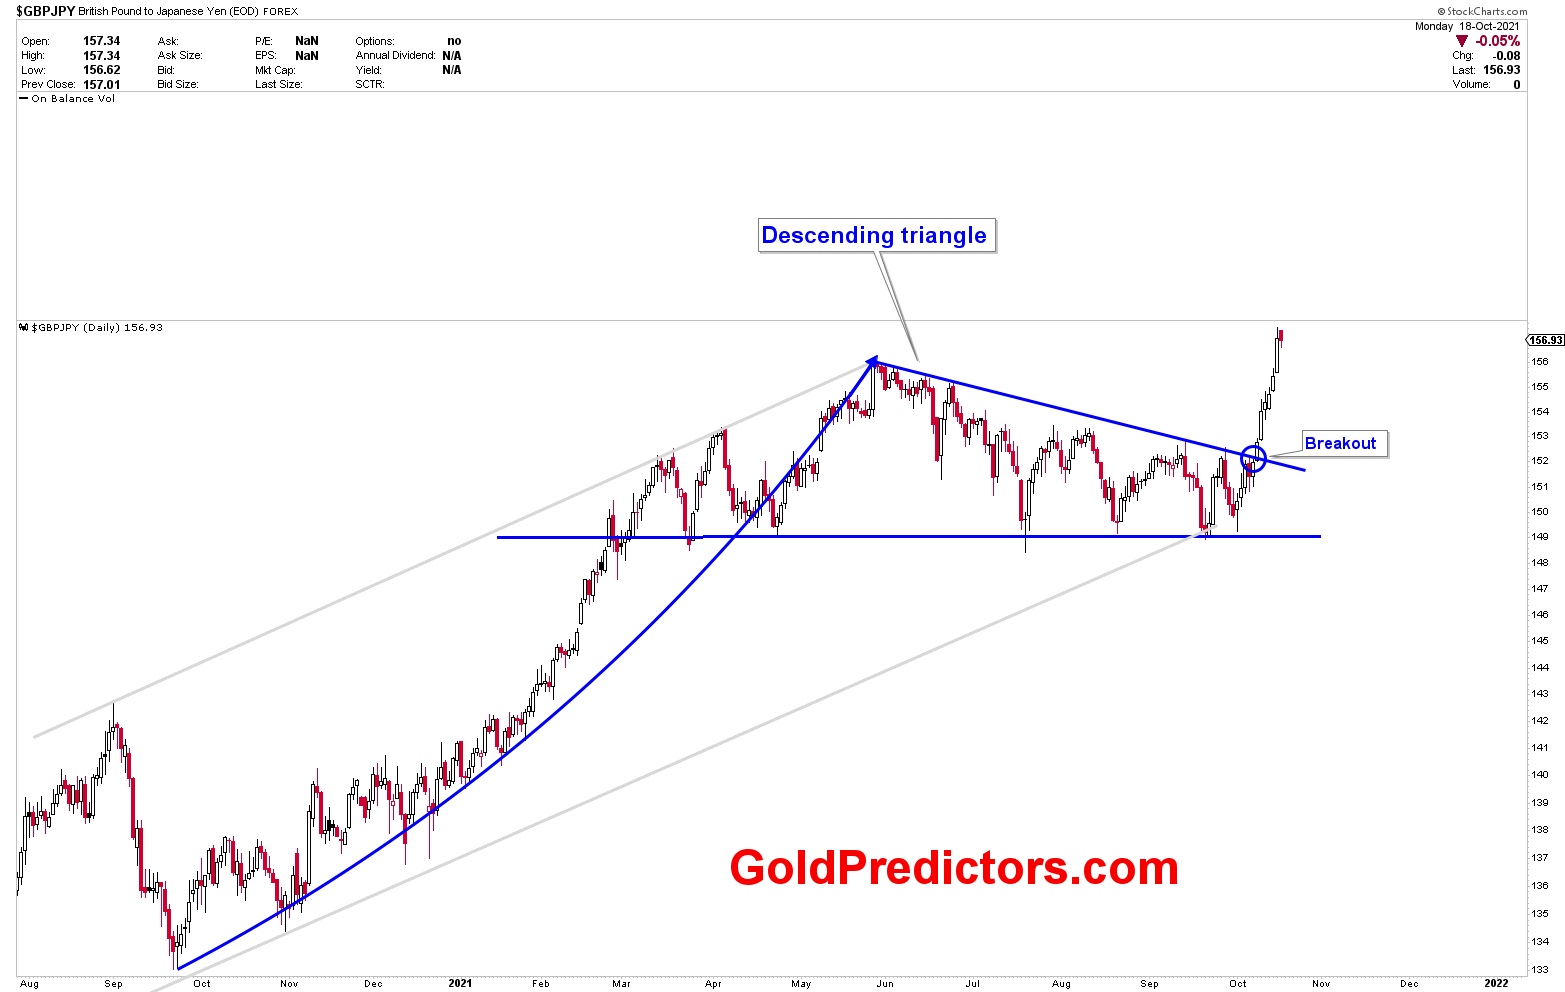
On the daily chart, the price of the GBPJPY has been rising in a clear uptrend from October 2020 to June 2021. Multiple touches at the bottom of the blue descending triangle, followed by a breakout above this level, confirmed that the instrument is poised for further gains in the coming weeks and months.
To receive free updates, register as a free member