


Gold Builds Bullish Momentum as Long-Term Patterns Point To $6,000
Gold (XAU/USD) has captured the attention of traders and investors in 2025. With geopolitical instability and inflation concerns, gold continues to shine as a safe haven. Recent technical patterns and price action suggest a strong bullish structure that may push gold prices to new highs. This article discusses the charts for spot gold, showing the short-term and long-term price structures to find the next move in the gold market.
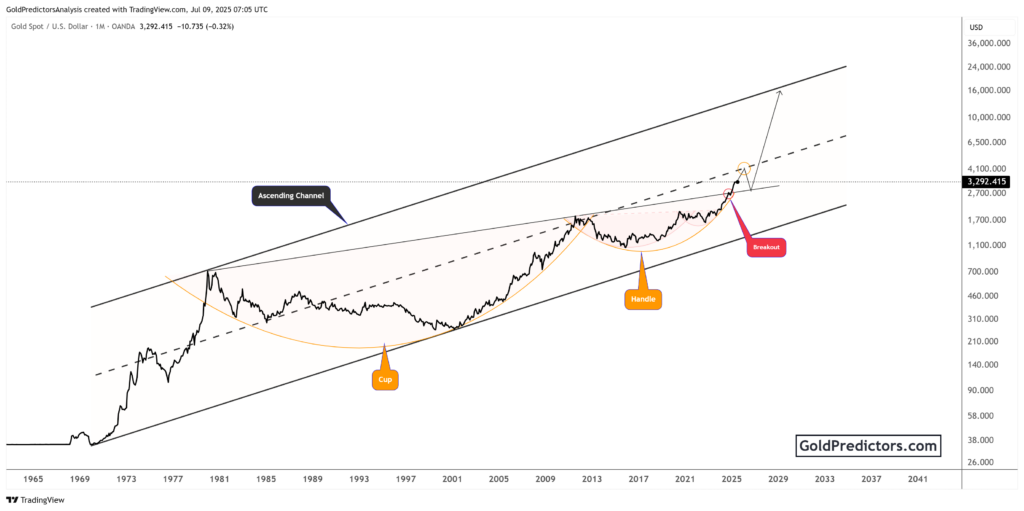
Gold Builds Bullish Momentum Within Ascending Channel and Eyes Breakout
The chart below shows a well-defined ascending channel that has guided gold’s price movement since early 2024. This channel has provided support and resistance, with prices consistently bouncing within the structure. In early 2025, gold experienced a sharp rally, testing the upper boundary of this channel at $3,500 before pulling back.
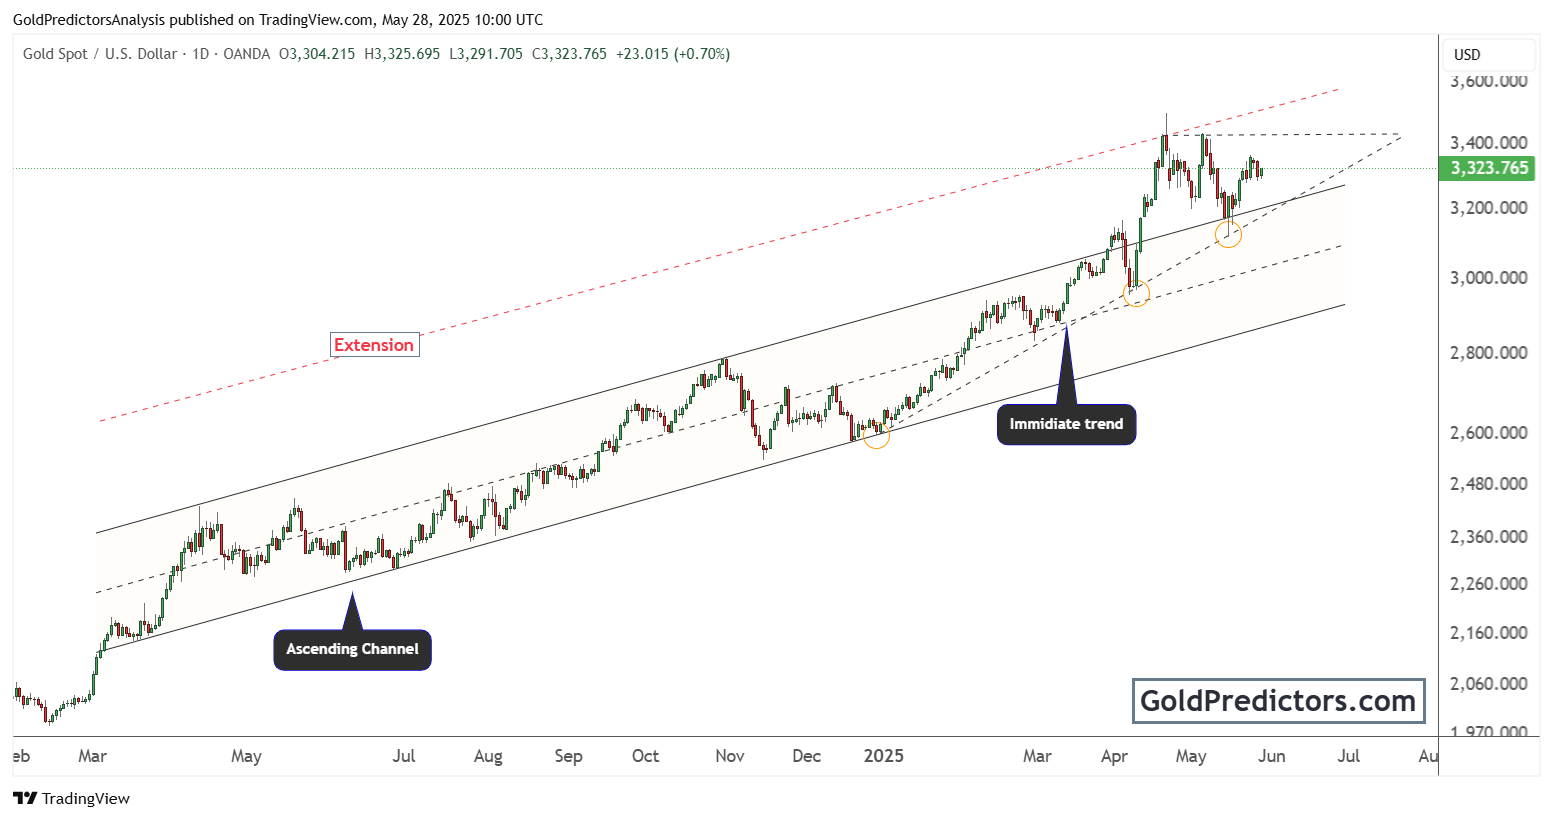
Despite short-term pullbacks, the immediate trend remains bullish, as highlighted by the dotted black line in the middle of the channel. Gold has respected this line as dynamic support, rebounding from it several times. The orange circles mark recent dips that found strong support at this immediate trend line. These reactions reinforce the market’s bullish sentiment and confirm that buyers continue to step in at key support zones.
An interesting feature is the extension zone, shown by the red dashed line. This potential upper target suggests that if momentum continues, gold could push beyond the standard channel and enter an extended phase of the Bull Run. The price currently trades around $3,323, and a break above recent highs at $3,400 would validate the continuation toward this extension zone.
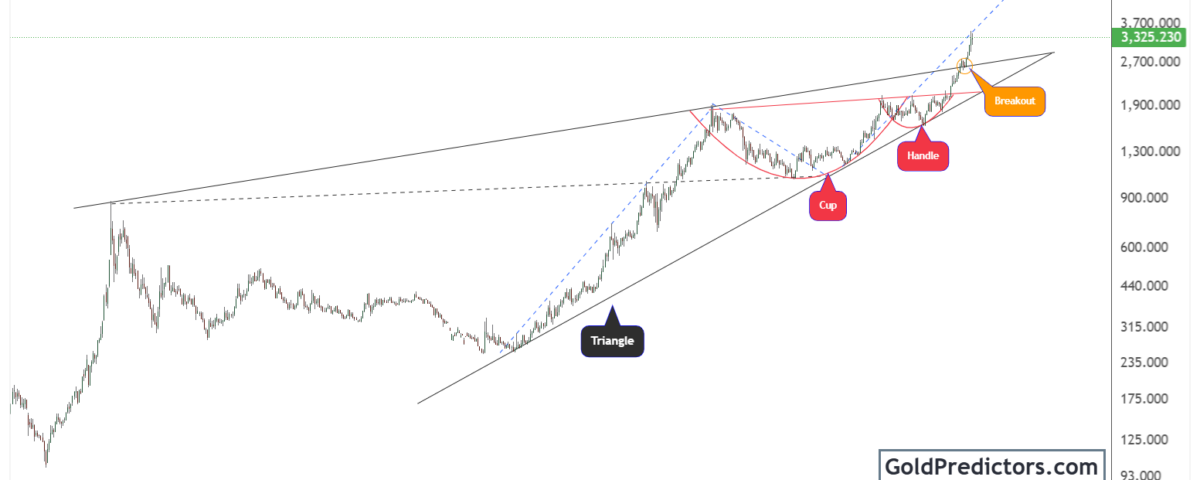
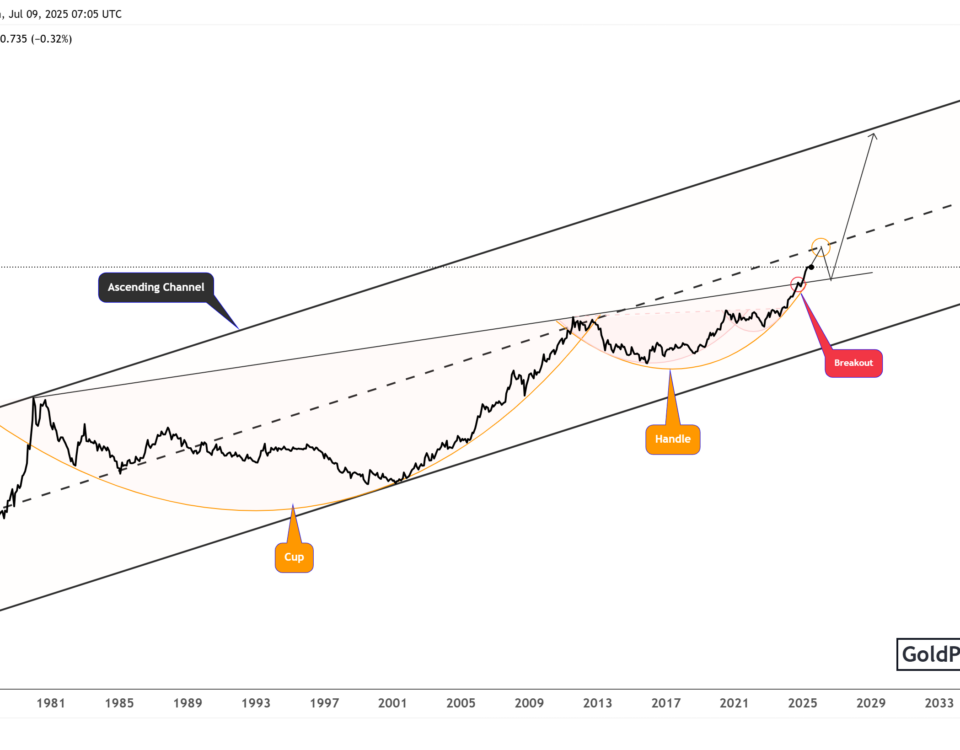
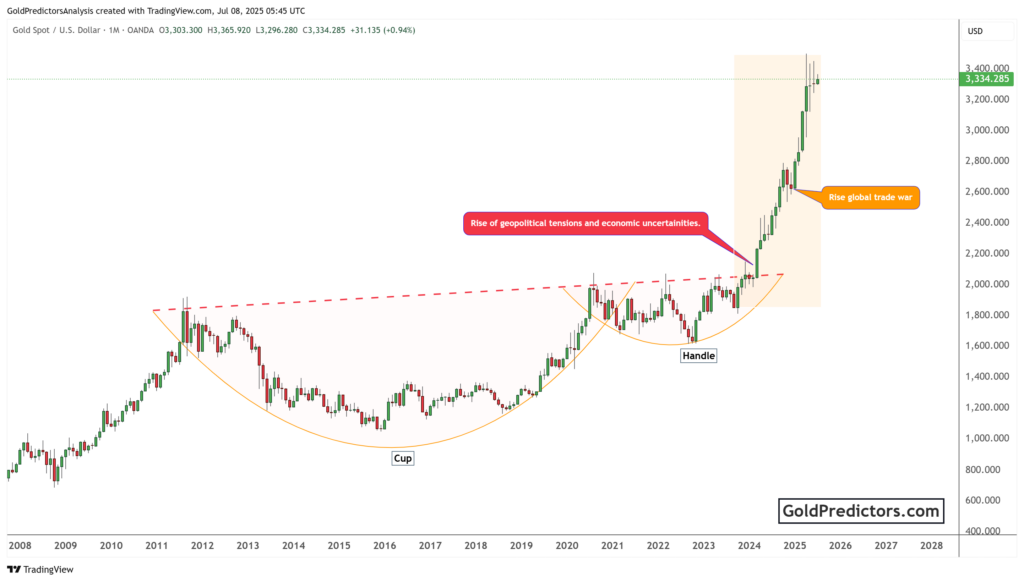
Gold Confirms Long-Term Cup and Handle Breakout
The gold chart below shows a long-term historical view that captures price movements from the 1970s. A powerful long-term Cup and Handle pattern has formed, signalling a potential massive bull market ahead. This is one of the most reliable bullish reversal patterns in technical analysis.
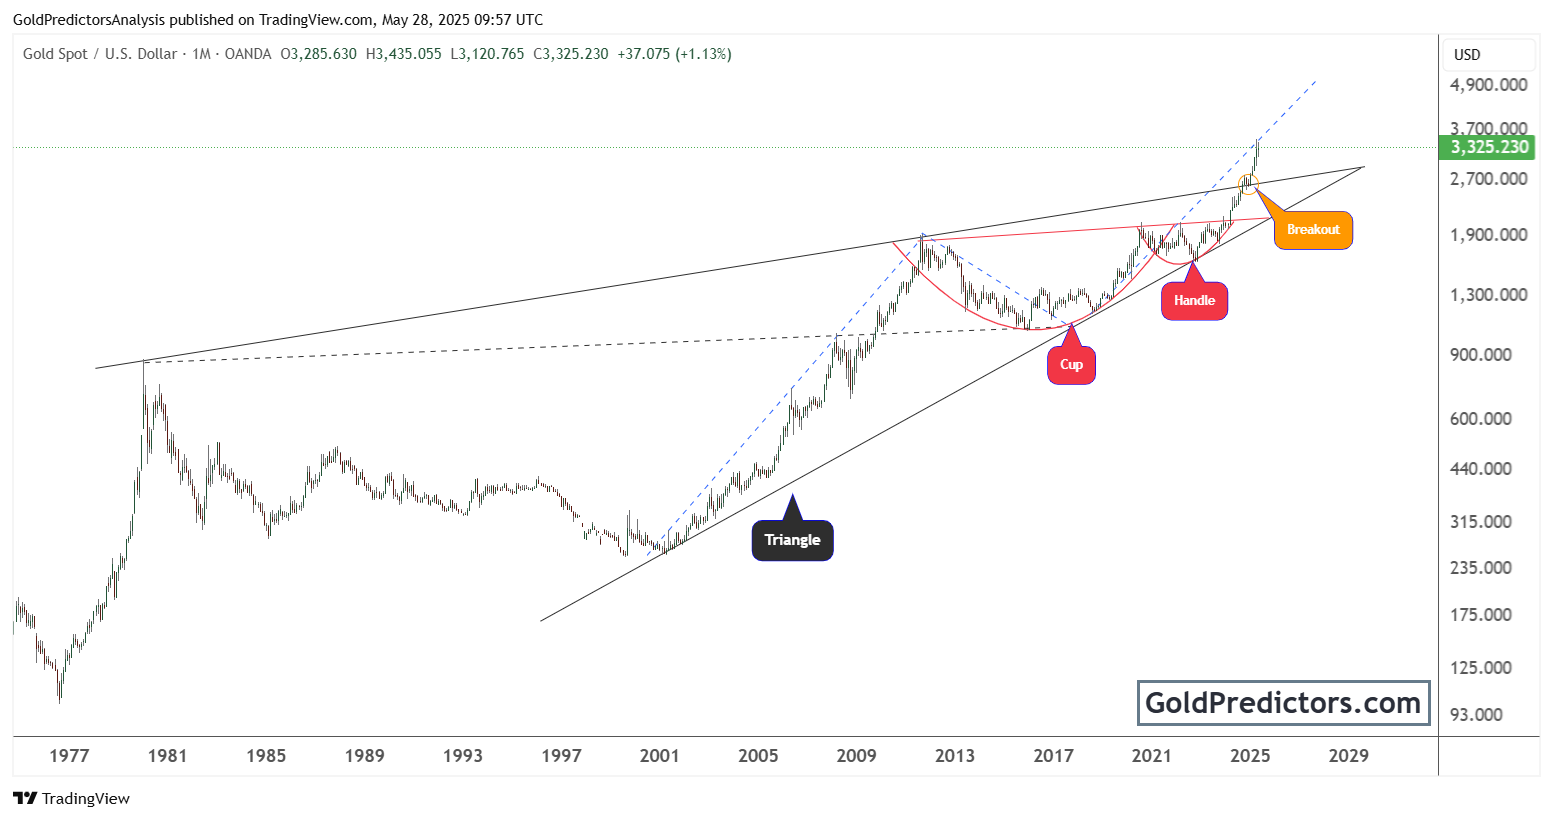
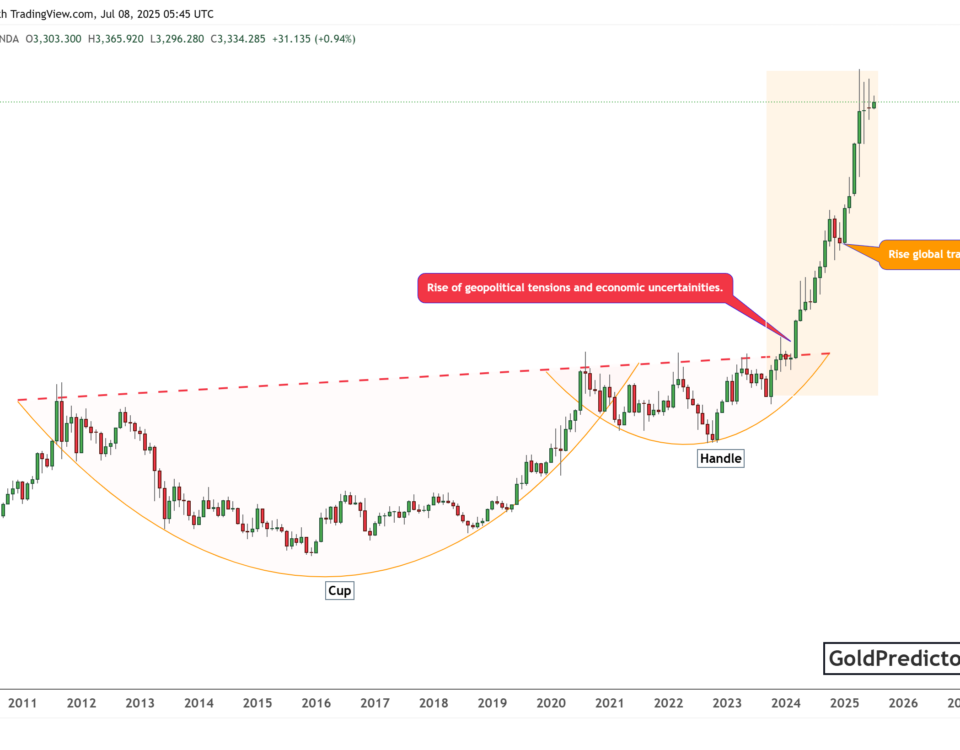
The “Cup” pattern developed over a prolonged period from 2011 to 2020, followed by the formation of a smaller “Handle” between 2020 and 2023. The breakout above the red neckline occurred in early 2024, confirming the bullish pattern. After the breakout, gold surged above historical resistance levels and is now in price discovery mode.
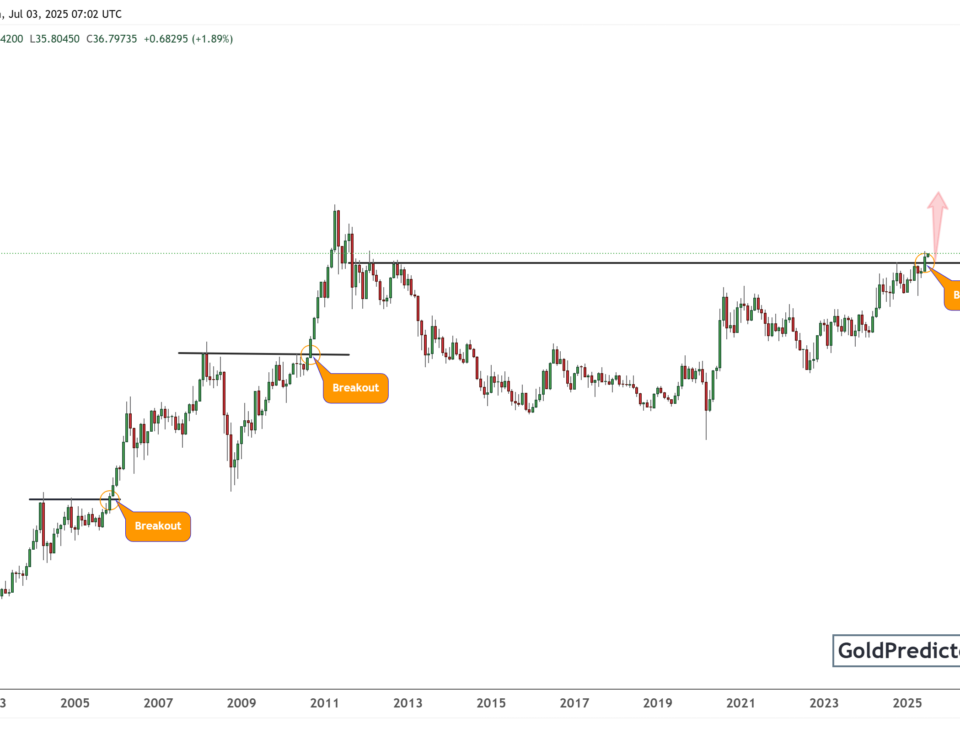
The Breakout Zone, highlighted in orange, shows where gold decisively moved above multi-decade resistance. This confirms the start of a new long-term trend. Additionally, earlier triangle patterns from the 2000s and 2010s laid the foundation for this explosive move. Gold is following a steep, rising trend line, suggesting increasing momentum.
The price currently trades above $3,300 and looks for further upside. A break above $3,500 will keep the bullish run towards the target of $4,000 in a few months.
Gold Price Discovery Continues as Technical and Historical Patterns Support Multi-Year Rally
Gold’s momentum remains firmly bullish in 2025. The short-term ascending channel provides strong support, helping prices rebound from dips and maintain an upward trajectory. The current price action signals buyers’ confidence and sets the stage for a possible move above $3,400.
From the long-term perspective, the confirmed Cup and Handle breakout marks the beginning of a powerful new bull cycle. Combined with the breakout above multi-decade resistance, this pattern points to significant upside potential towards the $6,000 and $8,000 regions.
Gold Predictors Premium Membership
Get exclusive short-term and swing trade ideas with precise entry levels, stop-loss, and target prices, including justification and analysis — all delivered directly via WhatsApp.
Our premium service includes deep technical analysis on gold and silver markets. We cover cycle analysis, price forecasting, and key timing levels.
Members also receive a weekly market letter with detailed analysis, commentary from our Chief Analyst, including actionable insights, trade timing, and direction forecasts for gold and silver.
Stay ahead of the market — join our premium community today.