


Why Gold May Reach $4,000: Bullish Breakout Signals Long-Term Rally
Gold has confirmed a long-term bullish trend with a breakout from a classic cup-and-handle pattern. This formation developed over more than a decade and signaled strength as gold broke above the key $2,075 resistance level in early 2024. Prices surged above $3,000 and are now trading above $3,250. Strong support has formed near $2,000 and $3,000. Technical and fundamental factors support these bullish patterns. The fundamental factors include inflation and central bank demand, which suggests continued gains through 2025.
Gold Cup and Handle Pattern Signals Continued Rally
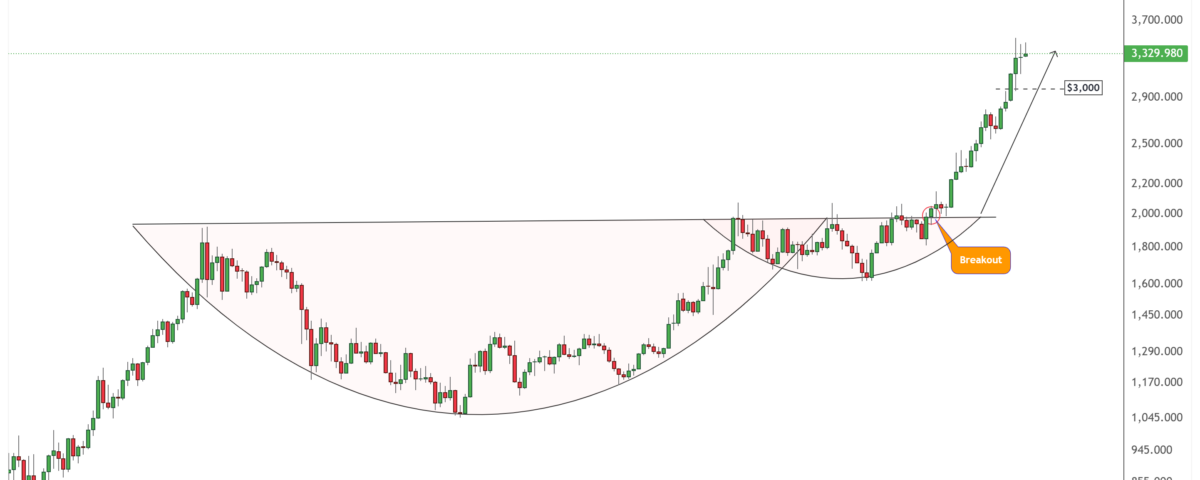
The gold chart below illustrates a classic “cup and handle” pattern that developed over more than a decade. This pattern is one of the most reliable bullish technical indicators. The left side of the cup formed between 2011 and 2015 as gold prices corrected from their highs. From 2016 onward, prices gradually recovered, completing the rounded base. The handle consolidation occurred from 2020 to late 2023, leading to a significant breakout in early 2024.
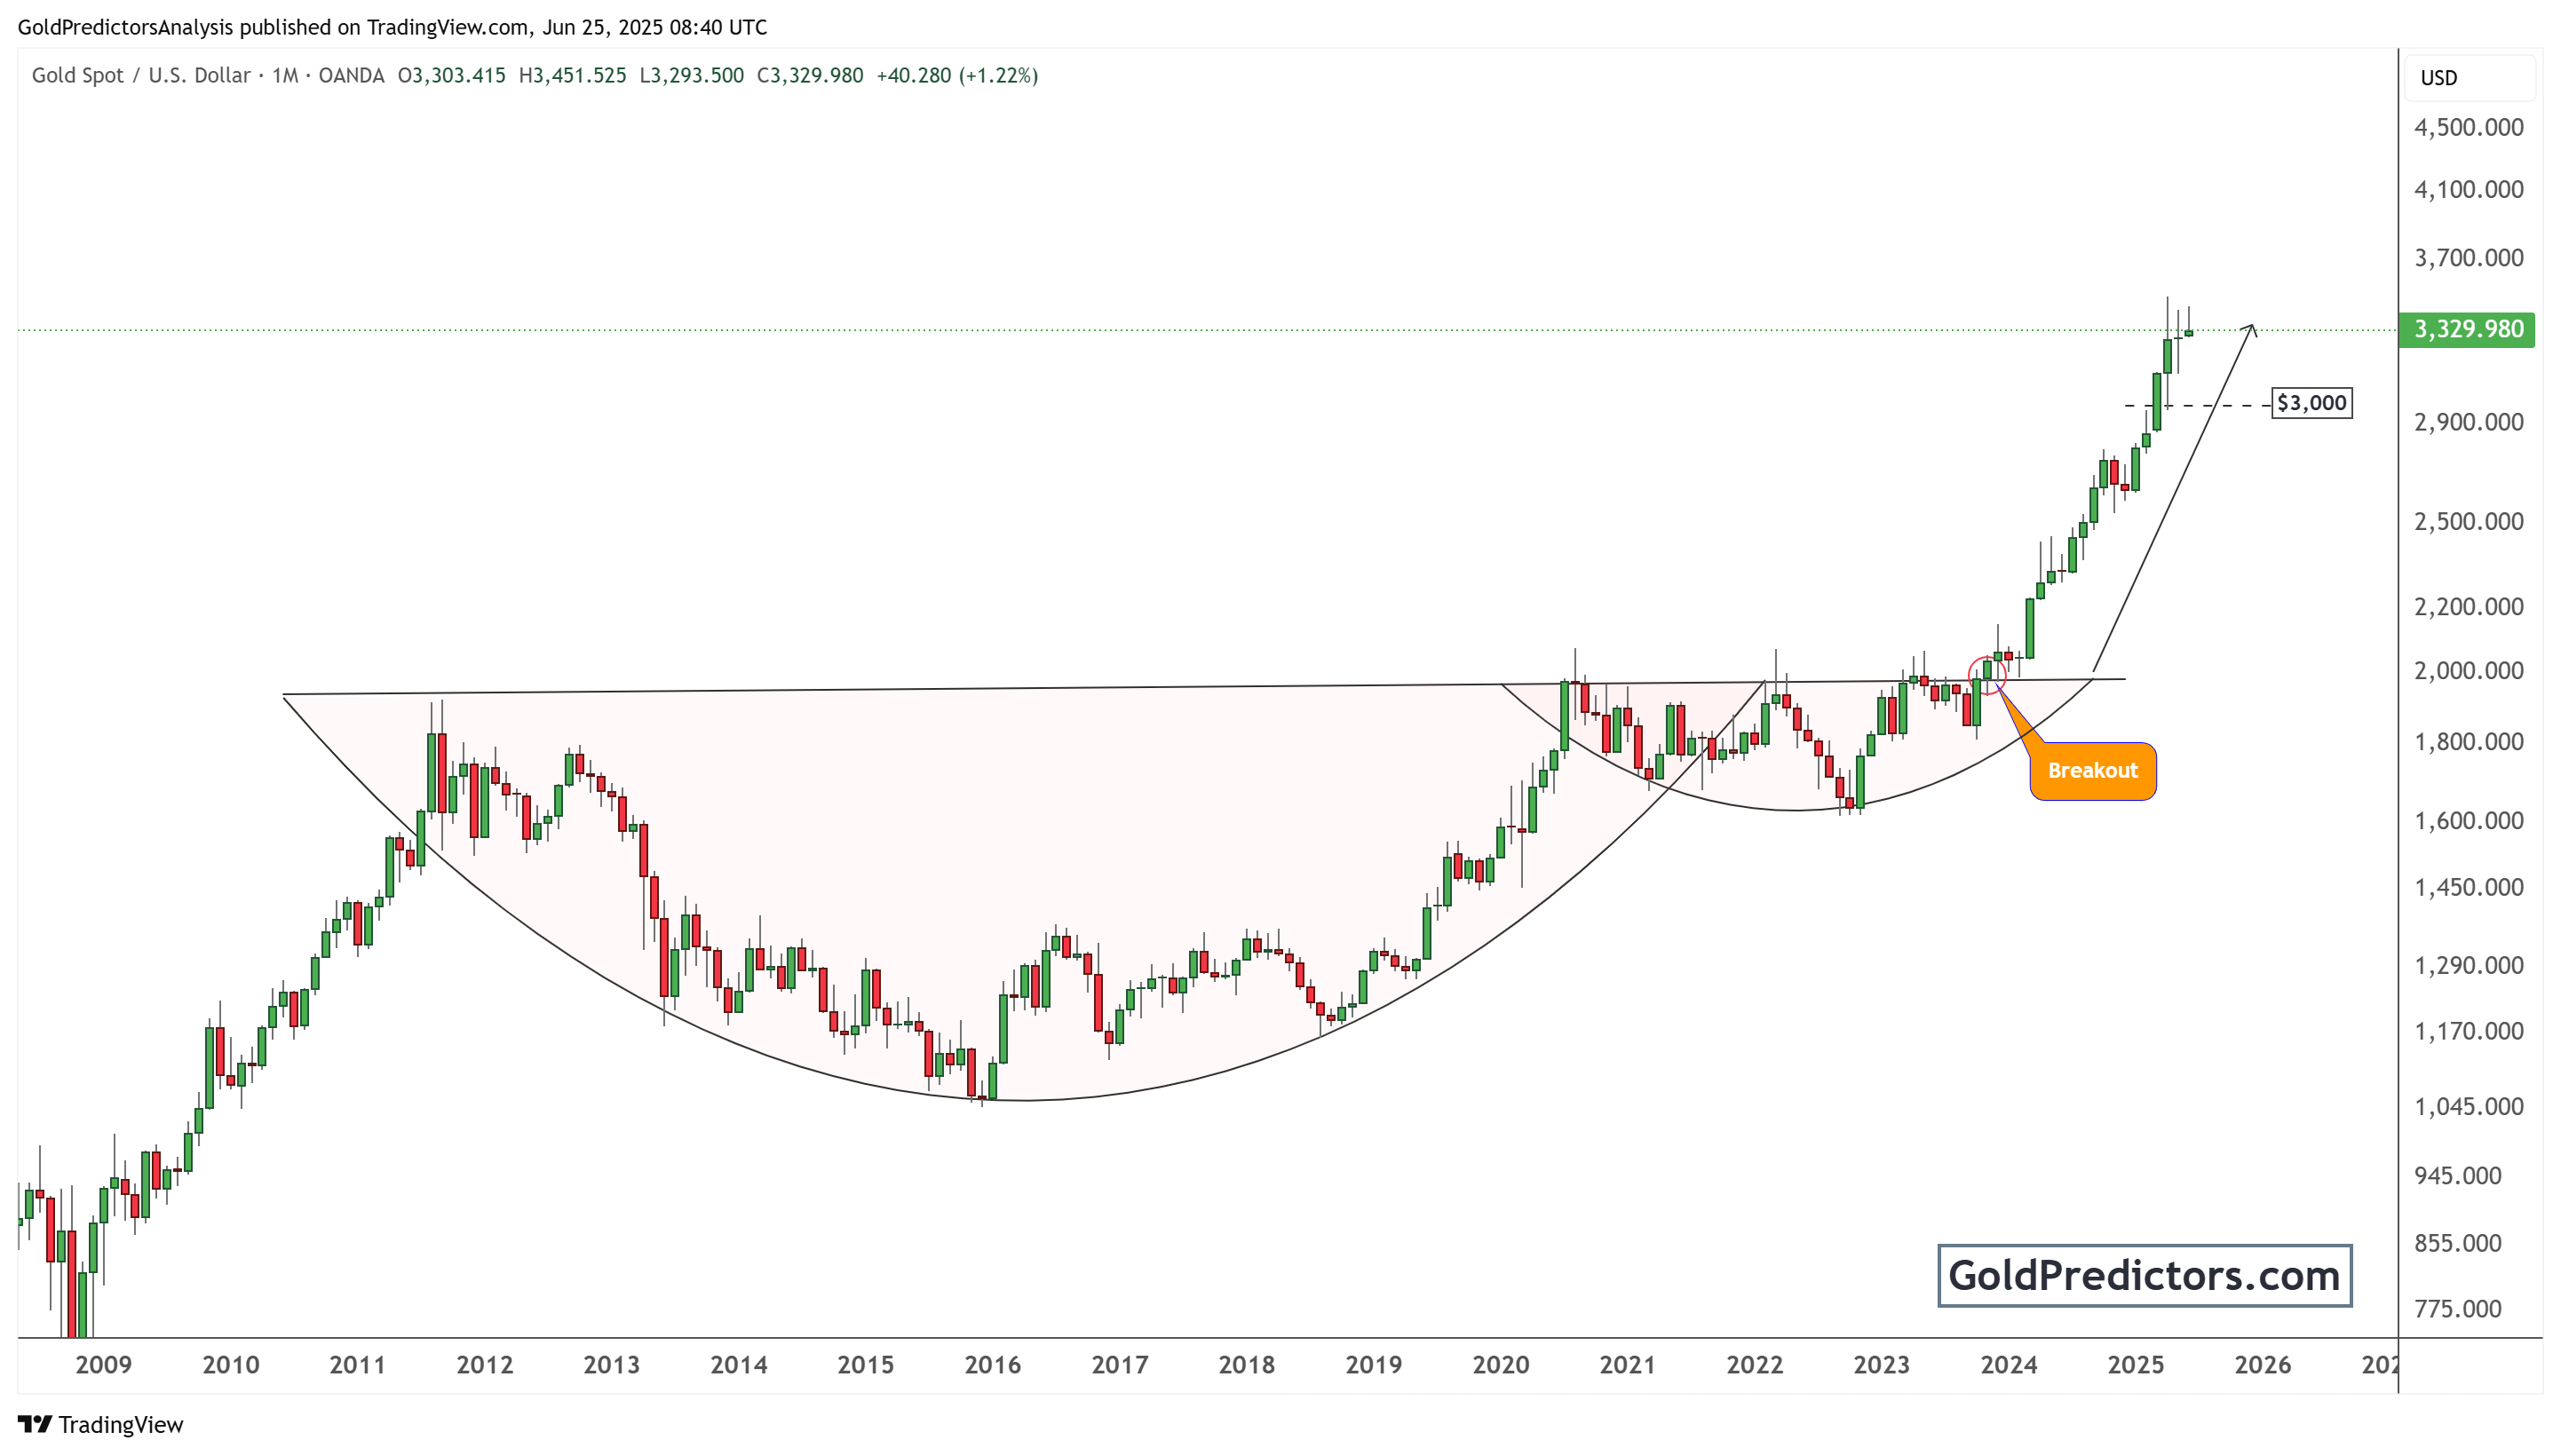
This breakout occurred above the $2,075 level, a central horizontal resistance line that had capped prices for years. The breakout marked the end of the consolidation phase and signaled the beginning of a new uptrend. As the chart indicates, gold prices accelerated rapidly after this move, breaking the $3,000 mark and currently trading around $3,330. The breakout zone near $2,000 now acts as a significant support level.
The measured move from this cup and handle pattern suggests a long-term price target that could reach $4,000 or higher. This projection is derived by measuring the depth of the cup and adding it to the breakout level. With strong bullish momentum and historical precedent, the pattern supports continued appreciation in gold prices through 2025 and beyond.
Gold Price Surges Above $3,000 and Targets $4,000
The gold chart below clearly reinforces the breakout narrative. It zooms in on the more recent price structure. It shows a series of inverted cup-like patterns, also known as mini bases, that formed during the 2021–2023 consolidation period. These structures exhibit consistent accumulation, followed by higher lows, and culminate in a decisive breakout above the $2,075 resistance level.
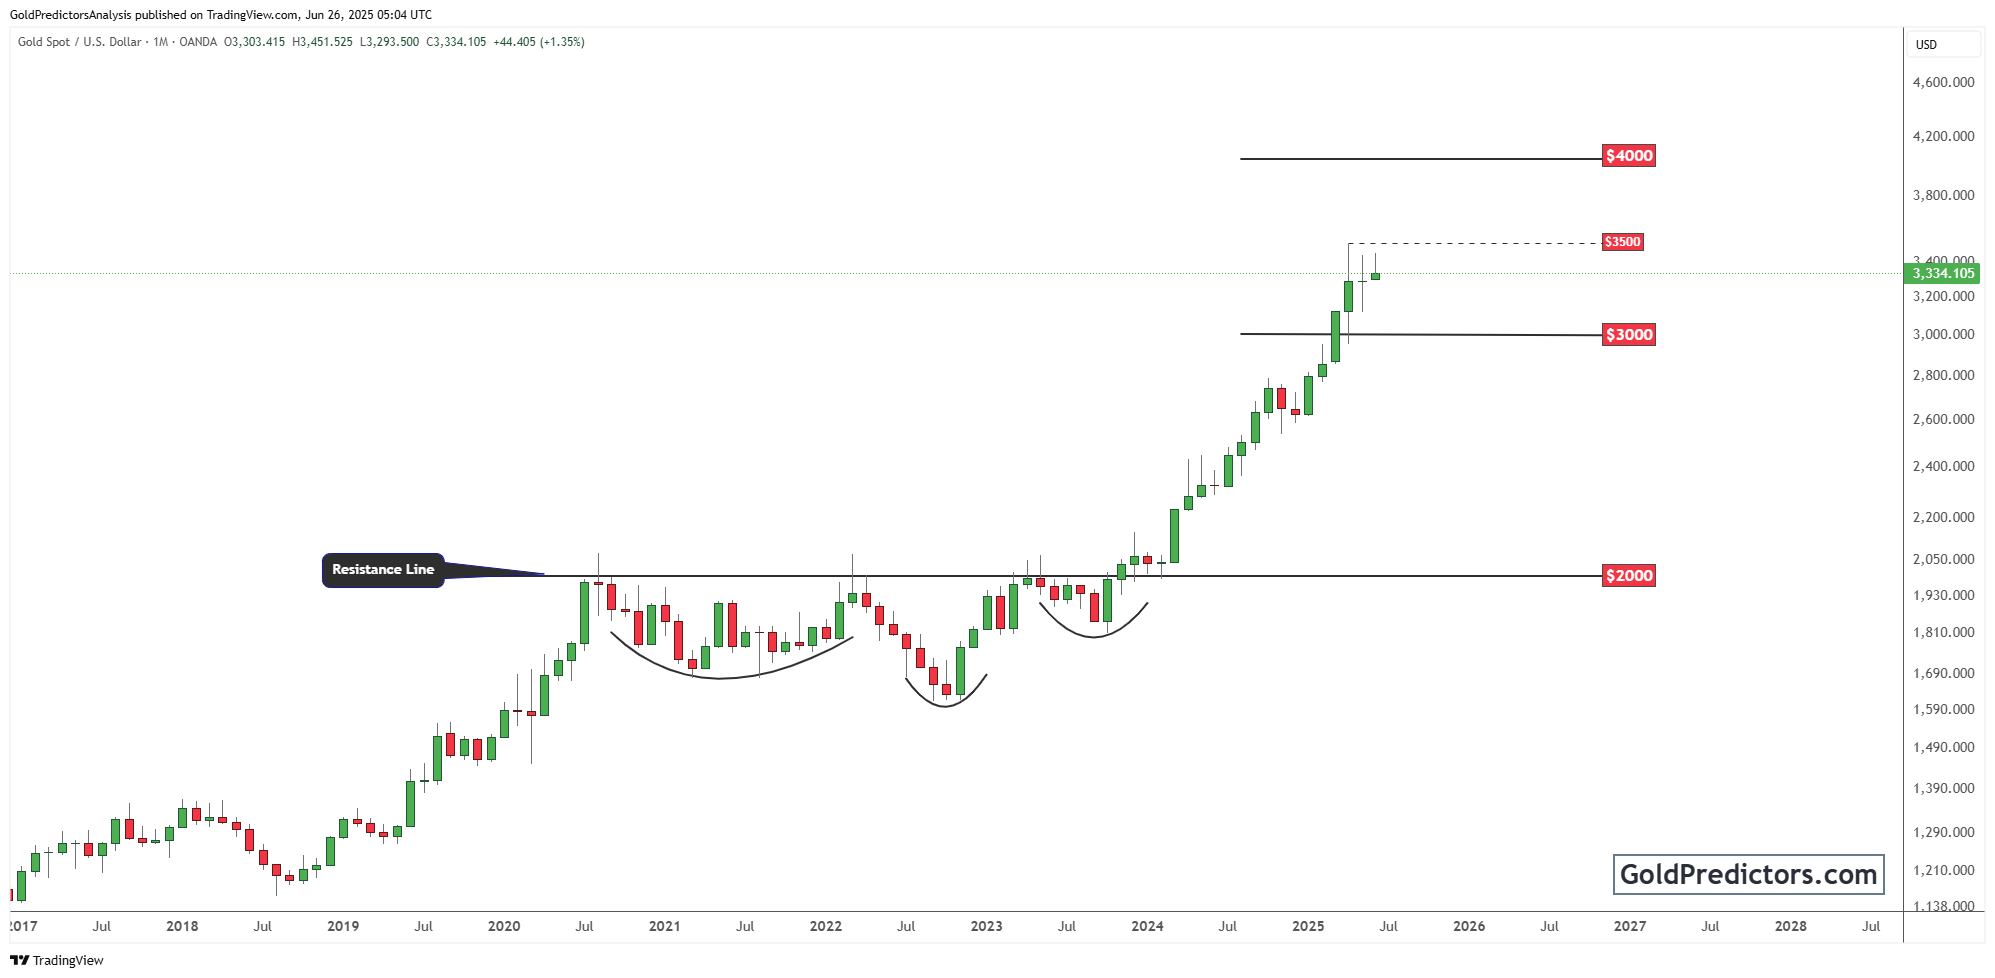
Following the breakout, gold prices surged above $3,000 and reached $3,300 by mid-2025. The price has hit the projected resistance zone at $3,500. The chart also outlines future bullish targets, marking $4,000 as the next significant level. This level represents a psychological barrier and an extension of the current bullish trend.
Notably, previous resistance levels at $2,000 and $3,000 have now become strong support zones. These levels offer entry points for long-term investors who may have missed the initial breakout. The continuation pattern, coupled with substantial volume and momentum, suggests that the current rally is likely to remain sustainable.
In addition, the technical strength is supported by macroeconomic factors, such as central bank buying, persistent inflation, and geopolitical uncertainty. These fundamentals provide further fuel to the technical bullish breakout.
Conclusion: Gold Points to $4,000 Target
Gold’s price action in 2025 confirms a strong bullish breakout that has long-term implications. The cup and handle pattern, along with the breakout above the $2,075 resistance level, has set the stage for an extended rally. Prices have already surpassed $3,300 and hit the technical target of $3,500. If momentum persists, the $4,000 target is within reach.
Technical analysis indicates that support is now firmly established at $3,000 and $2,000, reinforcing the bullish structure. As global investors continue to seek safe-haven assets, gold remains an attractive option. The charts provided clearly illustrate a multi-year bullish setup with more upside potential.
Investors should closely monitor gold’s movement around the $3,500 resistance level. A successful break above this level could accelerate the move toward $4,000. The consistent consolidation below $3,500 indicates the buildup of energy for the breakout above $3,500. With strong technical backing and supportive macro trends, gold’s long-term bull market appears far from over.
Gold Predictors Premium Membership
Get exclusive short-term and swing trade ideas with precise entry levels, stop-loss, and target prices, including justification and analysis — all delivered directly via WhatsApp.
Our premium service includes deep technical analysis on gold and silver markets. We cover cycle analysis, price forecasting, and key timing levels.
Members also receive a weekly market letter with detailed analysis, commentary from our Chief Analyst, including actionable insights, trade timing, and direction forecasts for gold and silver.
Stay ahead of the market — join our premium community today.


