


Why Gold Continues to Outperform the US Dollar in the Long Run
The US Dollar has been in a long-term decline against gold. The removal of the gold standard triggered a sharp drop, leading to continued devaluation. Over time, the dollar formed consolidation patterns before breaking lower again. Recent price action confirms the ongoing weakness of the dollar. Meanwhile, gold remains strong, moving in an upward trend. Economic uncertainties and inflation concerns drive demand for gold as a safe-haven asset. Investors watch these trends as gold continues to hold its value against fiat currencies.
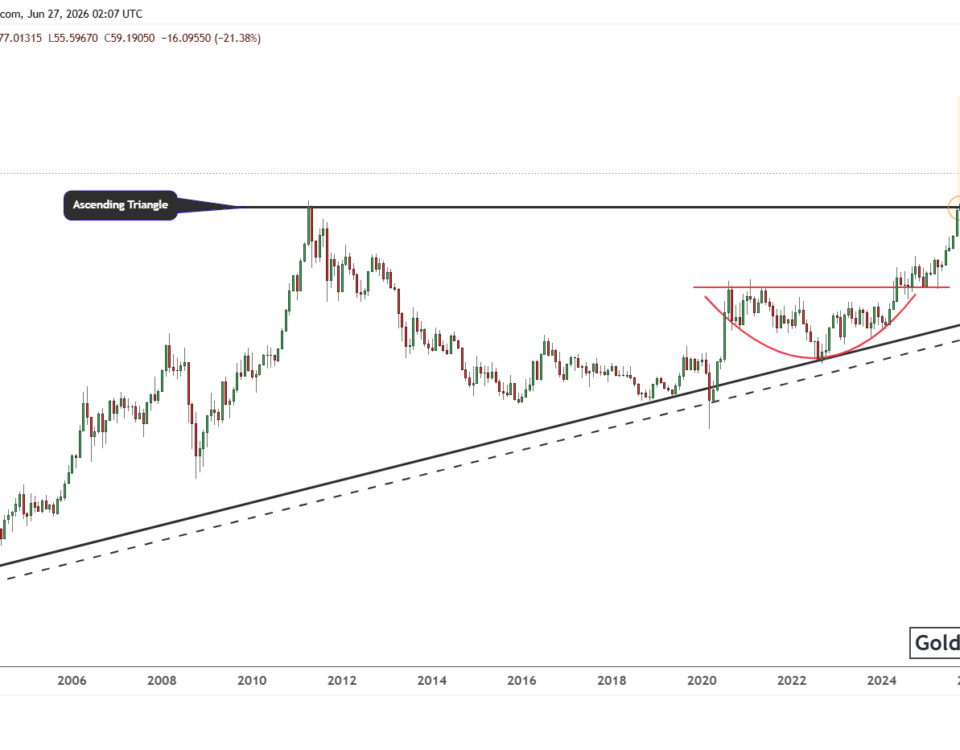
The Long-Term Decline of the US Dollar Against Gold
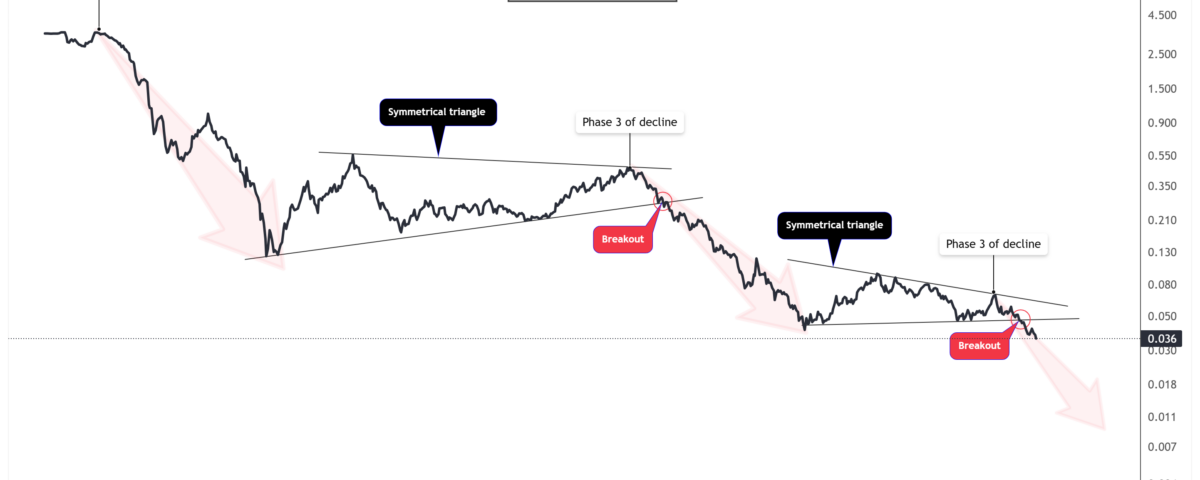
The historical chart of the US Dollar versus Gold reveals a long-term downtrend in the value of the US Dollar when measured against gold. The first phase of decline started in the 1970s, coinciding with the removal of the gold standard. This triggered a sharp drop in the dollar’s value against gold, as seen in the steep downward move in the chart.
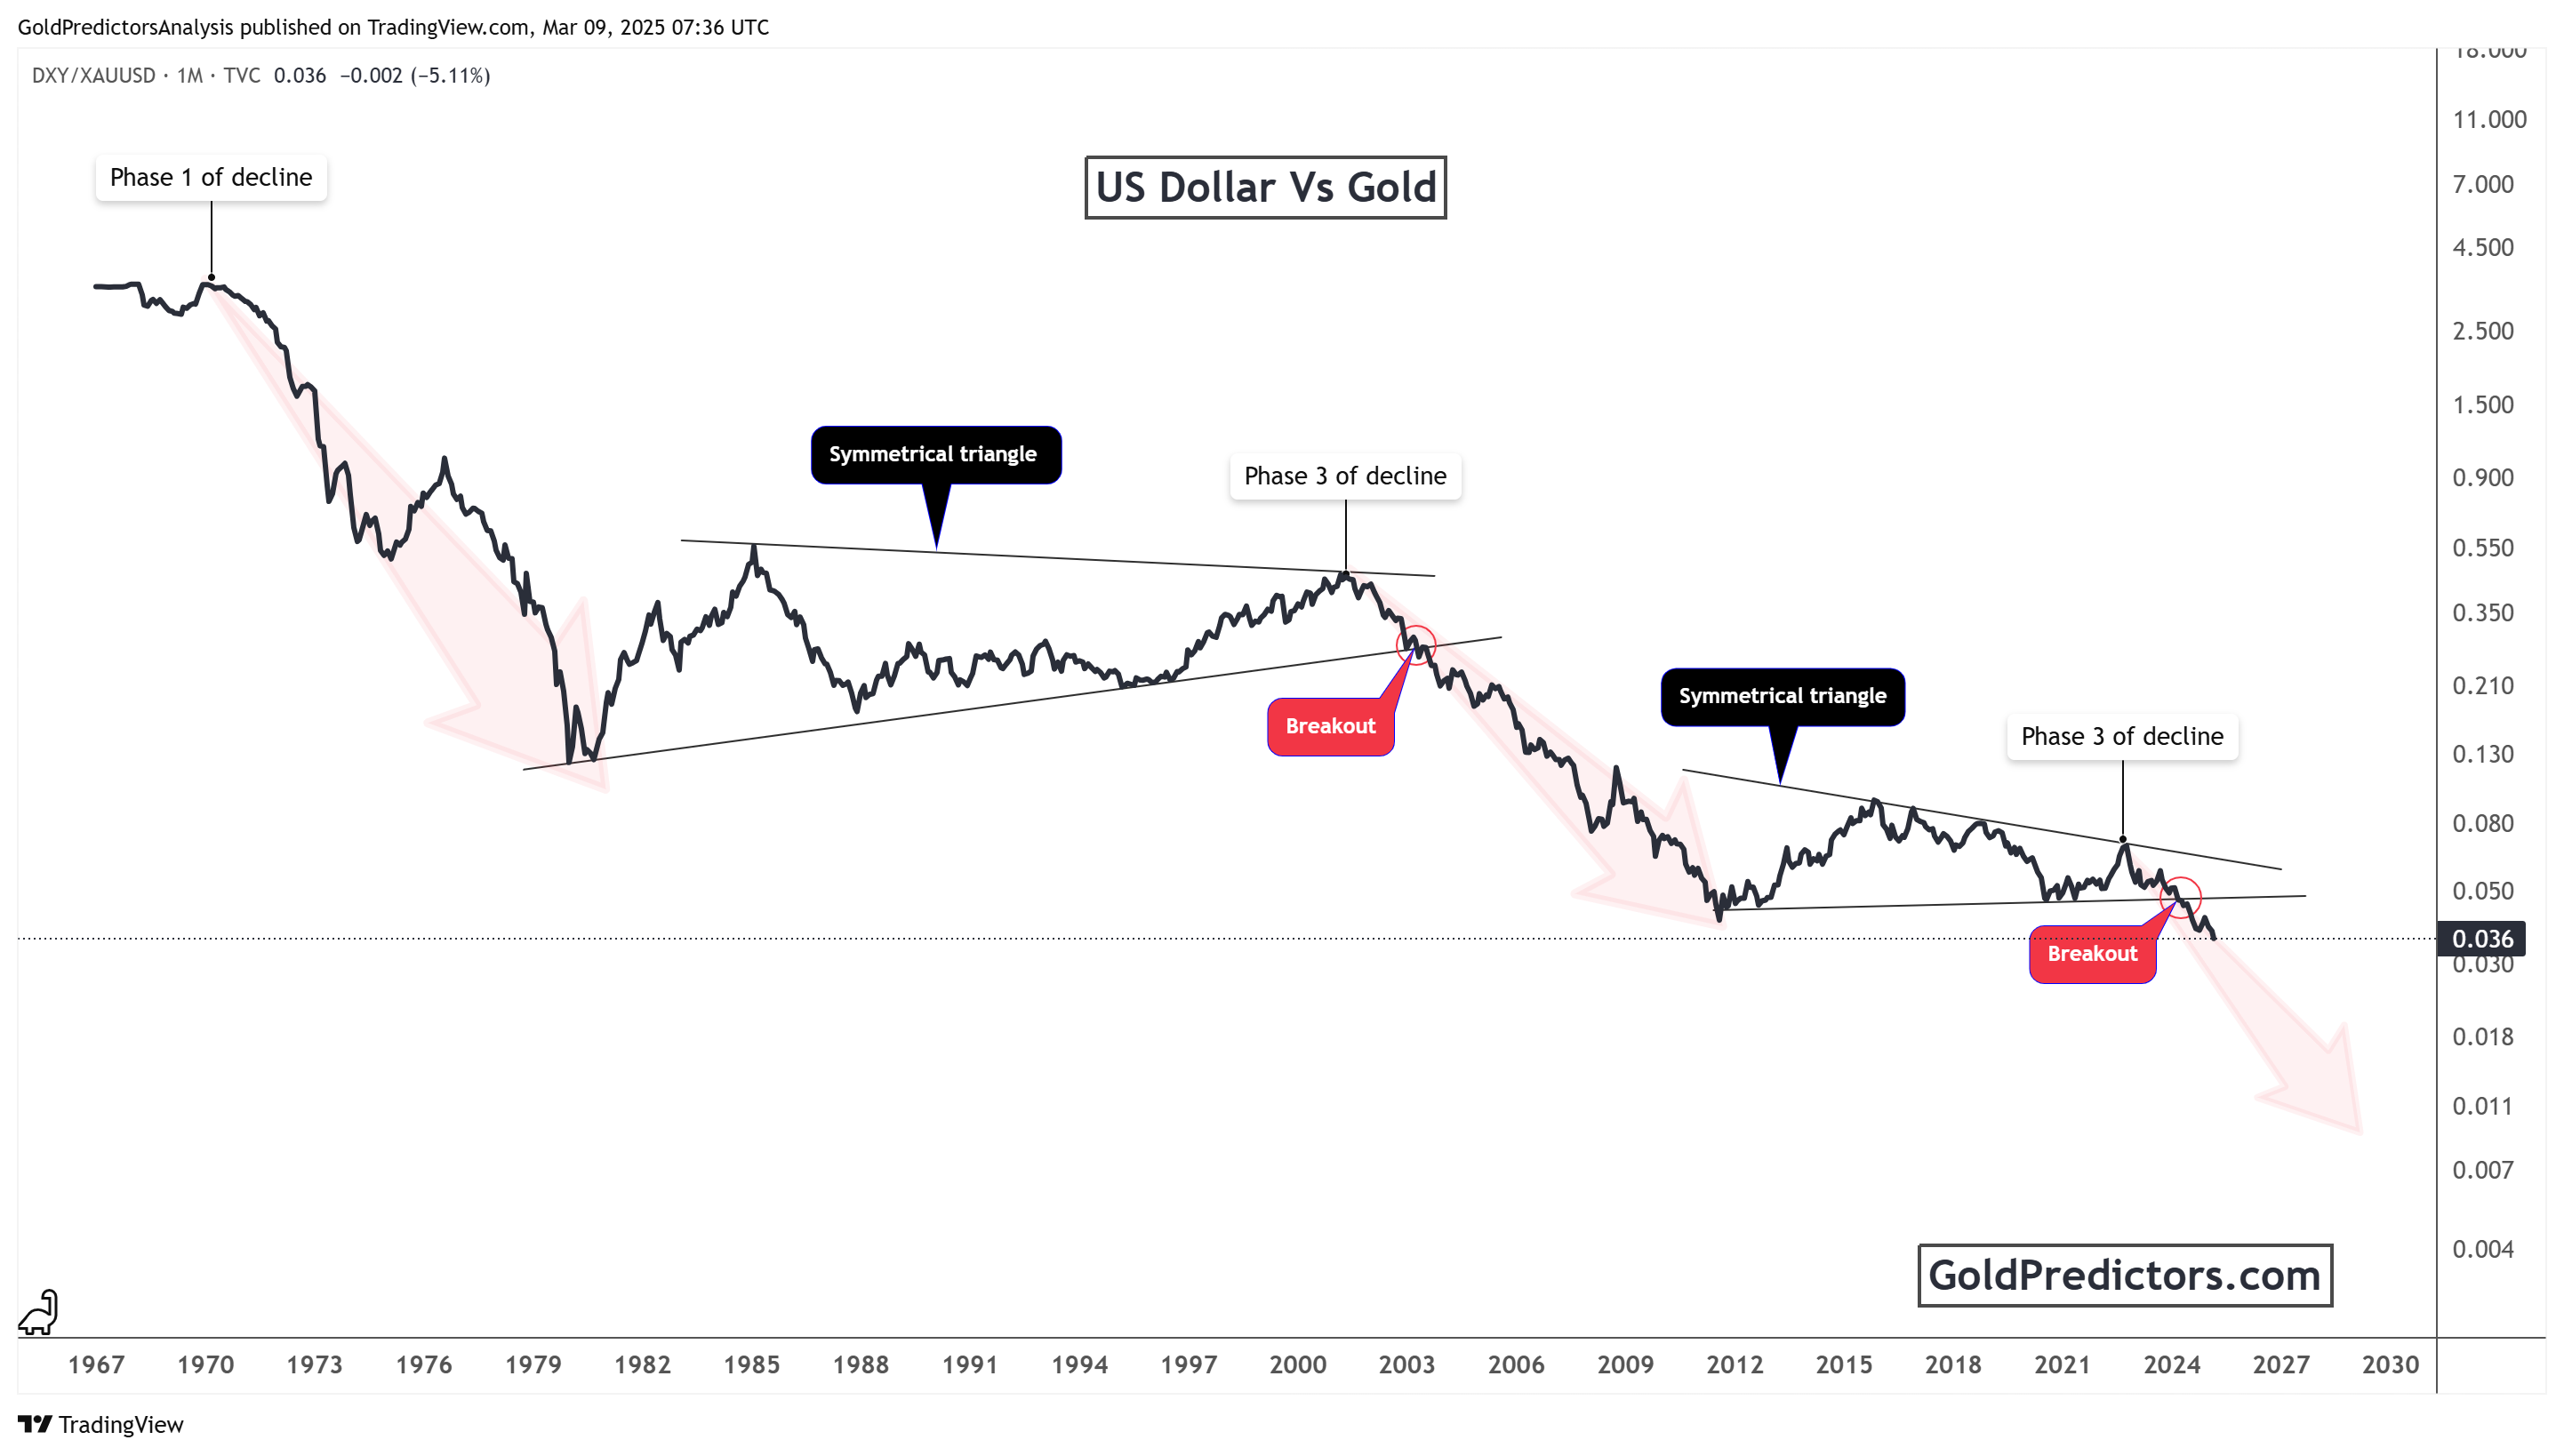
In the subsequent decades, the US Dollar formed a symmetrical triangle pattern. This consolidation phase indicated a temporary pause in the decline before breaking out to continue the downtrend. Around the early 2000s, another breakout occurred after a long consolidation. This marked the beginning of Phase 3 of decline, as labeled in the chart. The continued downward movement reflects the weakening purchasing power of the US Dollar against gold, a trend that has persisted over time.
The latest data suggests another symmetrical triangle formation, followed by a breakout to the downside. This signals the continuation of the long-term trend, further confirming the bearish momentum in the US Dollar relative to gold. The historical price action suggests that the dollar’s devaluation may continue as global economic conditions evolve.
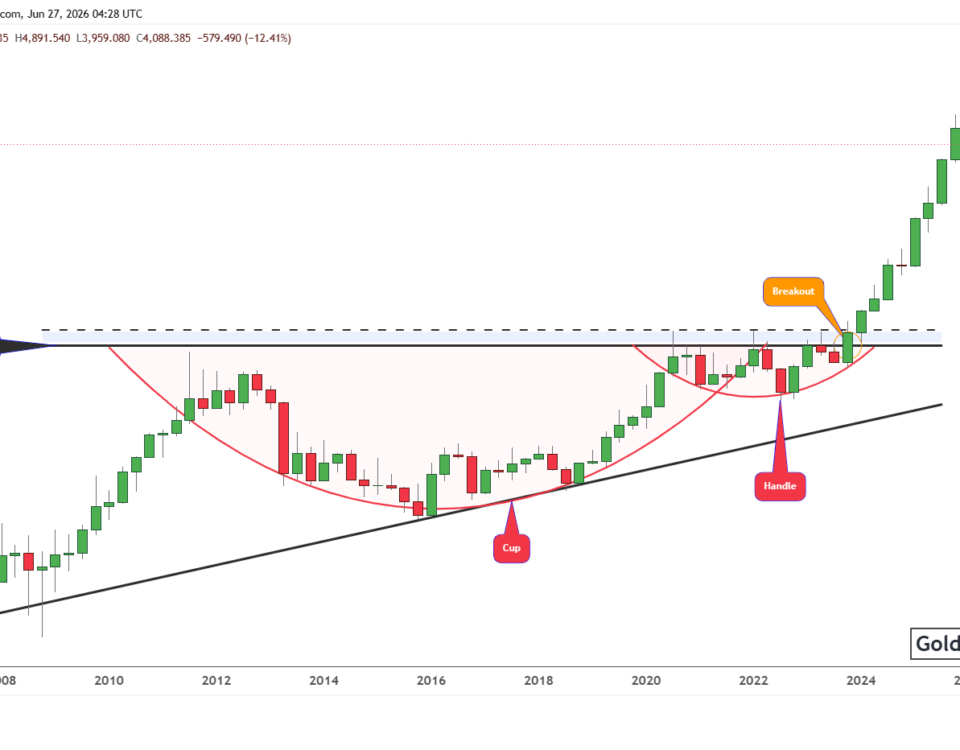
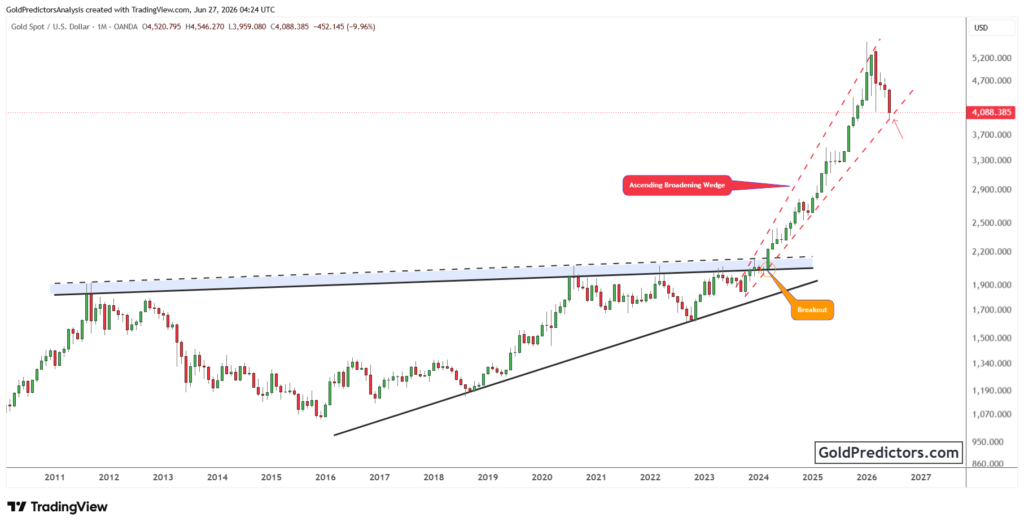
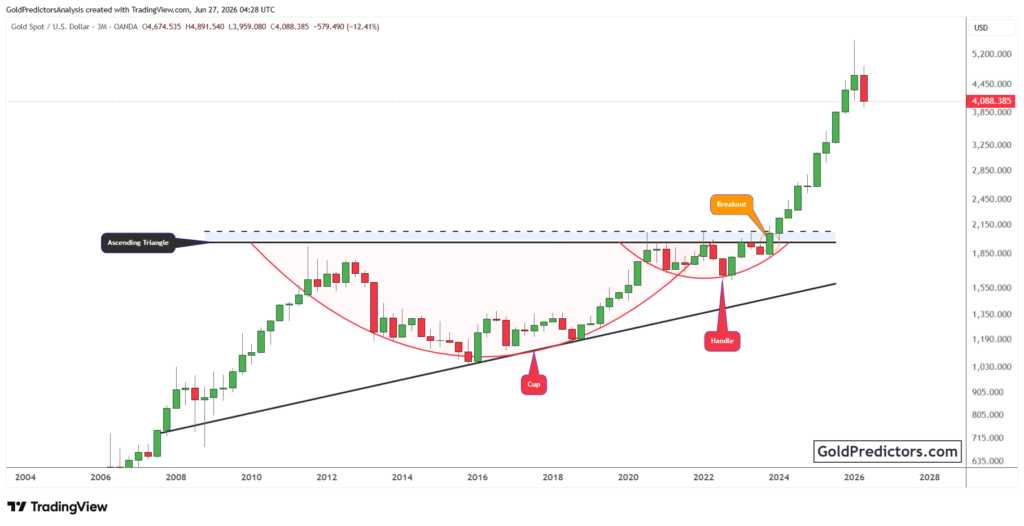
Gold’s Short-Term Bullish Trend Within an Ascending Channel
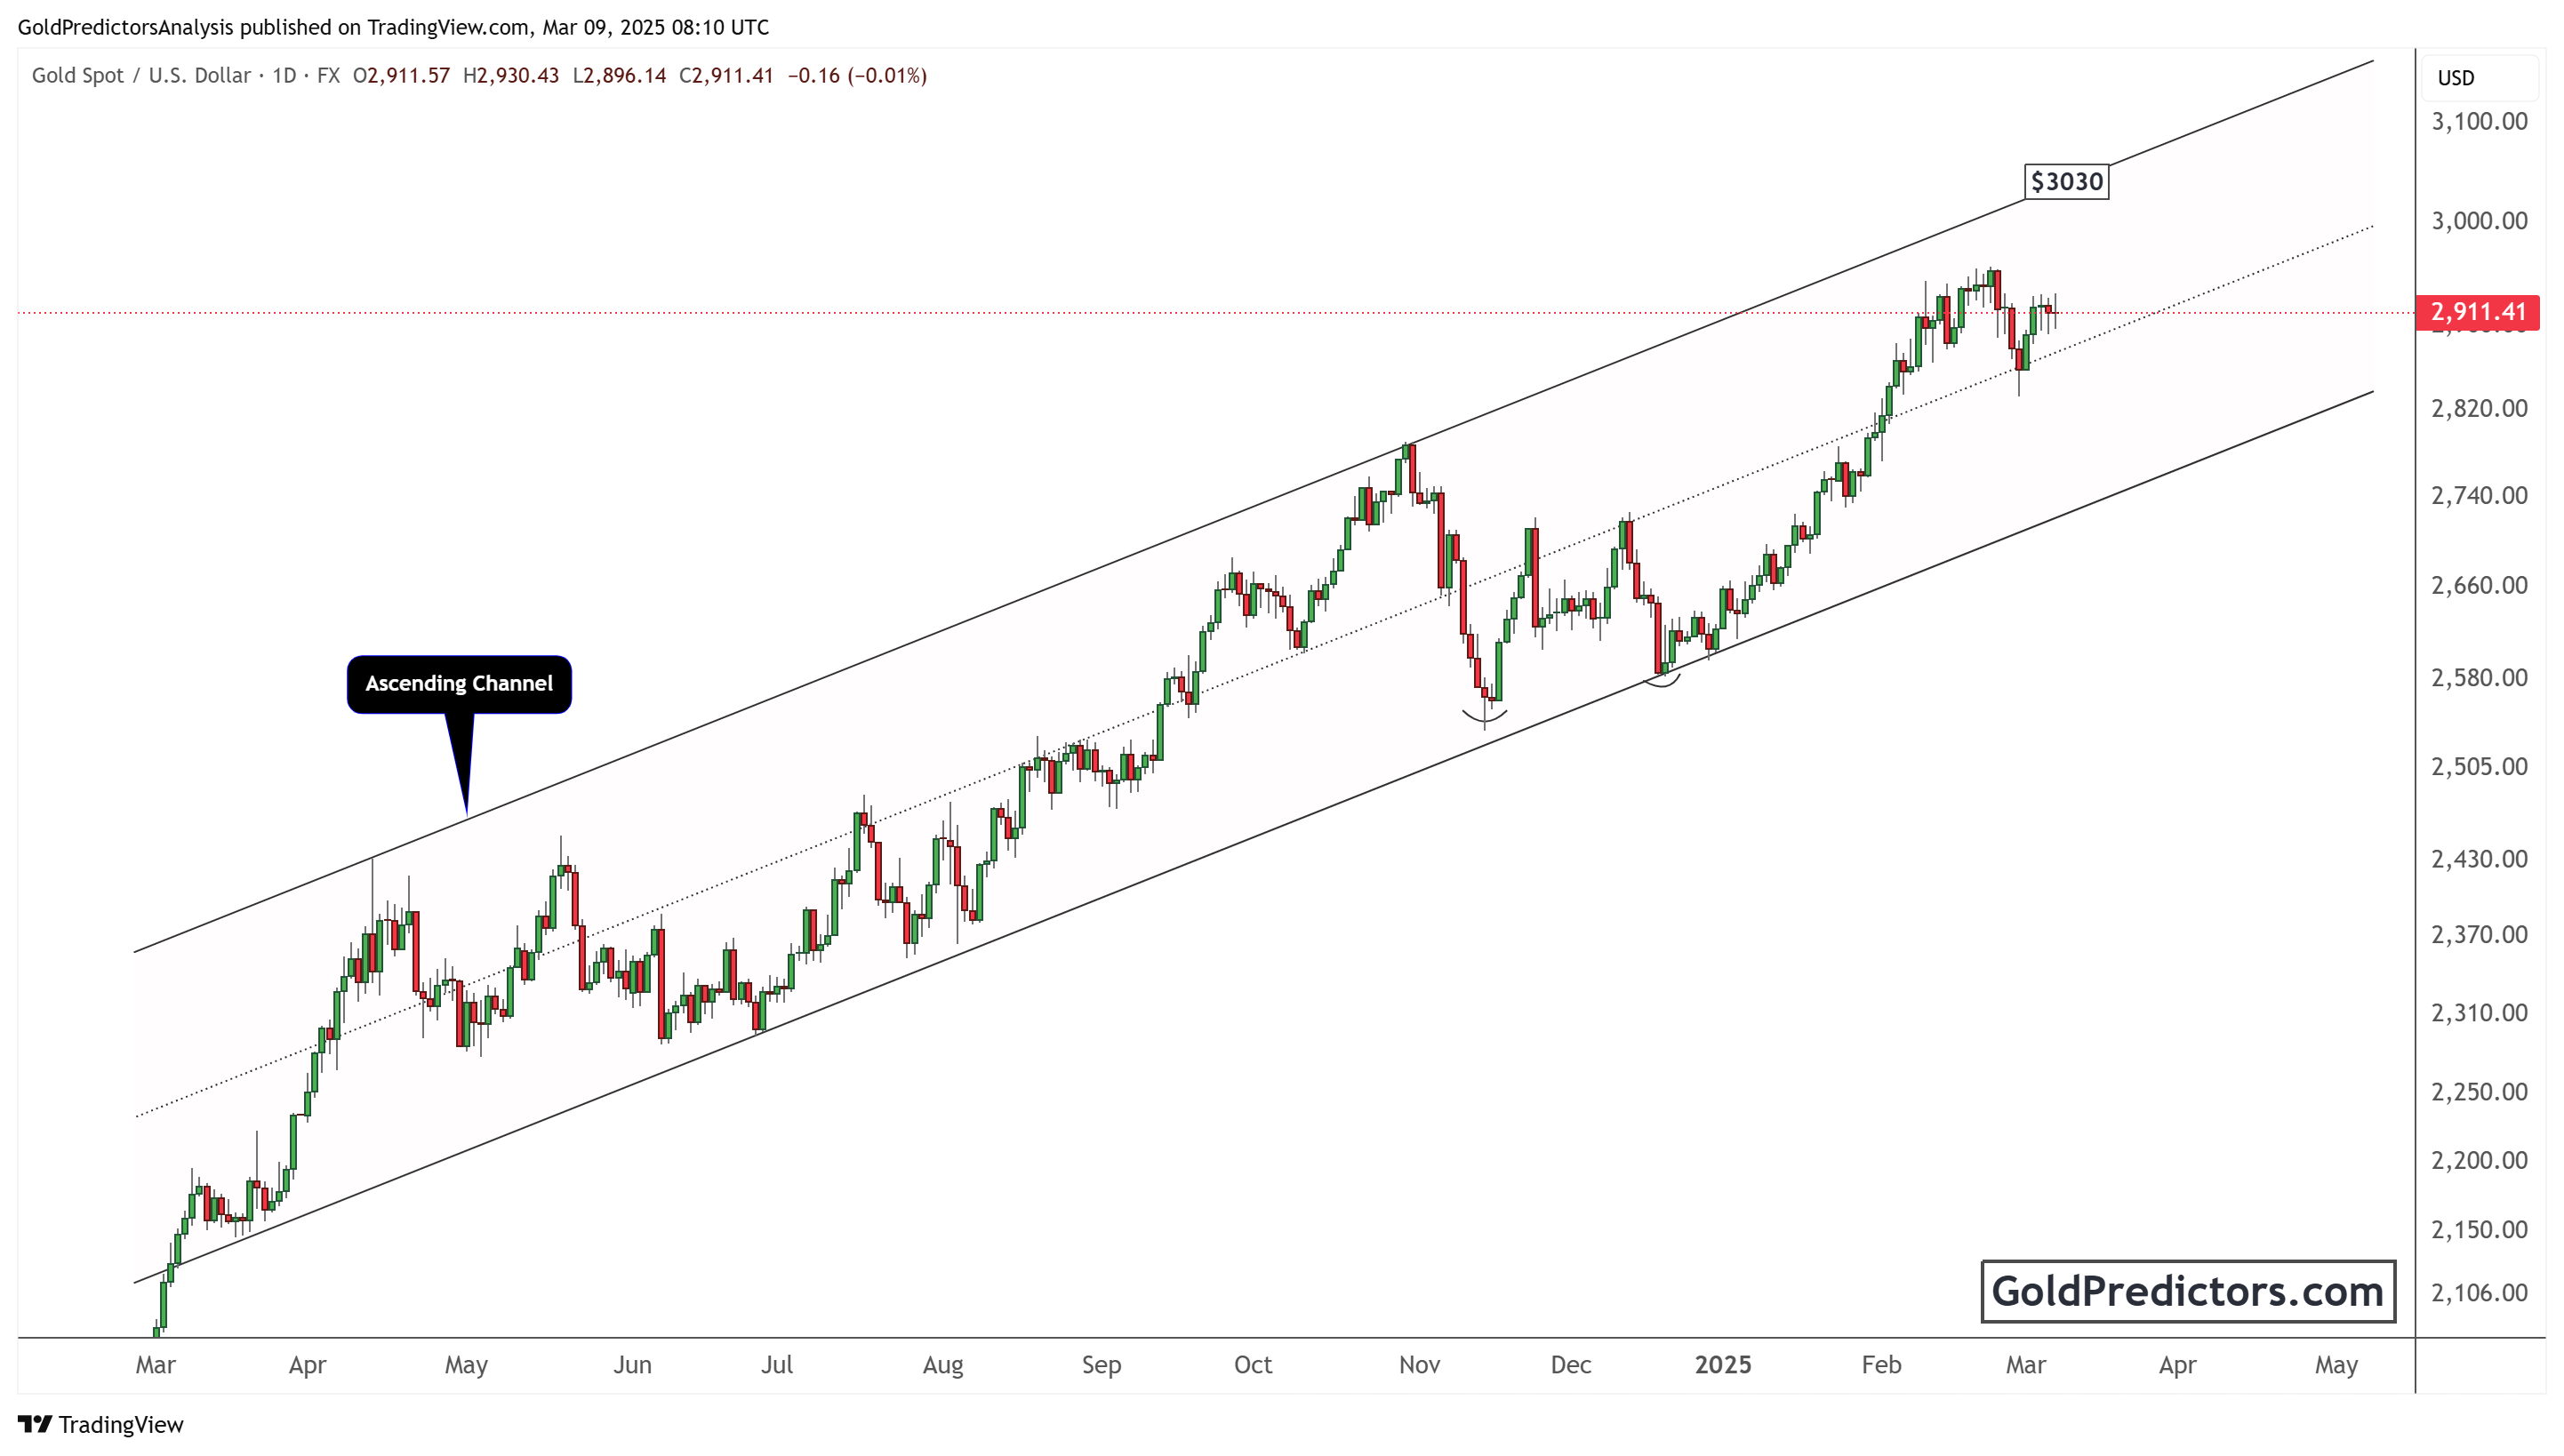
The gold price chart demonstrates a well-defined ascending channel, indicating a strong bullish trend. Gold has consistently moved within this channel, making higher highs and lows. This pattern reflects sustained demand for gold amid global economic uncertainties.
The recent price action bounces from the channel’s lower boundary, indicating strong support at key levels. Gold’s price has continued to rally, approaching the upper resistance of the channel. The projected price target of $3,030 suggests further upside potential if the bullish momentum persists. A price correction back to the $2,800 zone may lead to another rally to $3,200.
Several macroeconomic factors drive gold’s upward trend. Inflation concerns, central bank policies, and geopolitical uncertainties increase demand for gold as a safe-haven asset. The persistent devaluation of fiat currencies, as indicated in the US Dollar versus Gold chart, further strengthens gold’s long-term bullish case.
Traders and investors should monitor the price action within the ascending channel. A breakout above the upper resistance level may trigger another strong rally. A breakdown below the lower trendline could indicate a short-term correction. However, the trend remains bullish, reinforcing the positive outlook for gold.
Conclusion: Gold Remains a Strong Hedge Against the Declining Dollar
The technical analysis of the US Dollar versus Gold and the gold price chart highlights a crucial market trend. The US Dollar has been in a long-term decline against gold, with repeated symmetrical triangle breakdowns confirming its weakness. On the other hand, gold has maintained a strong bullish trend within an ascending channel, signaling continued demand.
As economic uncertainties persist, gold remains an attractive hedge against currency devaluation. The price action suggests that gold could reach new highs, with $3,030 as a potential target in the near term. Investors should closely follow technical patterns and macroeconomic developments to capitalize on gold’s strength.
In conclusion, the historical trend of the weakening US Dollar versus Gold supports the case for long-term gold investment. Whether as a hedge against inflation or as a safe-haven asset, gold continues to outperform fiat currencies, making it a valuable component in diversified portfolios.
To receive gold and silver trading signals and premium updates, please subscribe here.