


US Dollar Remains Under Pressure
The US dollar remains under pressure, but it is now trading in the most important zone. If the US dollar breaks through this area on monthly charts, a flush could occur in the coming months. For a long time, we’ve been forecasting a dollar flush, and this is the area to watch for breakdown.
Highlights
- The US dollar has been under pressure and is currently trading at key long-term levels.
- According to our previous reports, the strongest currencies were the Canadian dollar, Australian dollar, and Euro.
- Our recommendations to go long in the AUDUSD, GBPNZD, and EURUSD have proven that the markets and instruments have boosted in recent weeks.
Weakest currency: USD
Strongest Currency: CAD, GBP
Best Instruments to Focus:
Long GBPUSD
Long AUDUSD
Short USDCAD
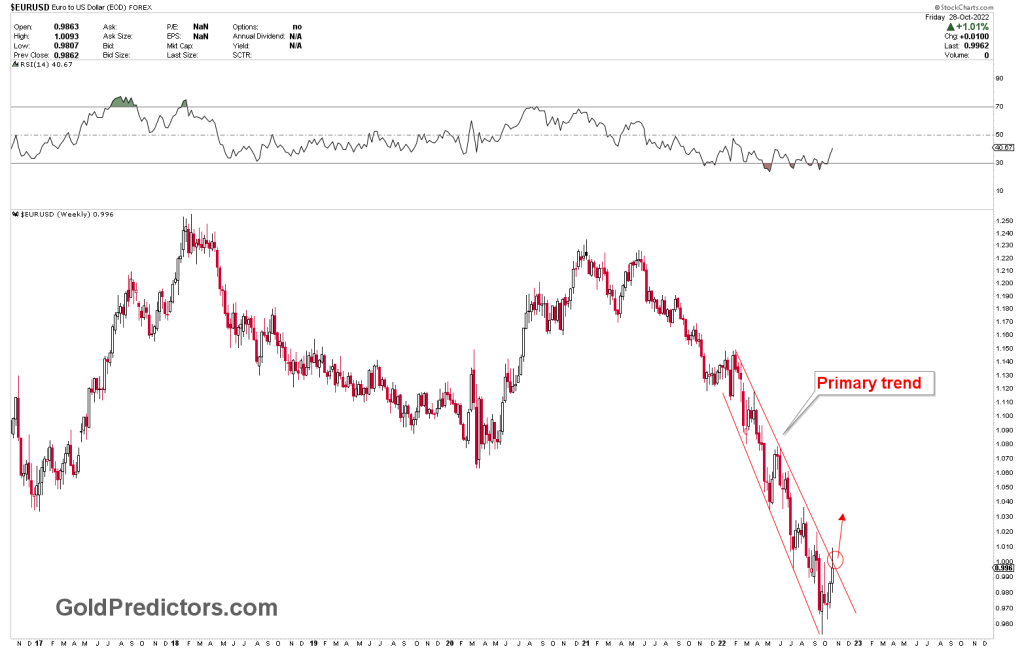
Long EURUSD
Dollar related pairs are trading at important juncture
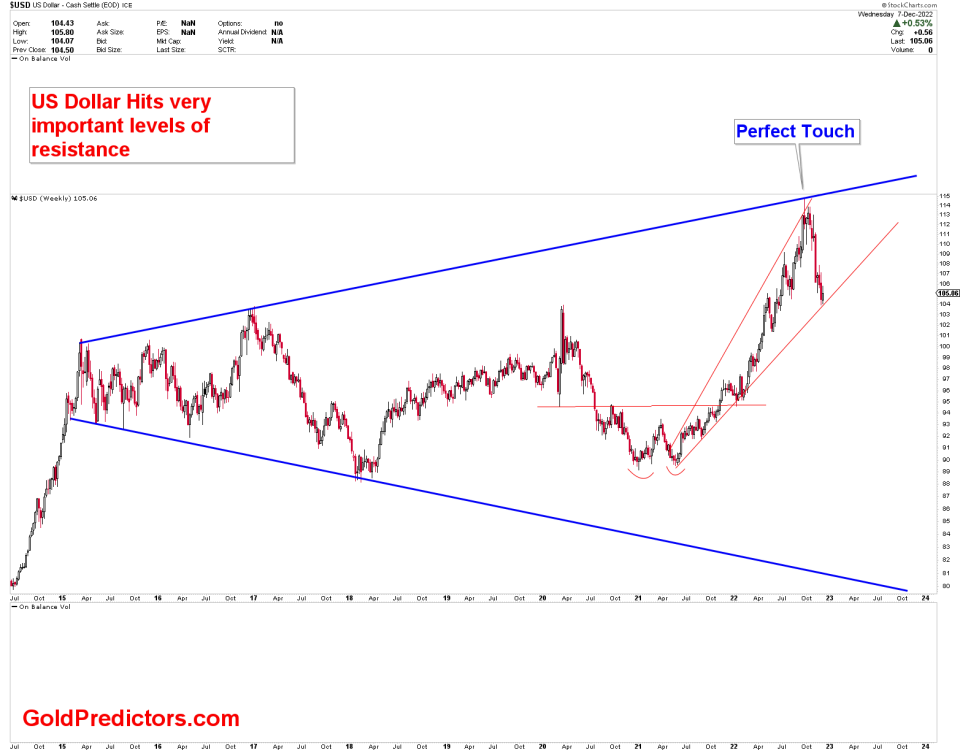
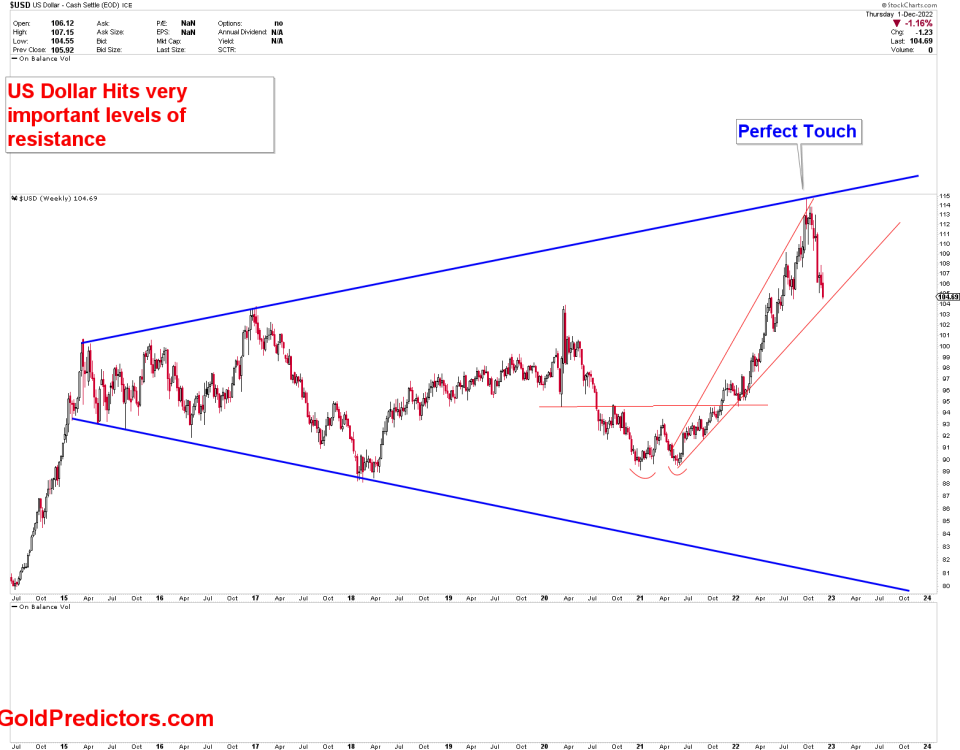
The US Dollar at Significant Levels.
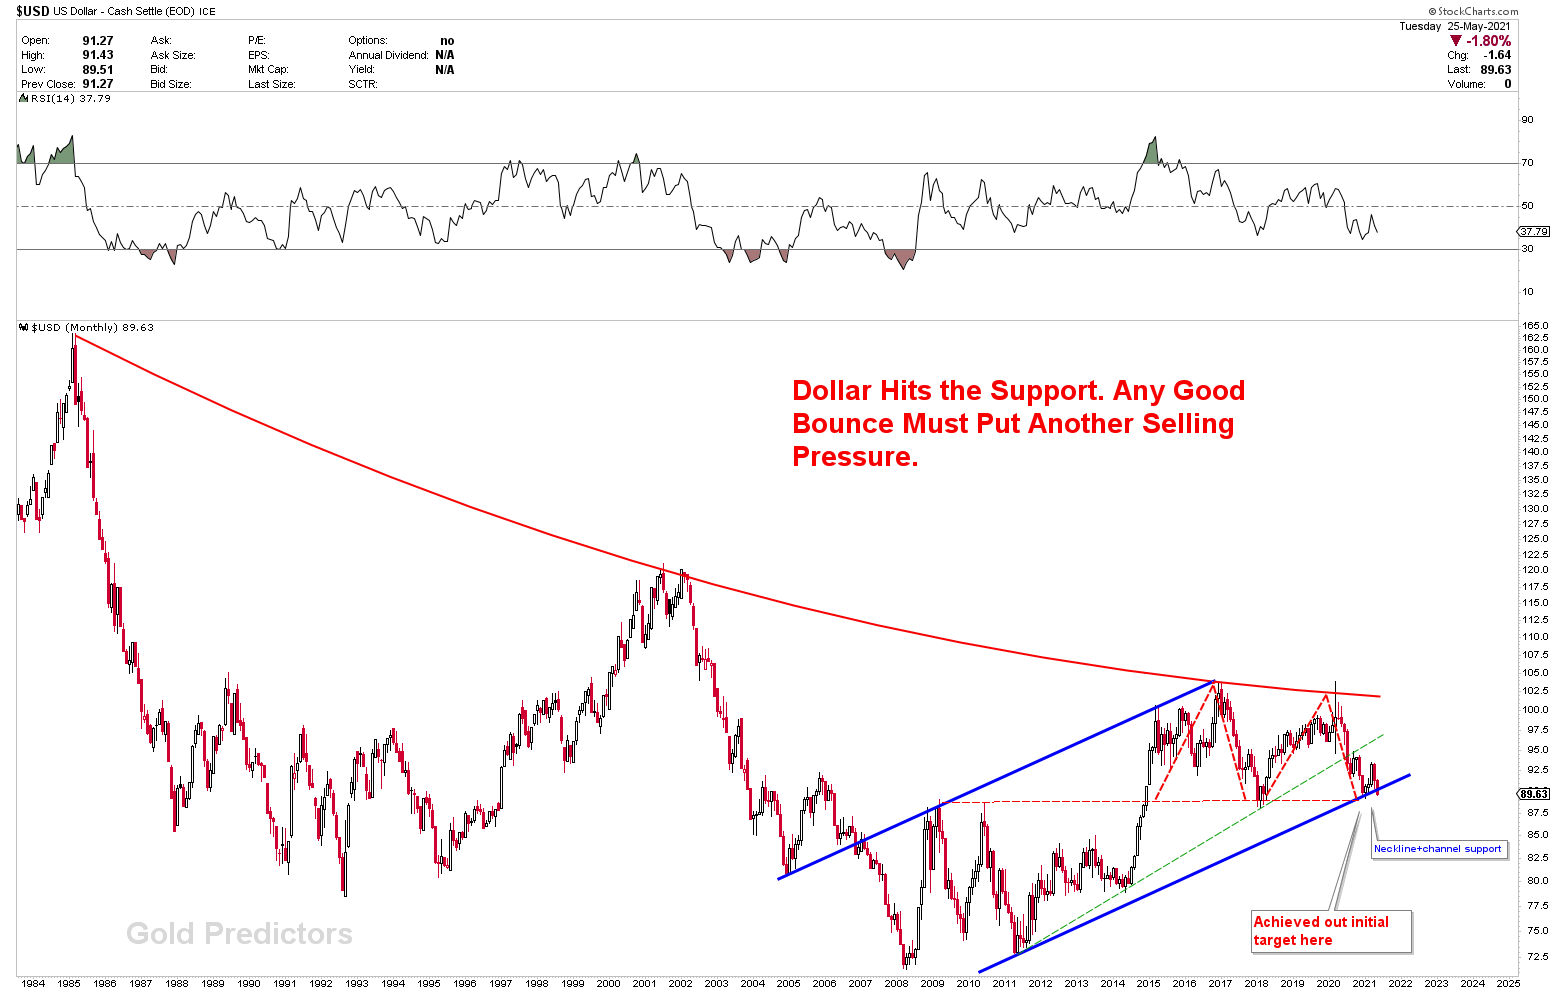
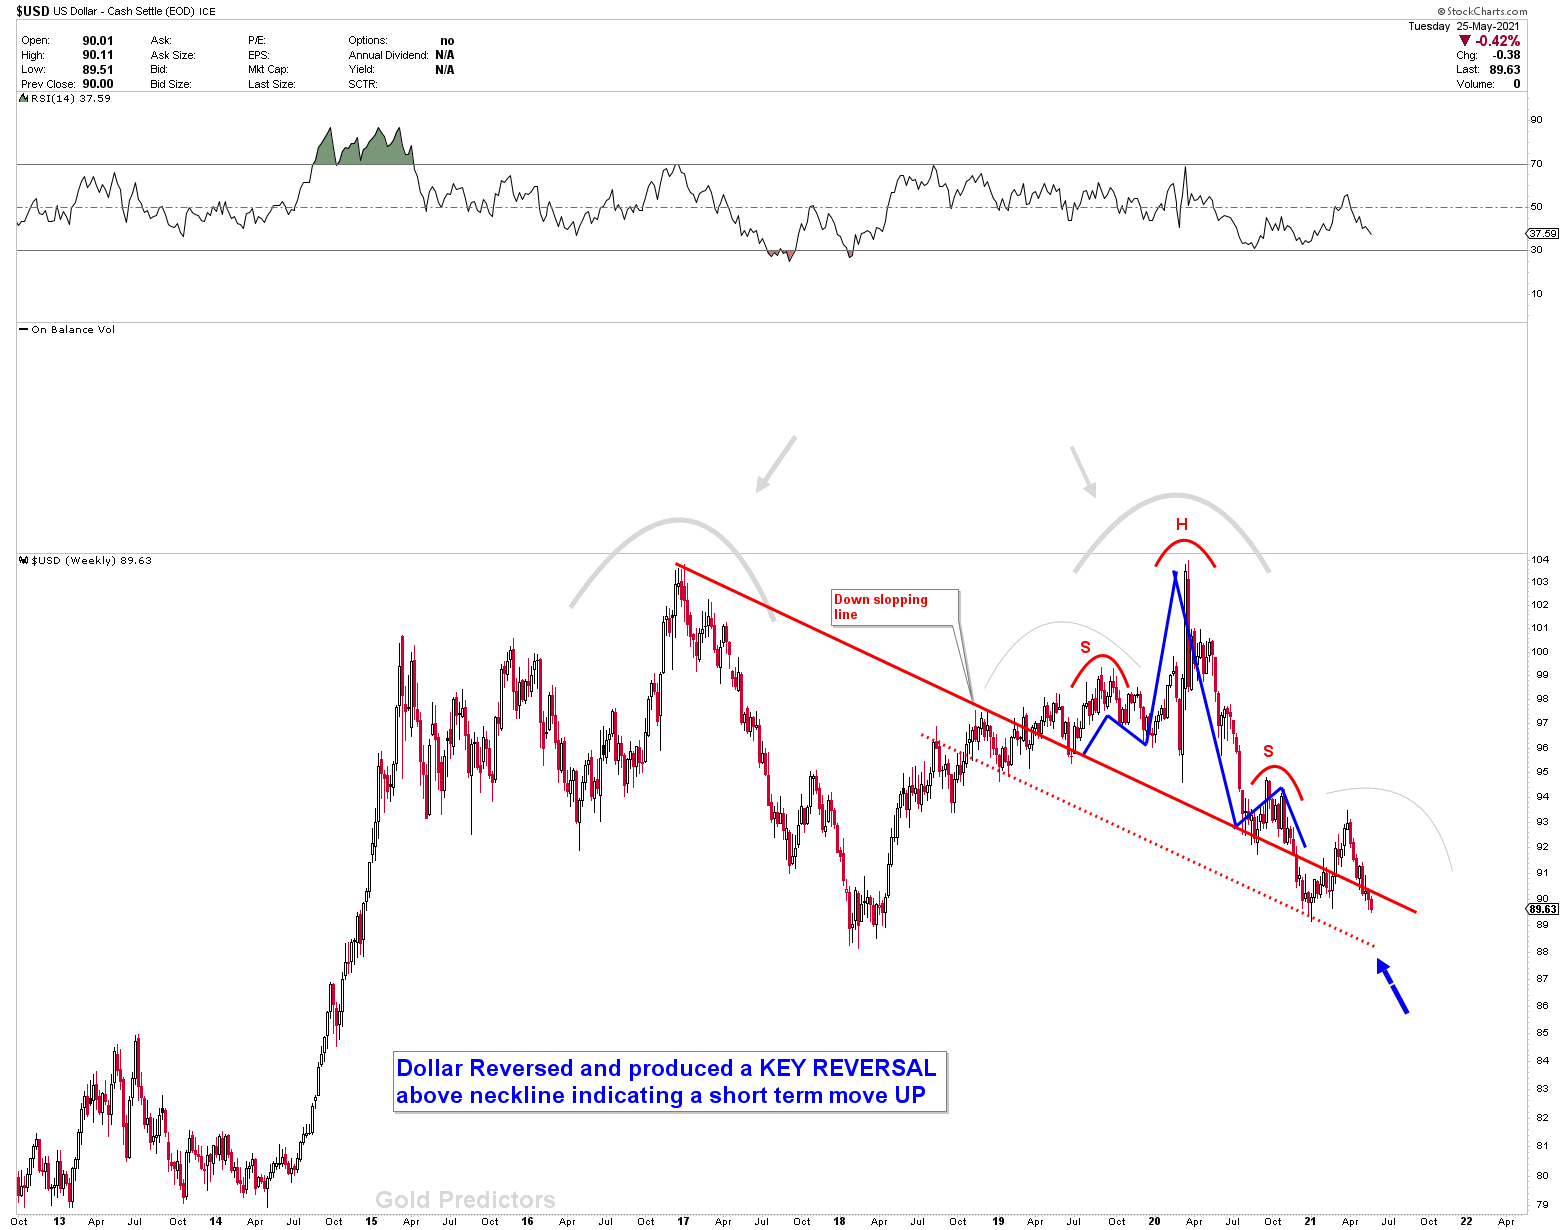
The price of the US dollar has been oscillating in significant areas, and we expect it to crash soon. The significance of the area can be seen on the monthly chart of the US dollar. The neckline of M type bearish patterns is approved by the red dotted line. Prices are breaking through the read channel, and a monthly close below the juncture would break long-term supports. The weekly charts for the US dollar are also bearish. Just keep in mind about the possibility of churn at these levels before continuation of long term trends.
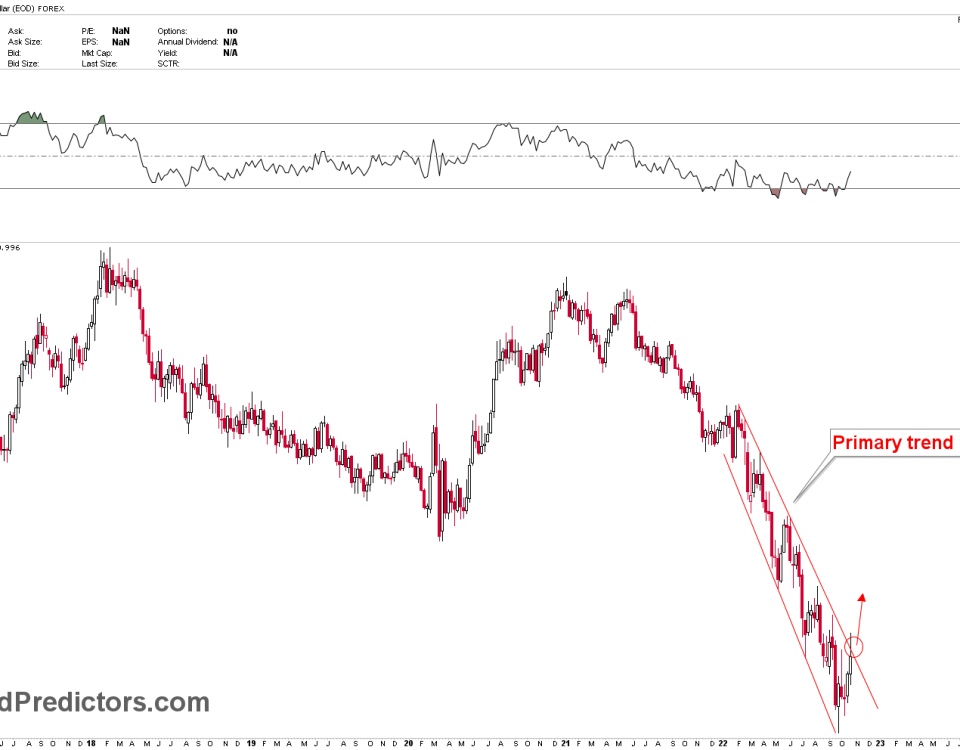
Effects of the US Dollar’s Pressure
This isn’t a new topic; we’ve been talking about it for a long time. The effects of US dollar weakness on EURUSD, USDJPY, AUDUSD, USDCAD, GBPUSD, and USDCHF have been discussed previously. These are the pairs that will be the most influenced. The major breakout on the EURUSD monthly chart, which is accompanied by a Mega flag formations, suggests that the US dollar is about to crash. Even if dollar receives a bounce from here, US dollar remains under pressure. Let’s start with the USDCAD chart.
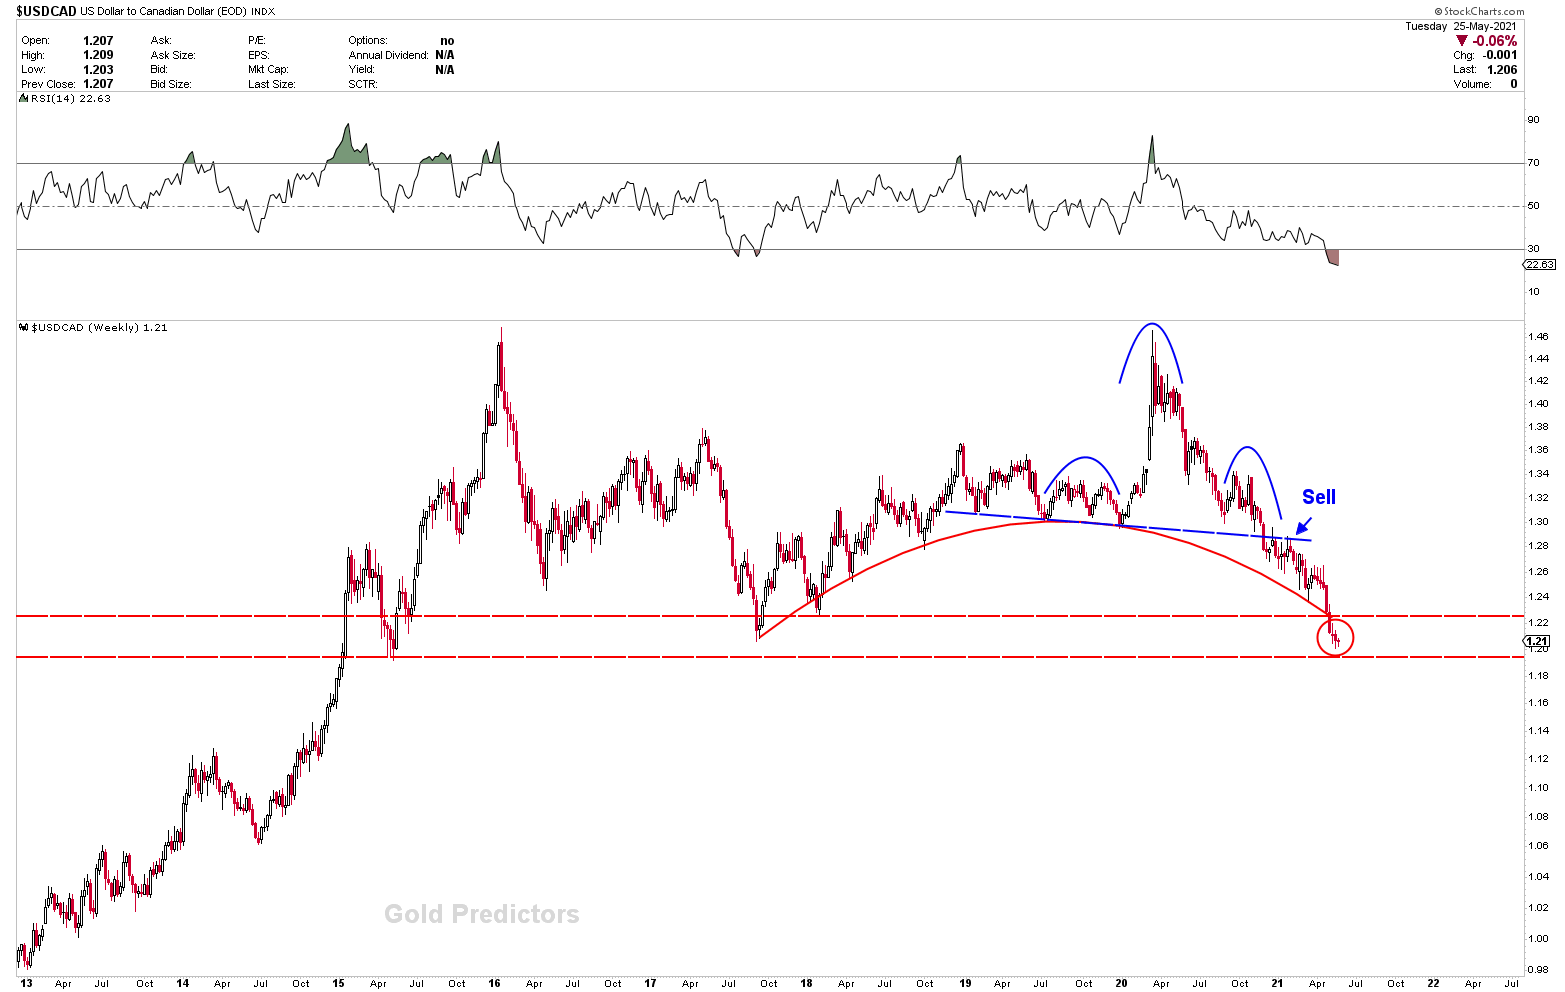
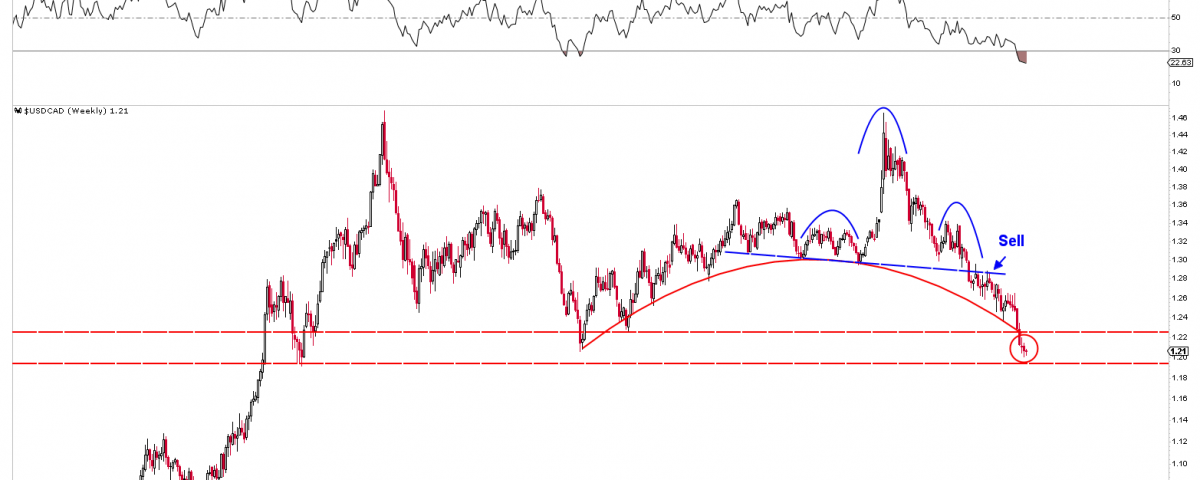
Because the US dollar is trading in a significant area, the USDCAD is also trading in a significant area on long-term weekly charts. The red circle that was drawn two weeks ago is now holding its value. Price may churn in these areas, but the long-term trend will remain bearish, according to the development of chart patterns.
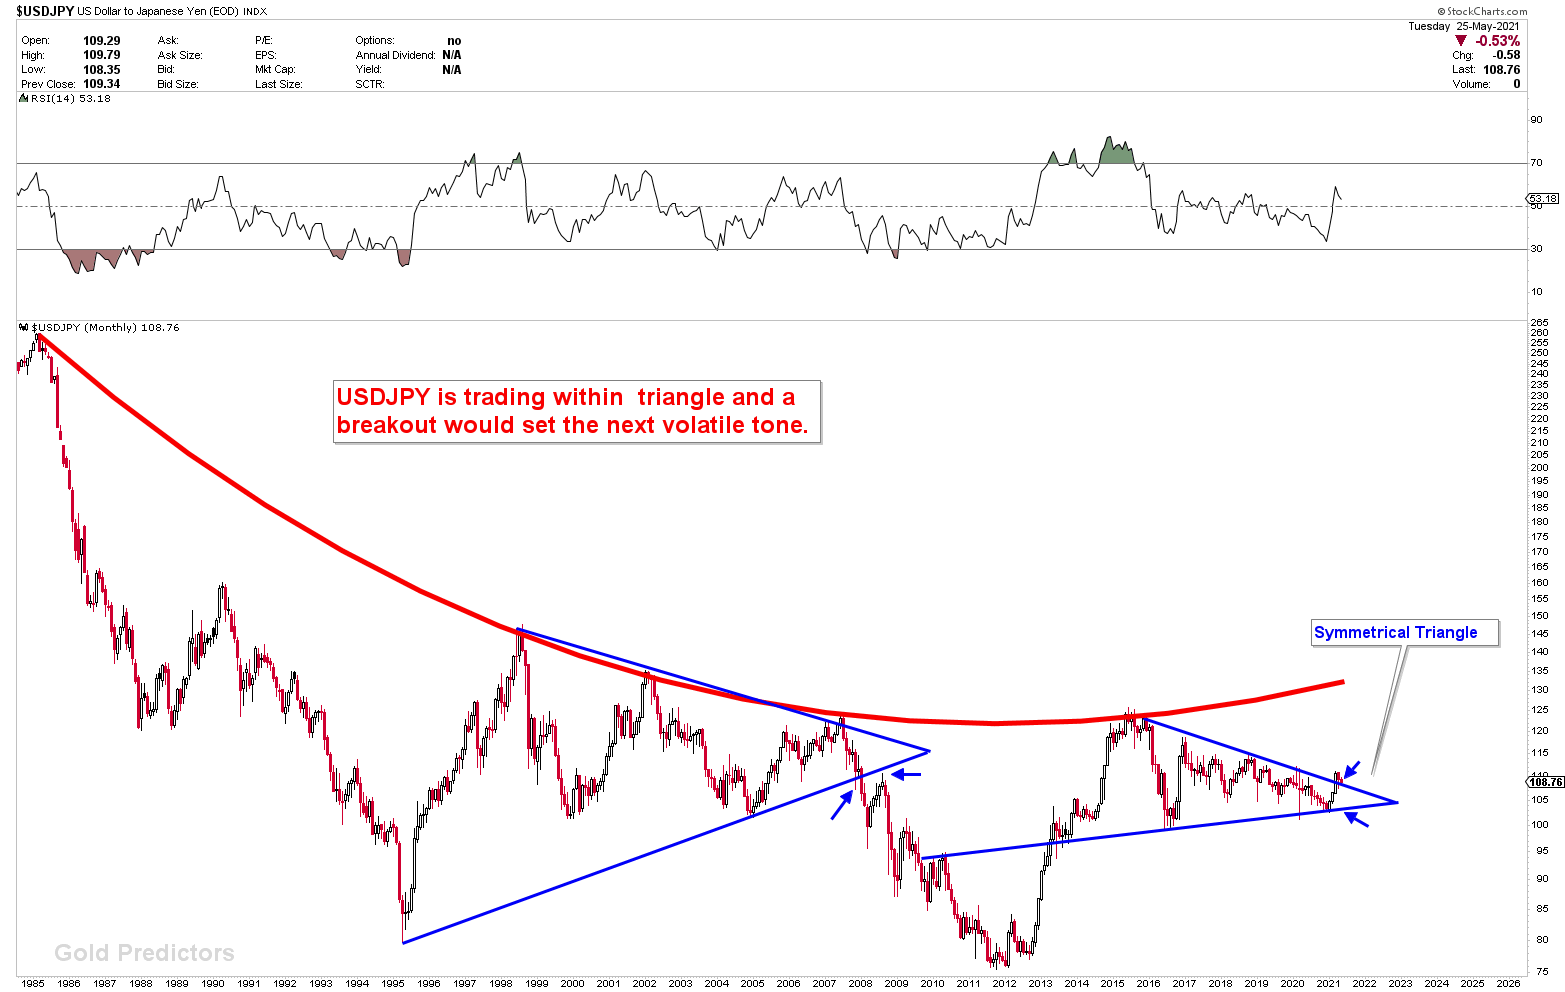
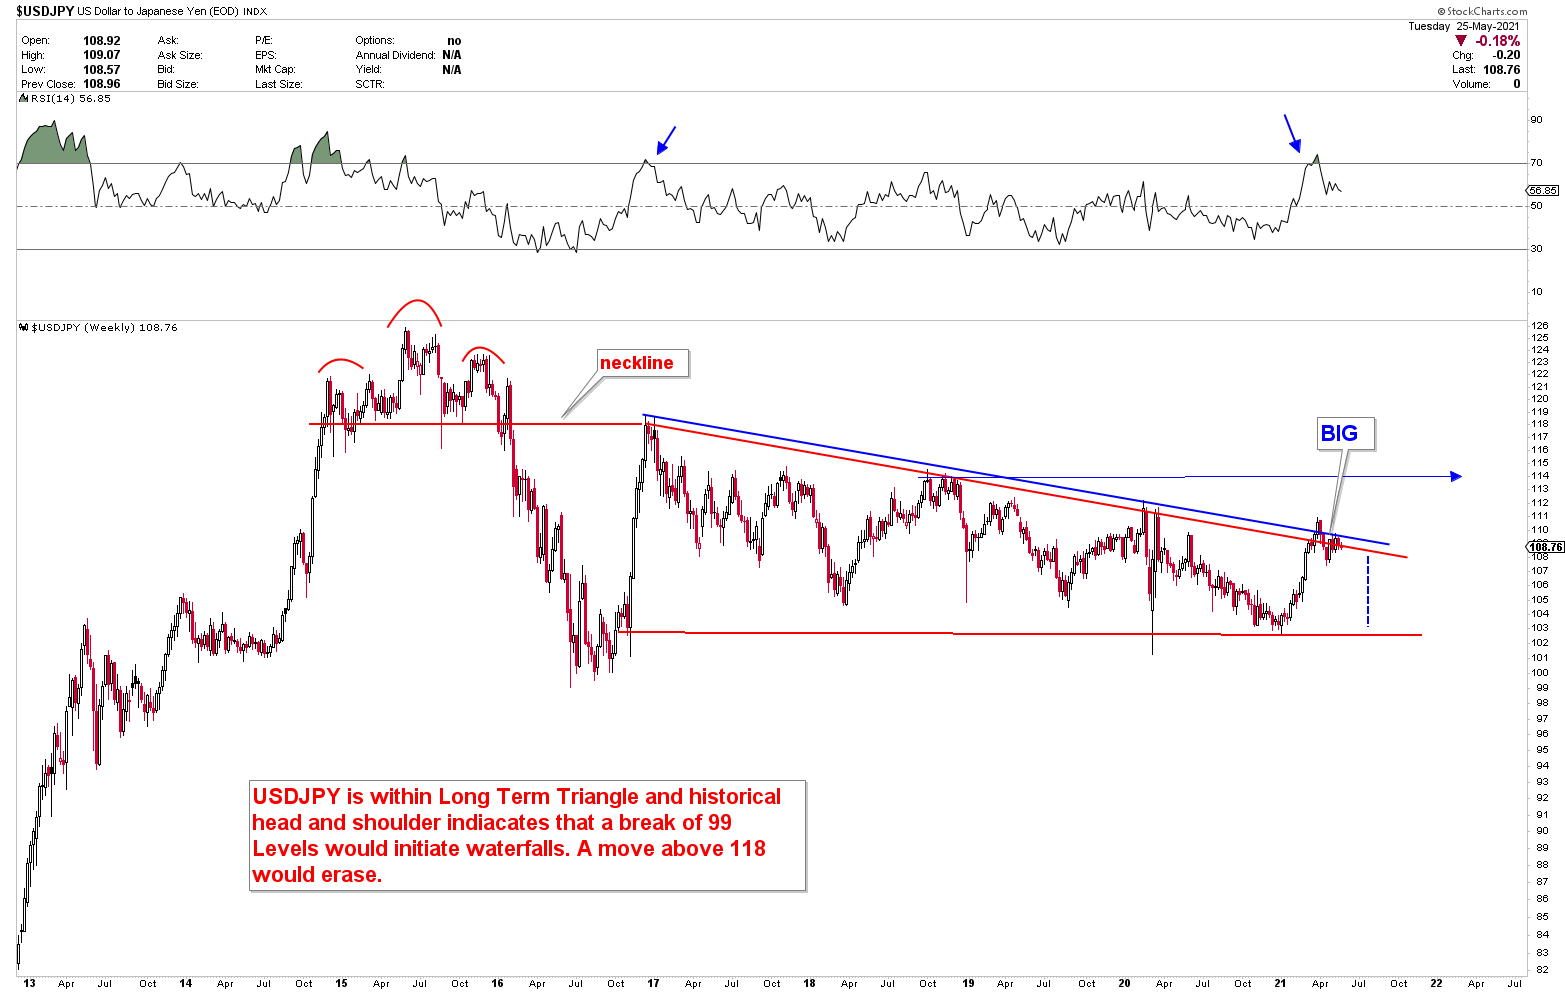
Let’s take a look at the USDJPY weekly and monthly charts, which were previously posted here. The charts are exactly as they should be. Because of the uncertainty in all financial markets caused by Covid-19, large deviations are possible in monthly areas. The weekly chart of the USDJPY, was presented to you on March 10th to assess the gold bottoms. When the USDJPY hit the triangle, we expected gold to bottom, and that is exactly what happened. Gold took flight from 1680 to 1900, and the USDJPY has not broken the triangle at the same time.
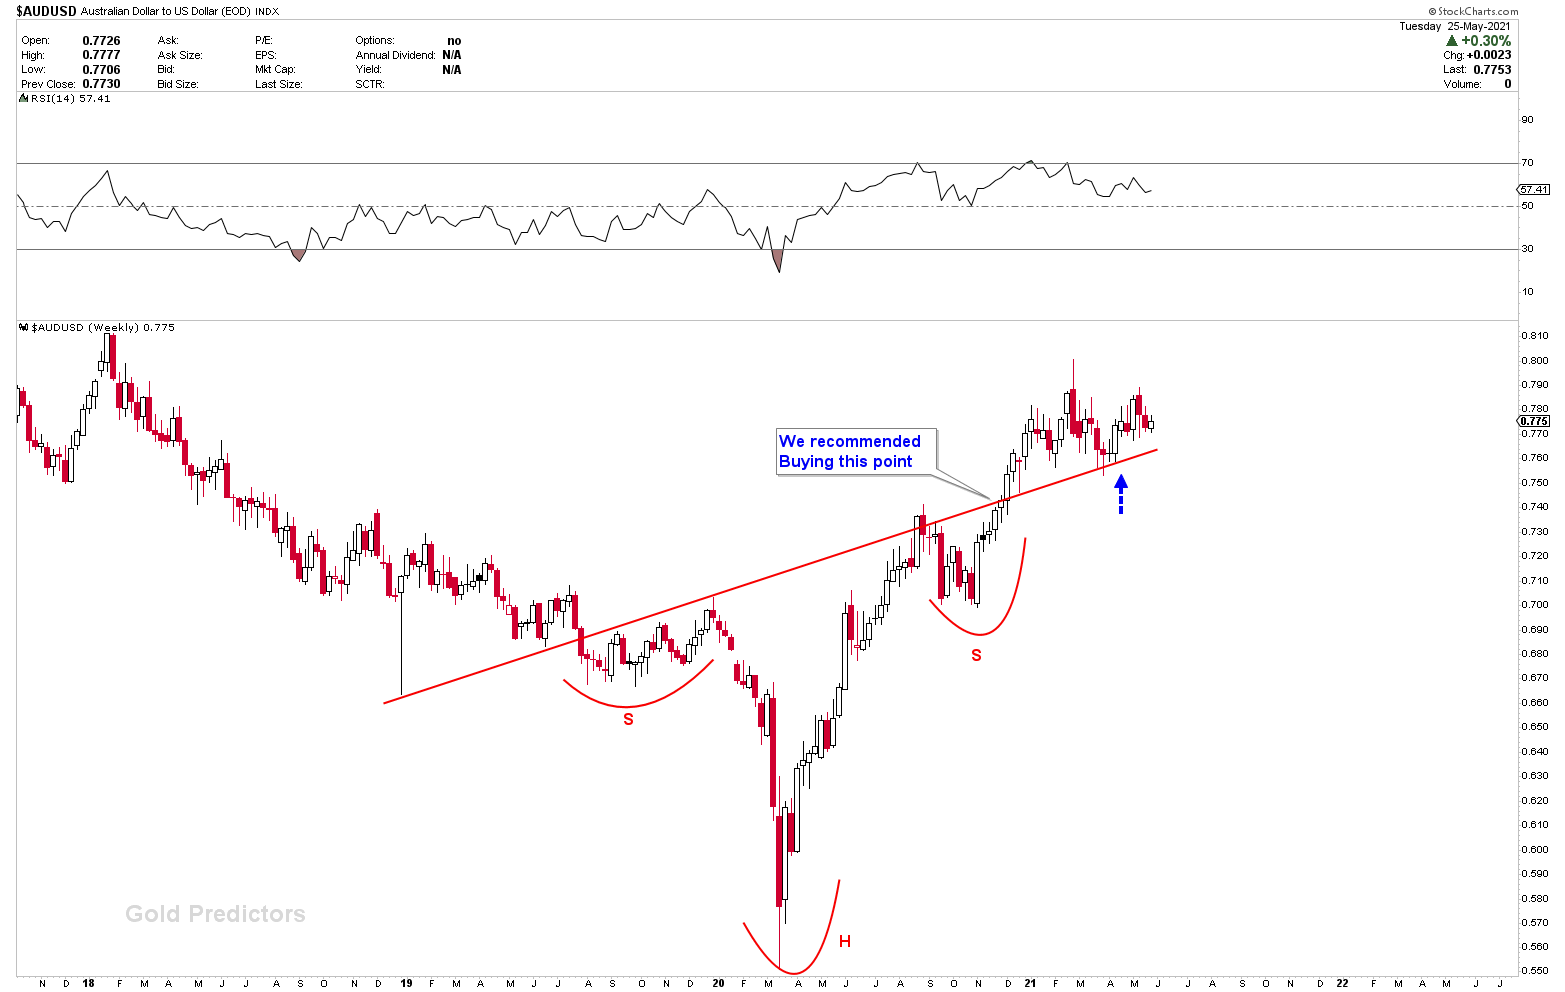
The Australian dollar is still in a sideways trend, but it is trading above the neckline. The AUDUSD would benefit from dollar weakness. The long term outlook of AUDUSD remains bullish.
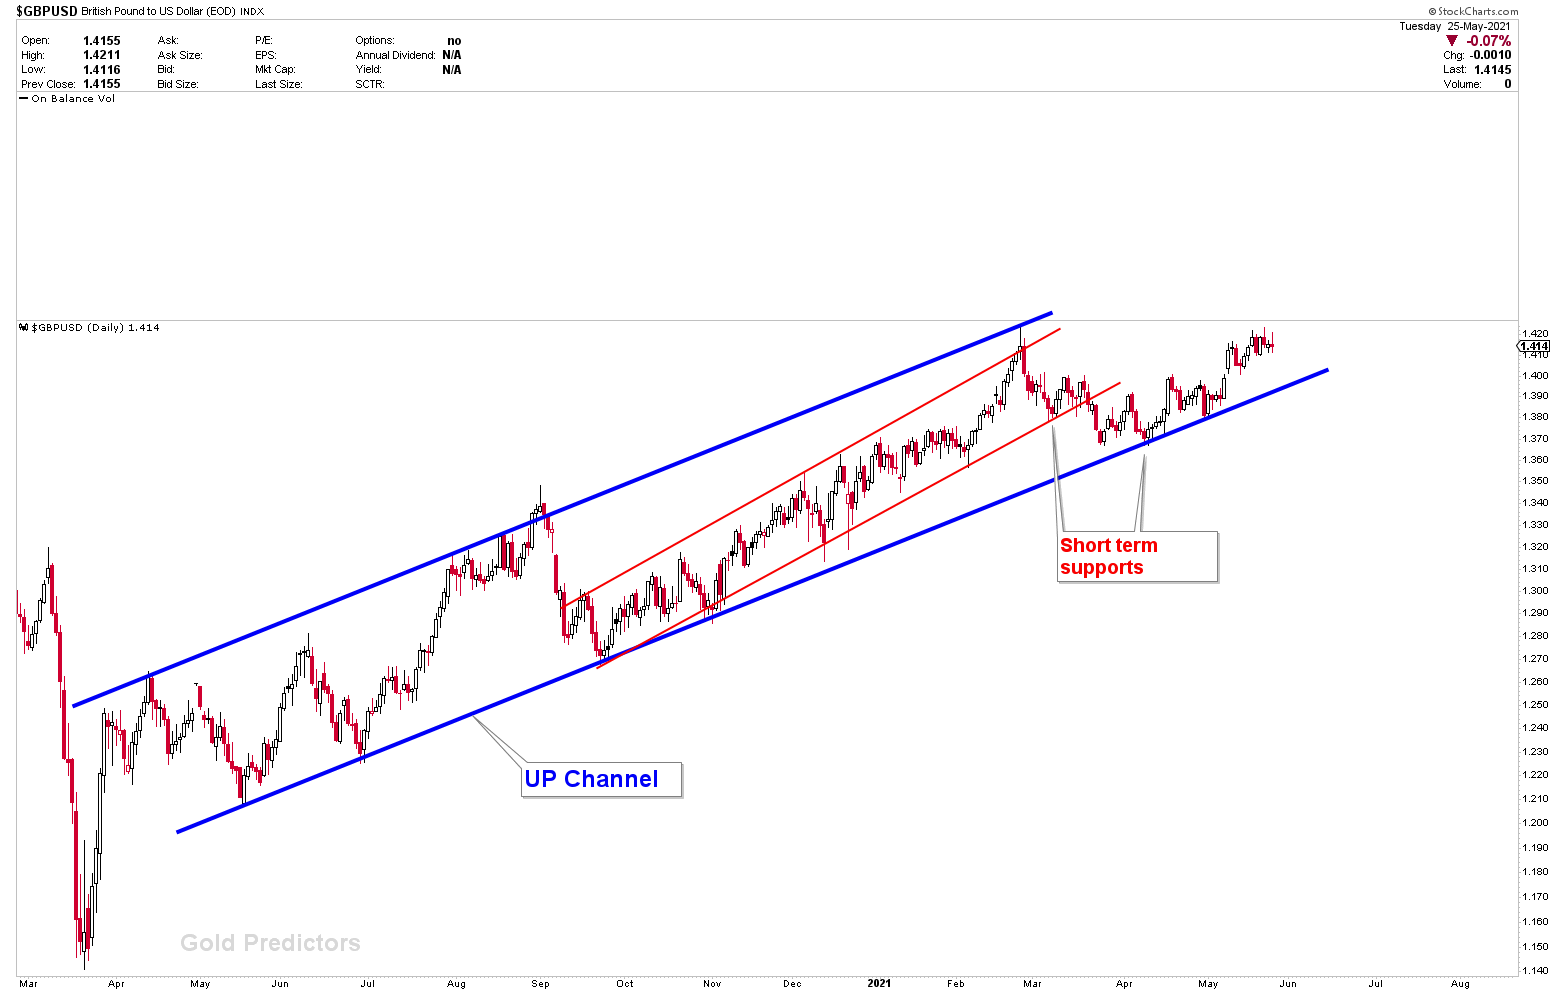
Pound Sterling
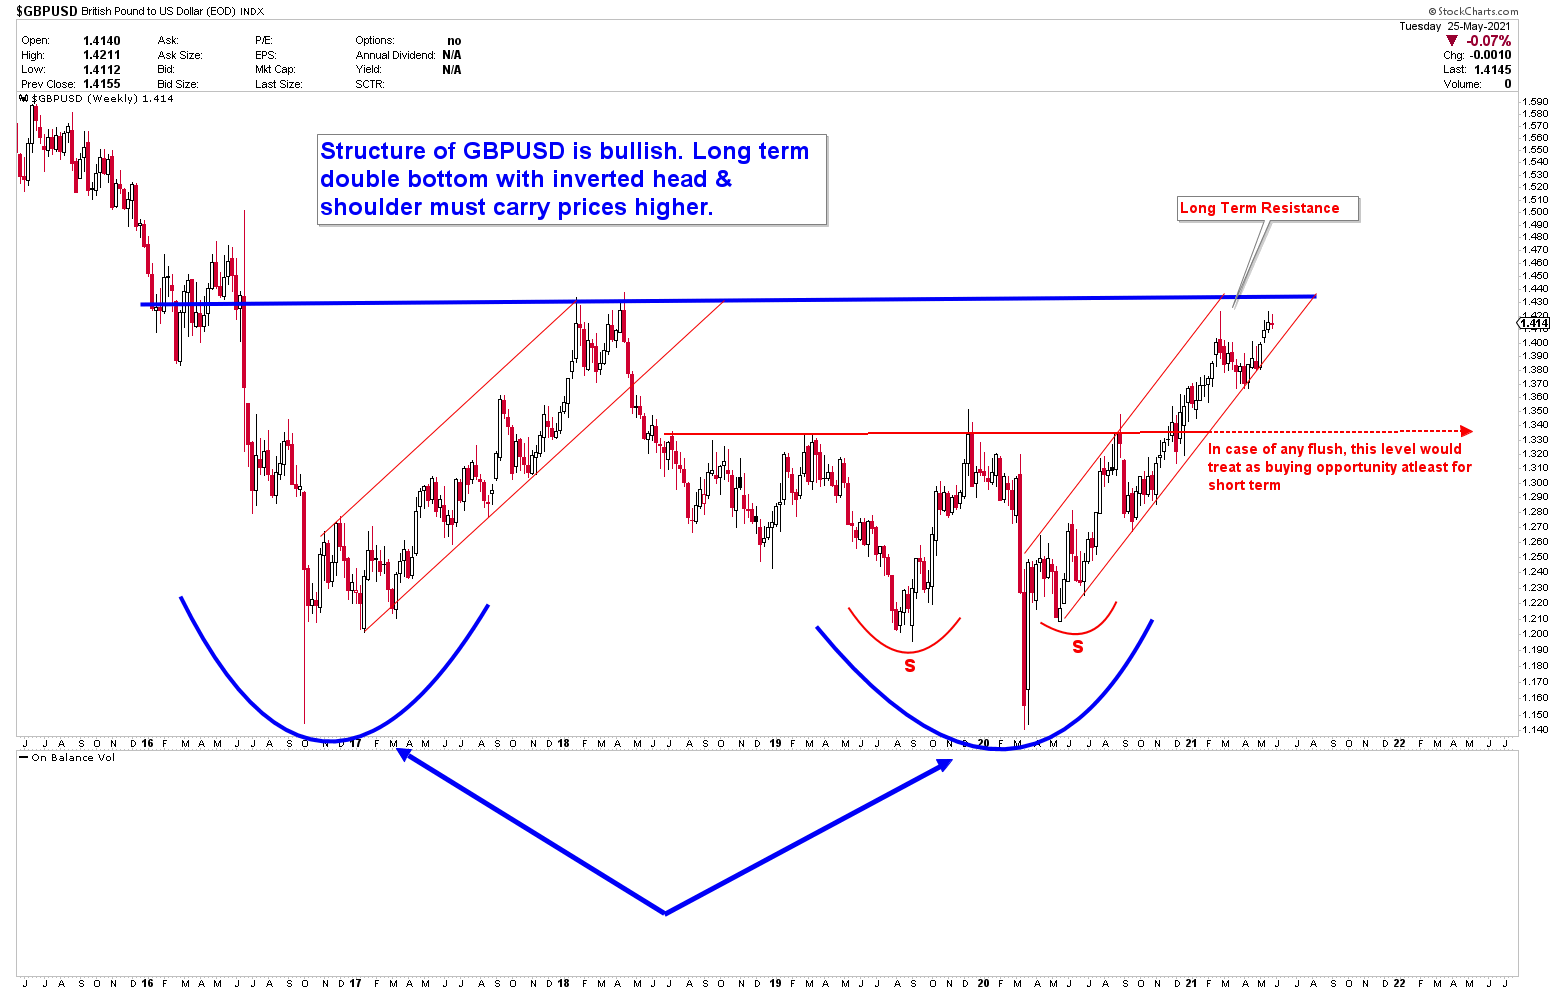
The charts below show the GBPUSD daily and weekly outlook. We created this chart a few months ago and followed it week by week. GBPUSD’s importance can be seen on the weekly chart, where long-term resistances are forming. However, the development of long-term price patterns, such as inverted head and shoulders and double bottom formations, is bullish in the instrument. Before any significant breakout, price is expected to encounter resistance at the long term blue line.