


US Dollar Index Dives From The Roof
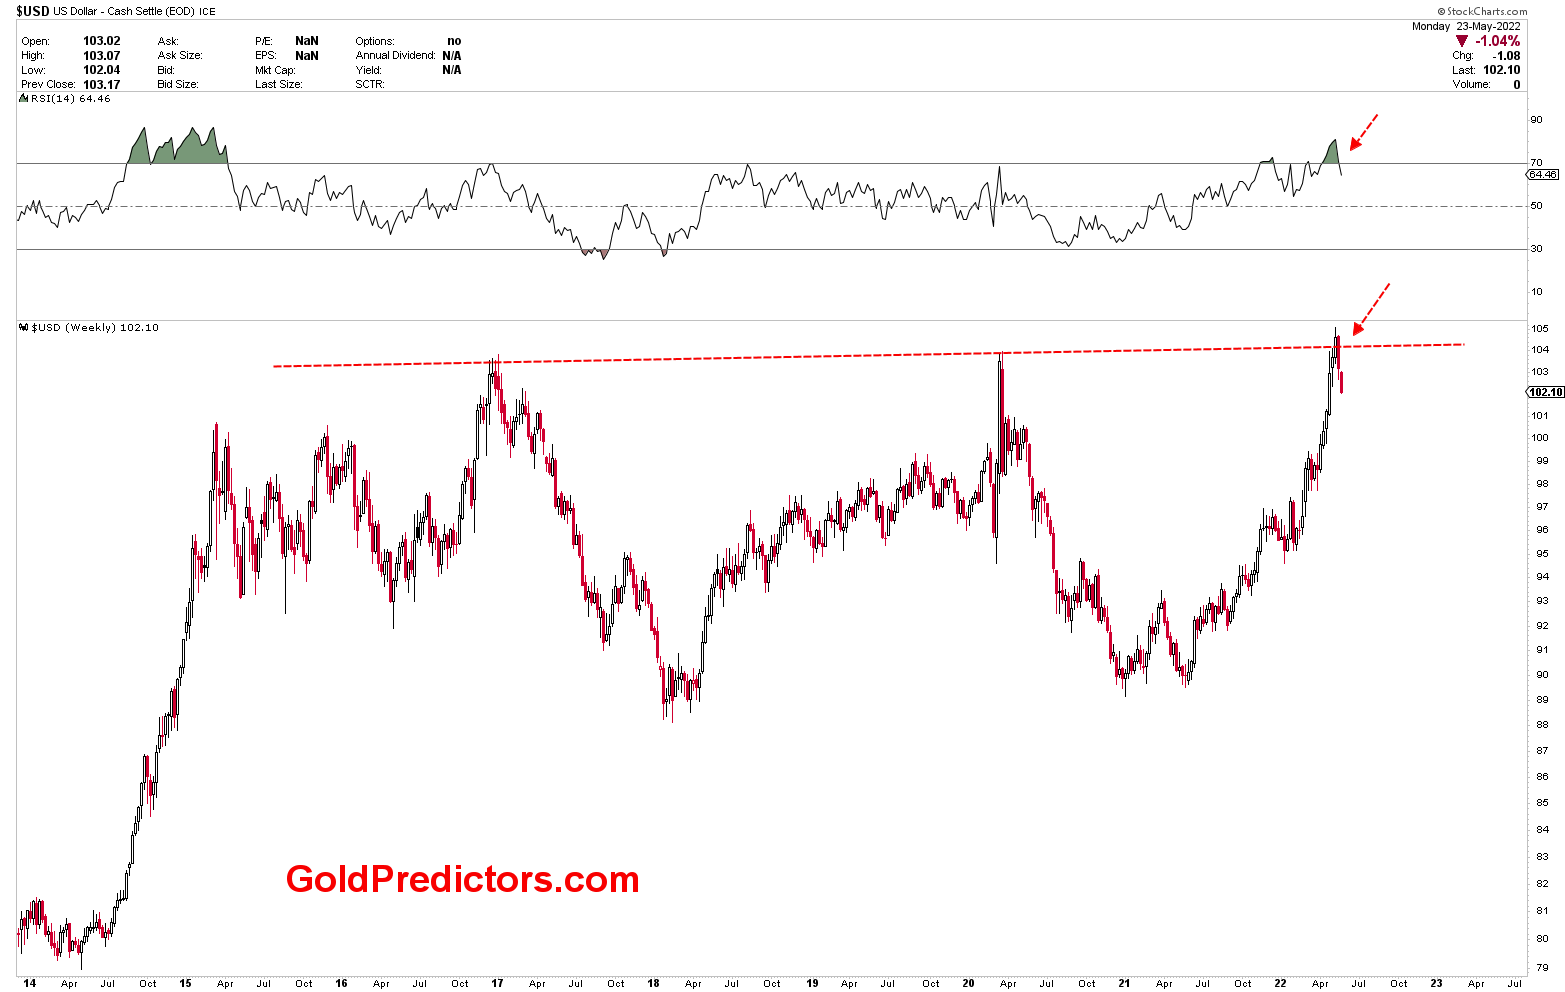
The US Dollar Index continued its success story to the roof of 2020 highs before beginning to fall from the strong technical resistance. On Tuesday, the index fell to new lows in the sub-102.00 range. Investors will be watching for the release of the S&P Global Composite PMI and the speech by Federal Reserve Chair Jerome Powell. The Fed chair’s speech is significant due to the interest rate decision that will be announced in the upcoming June monetary policy. The expectations of the Fed’s high-interest rates have reduced the scale of economic activity in the United States. The market anticipates a rate hike announcement of 50 basis points, which appears to be feasible to contain soaring inflation. The Fed maintains its hawkish stance on inflation, but it is well behind the curve, with CPI rising at 8.3% compared to a fed funds target rate of 0.75% to 1.0%. The expected rate hikes raise the upper FFR target to 2.5%, but even this is unlikely to dampen consumer spending.
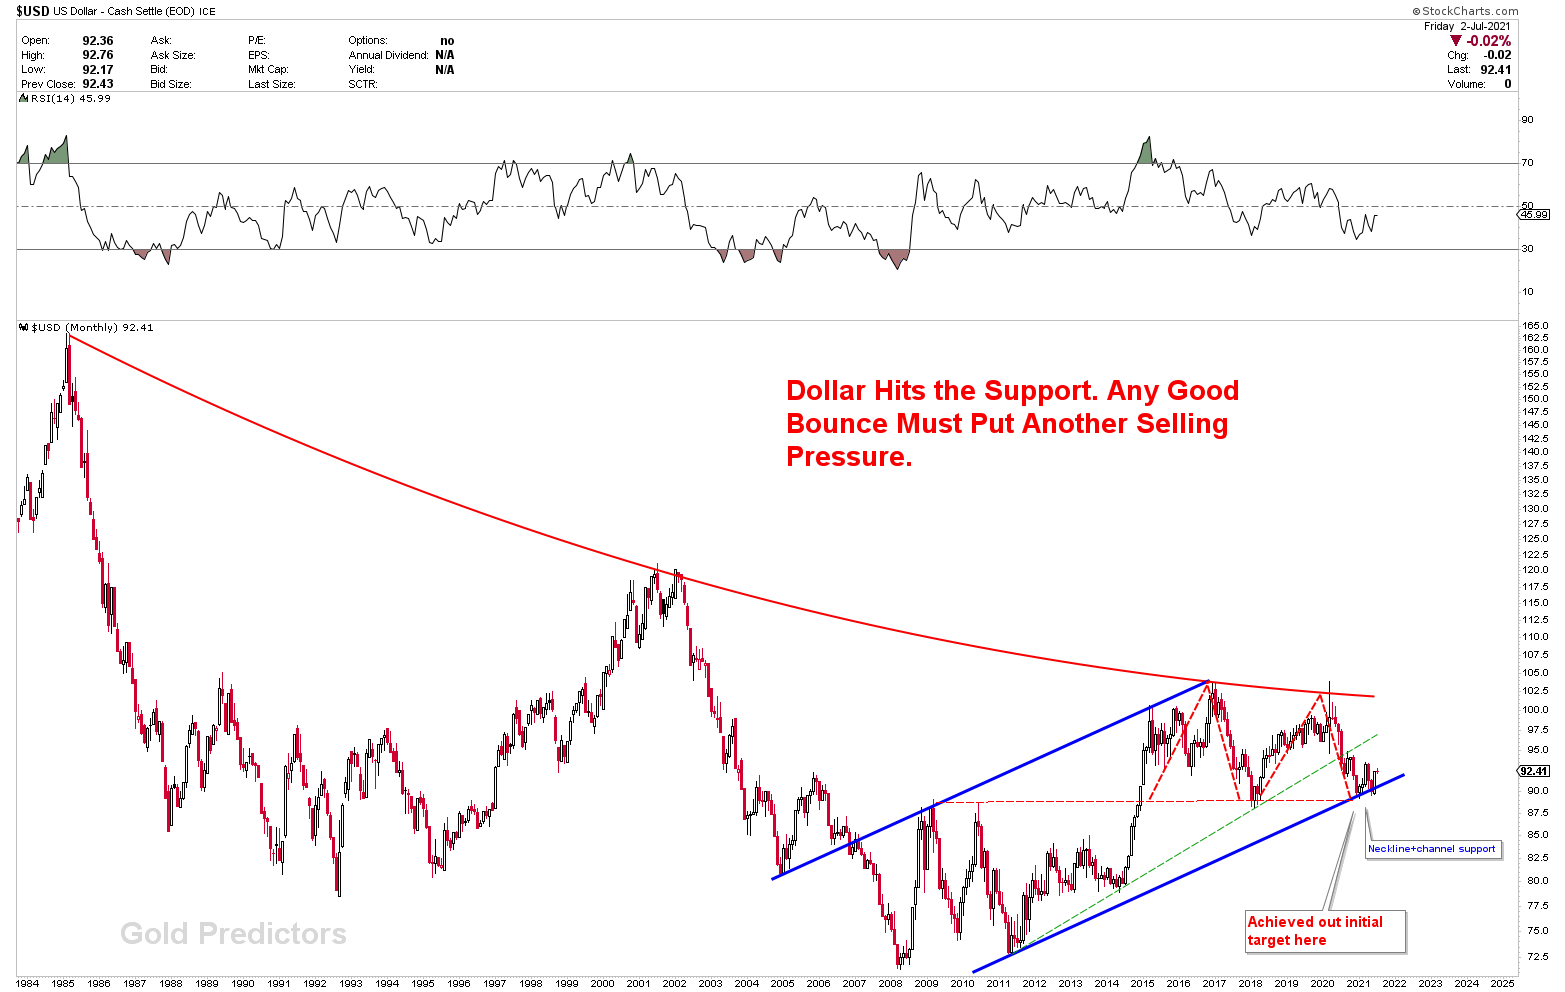
A US Dollar monthly chart from April to June 2021 shows the strong pivotal point in the US dollar where a strong bounce was expected. The pivotal region was supported by the strong rising blue trend with the neckline of M-type patterns. We explained that the US dollar index has achieved the initial target here and a bounce was expected.
Reaction of Strong Pivotal Support in US Dollar Index
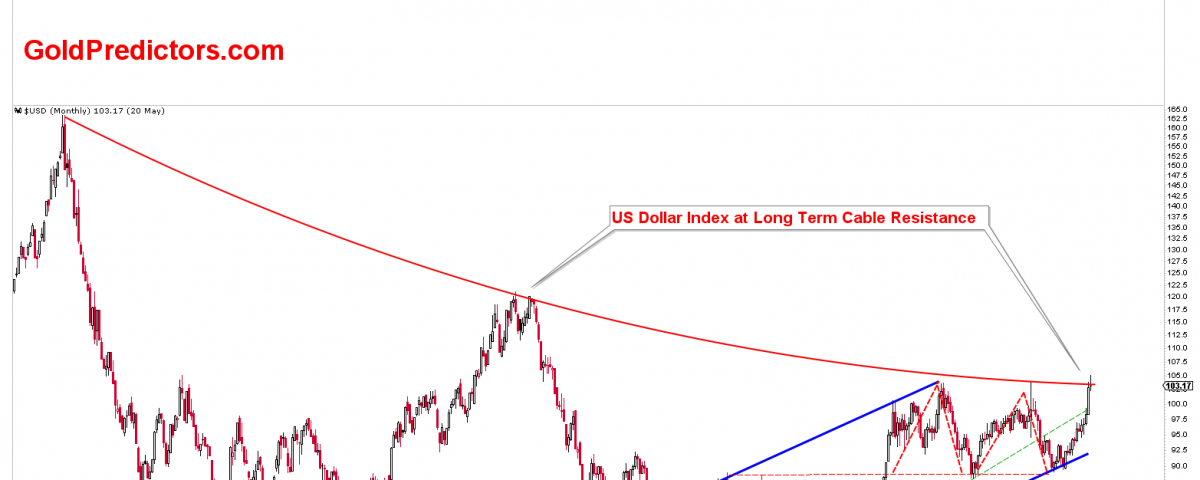
The reaction of the strong pivotal support bounced the index to a new highs surpassing the strong technical resistance. A 40 years cable resistance line was hit whereby the US dollar is expected to pull back from this region.
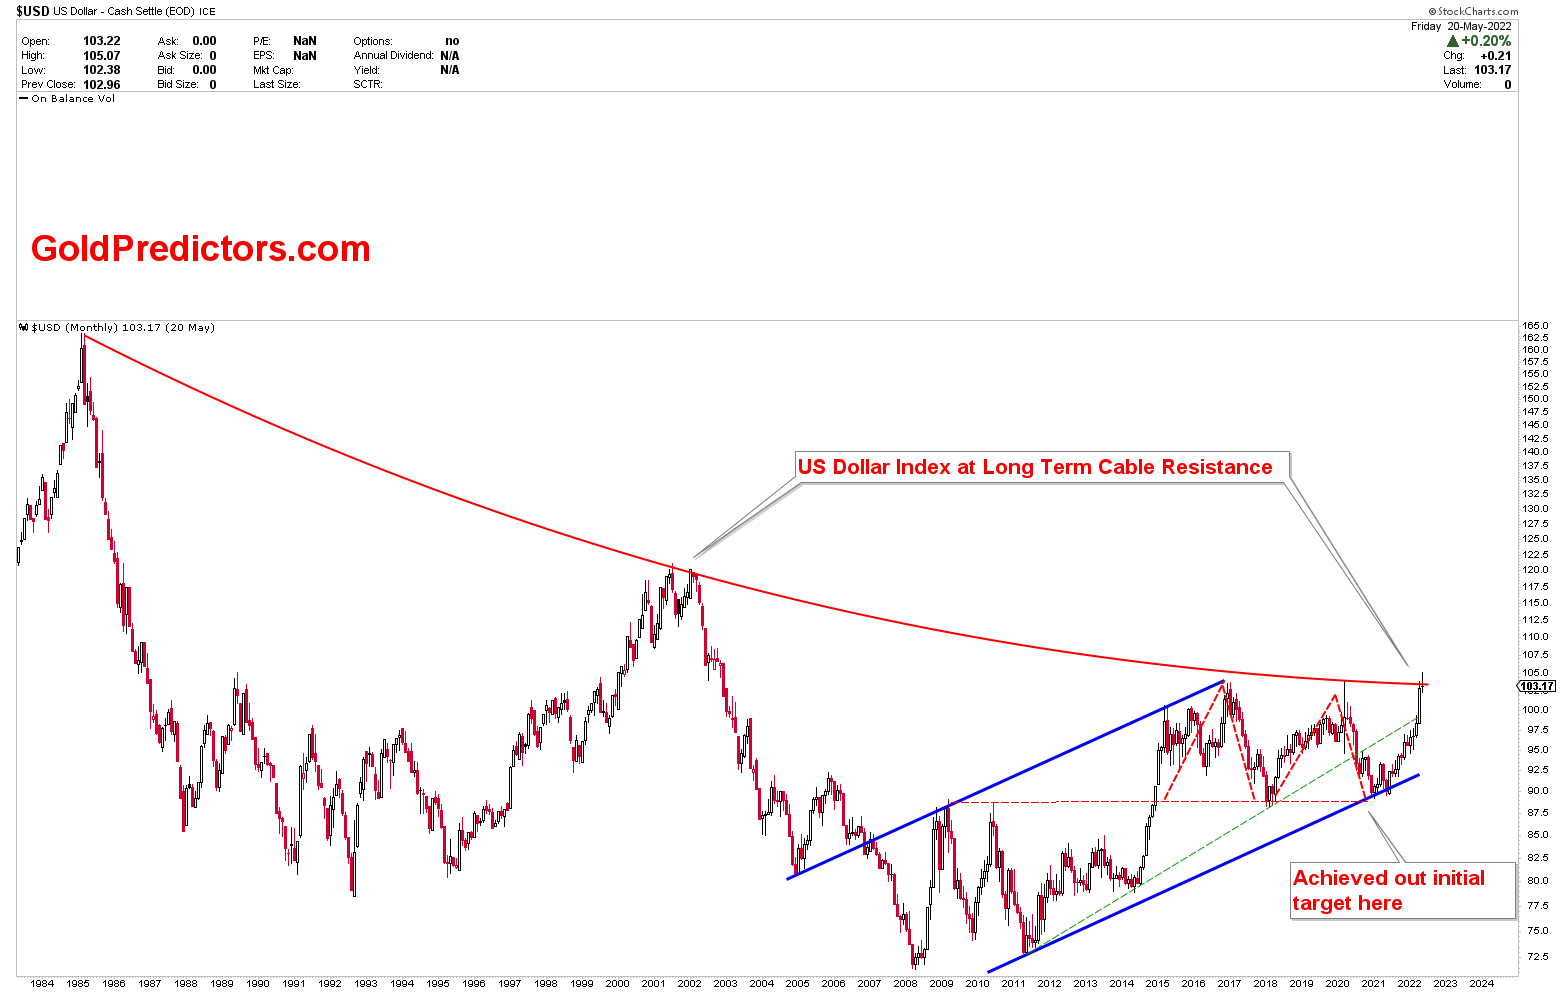
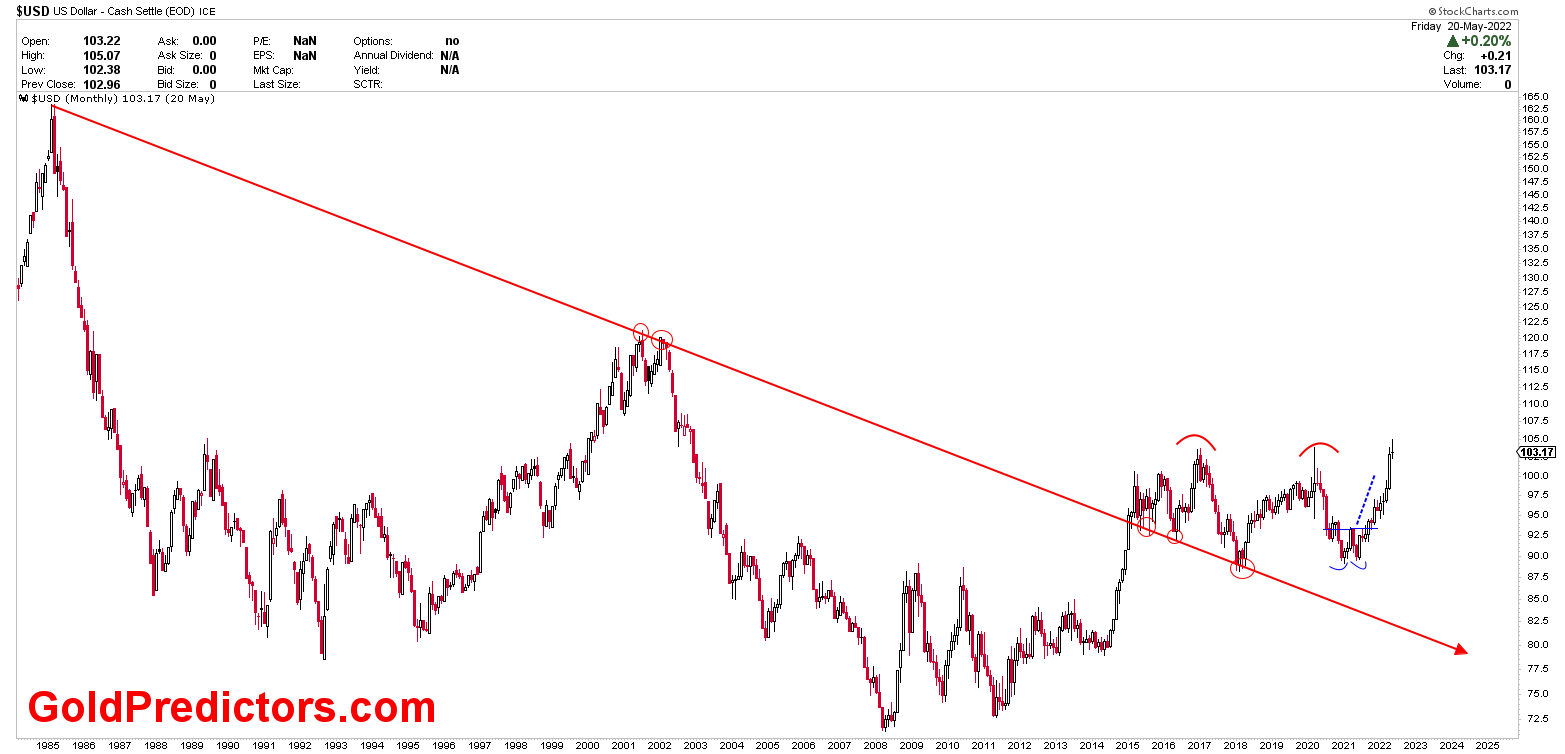
Another monthly chart presents a strong bearish trend line whereby the price is fluctuating above the trend line with wide ranges. A blue double bottom was identified as the support region and the index has risen to new highs. The index is currently facing a strong resistance where a pullback is due.
The US dollar view is more visible on the weekly chart. The weekly chart shows a strong resistance whereby the pullback is currently in progress. The correlation of the US dollar index with other instruments indicates that the pullback in the US dollar might be deep and a huge drop is possible.
USDCAD: A Correlated Instrument
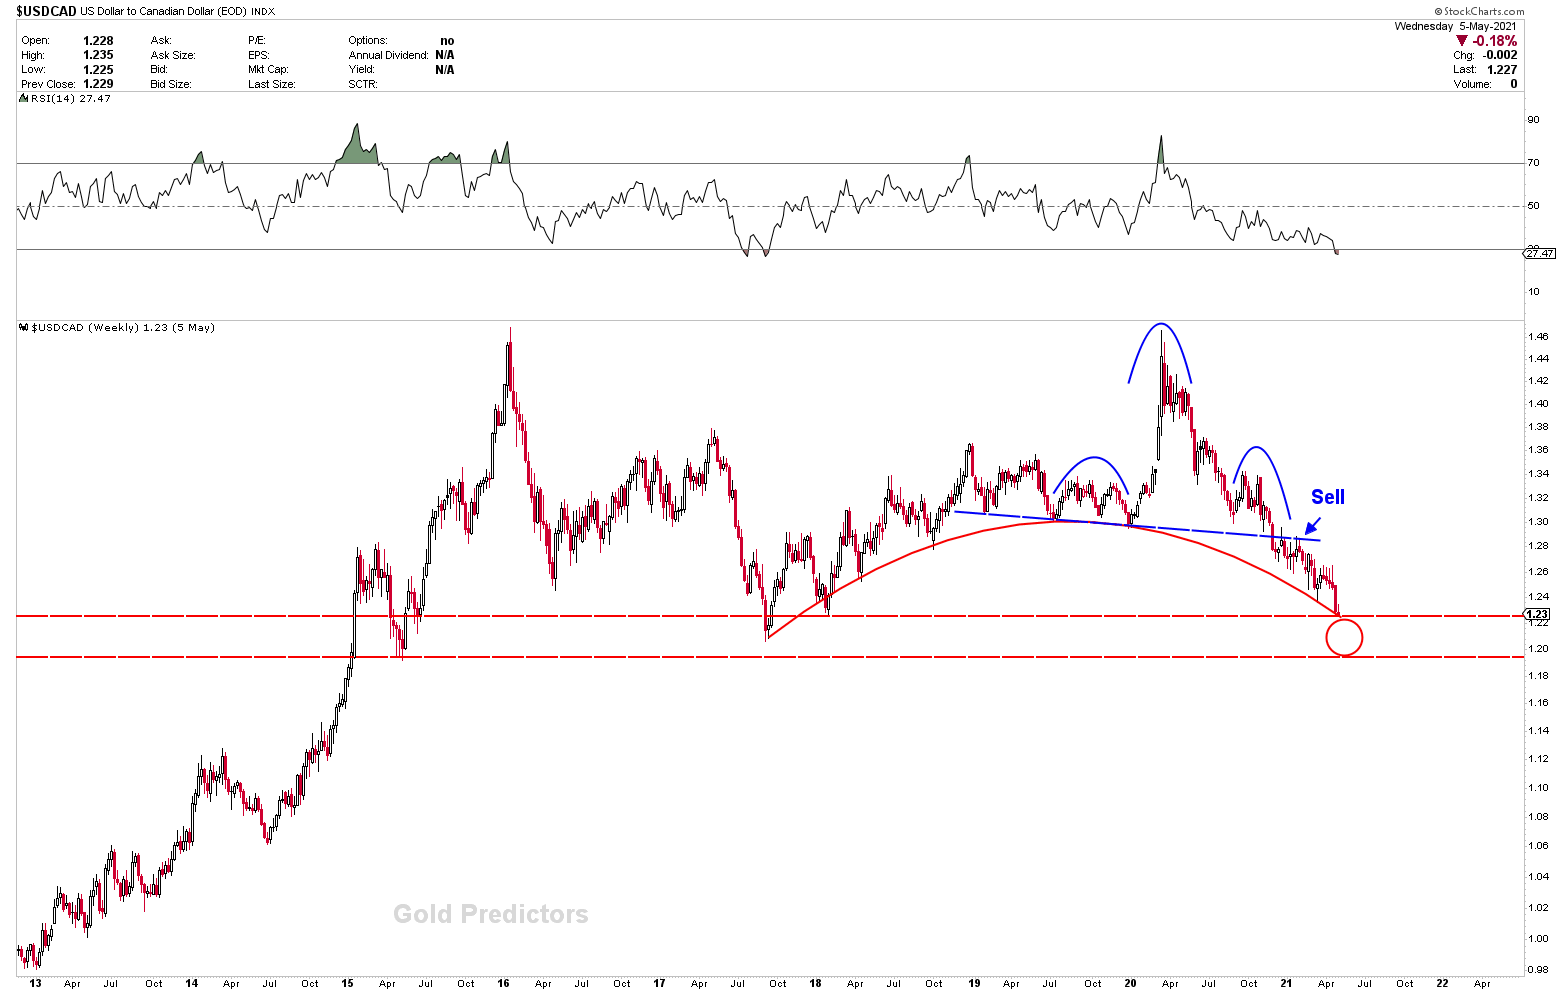
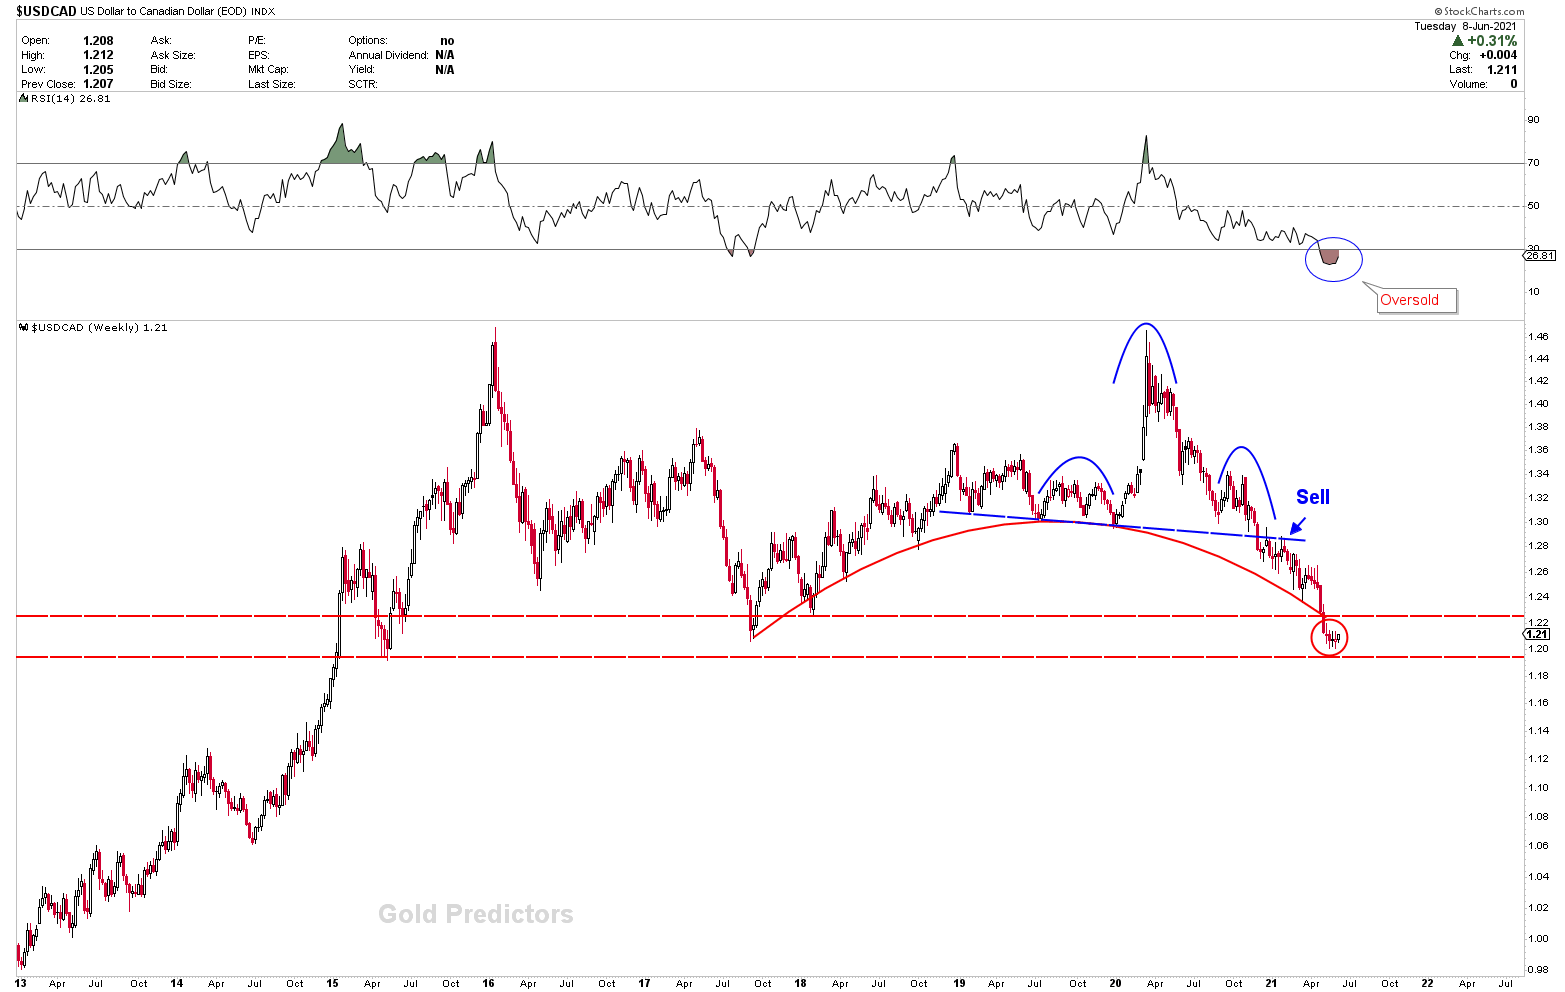
A sell signal was trigged in the USDCAD in 2021 and the price dropped as per expectations. The red dotted support band was spotted as the major support region as shown in the charts of May 2021 and June 2021.
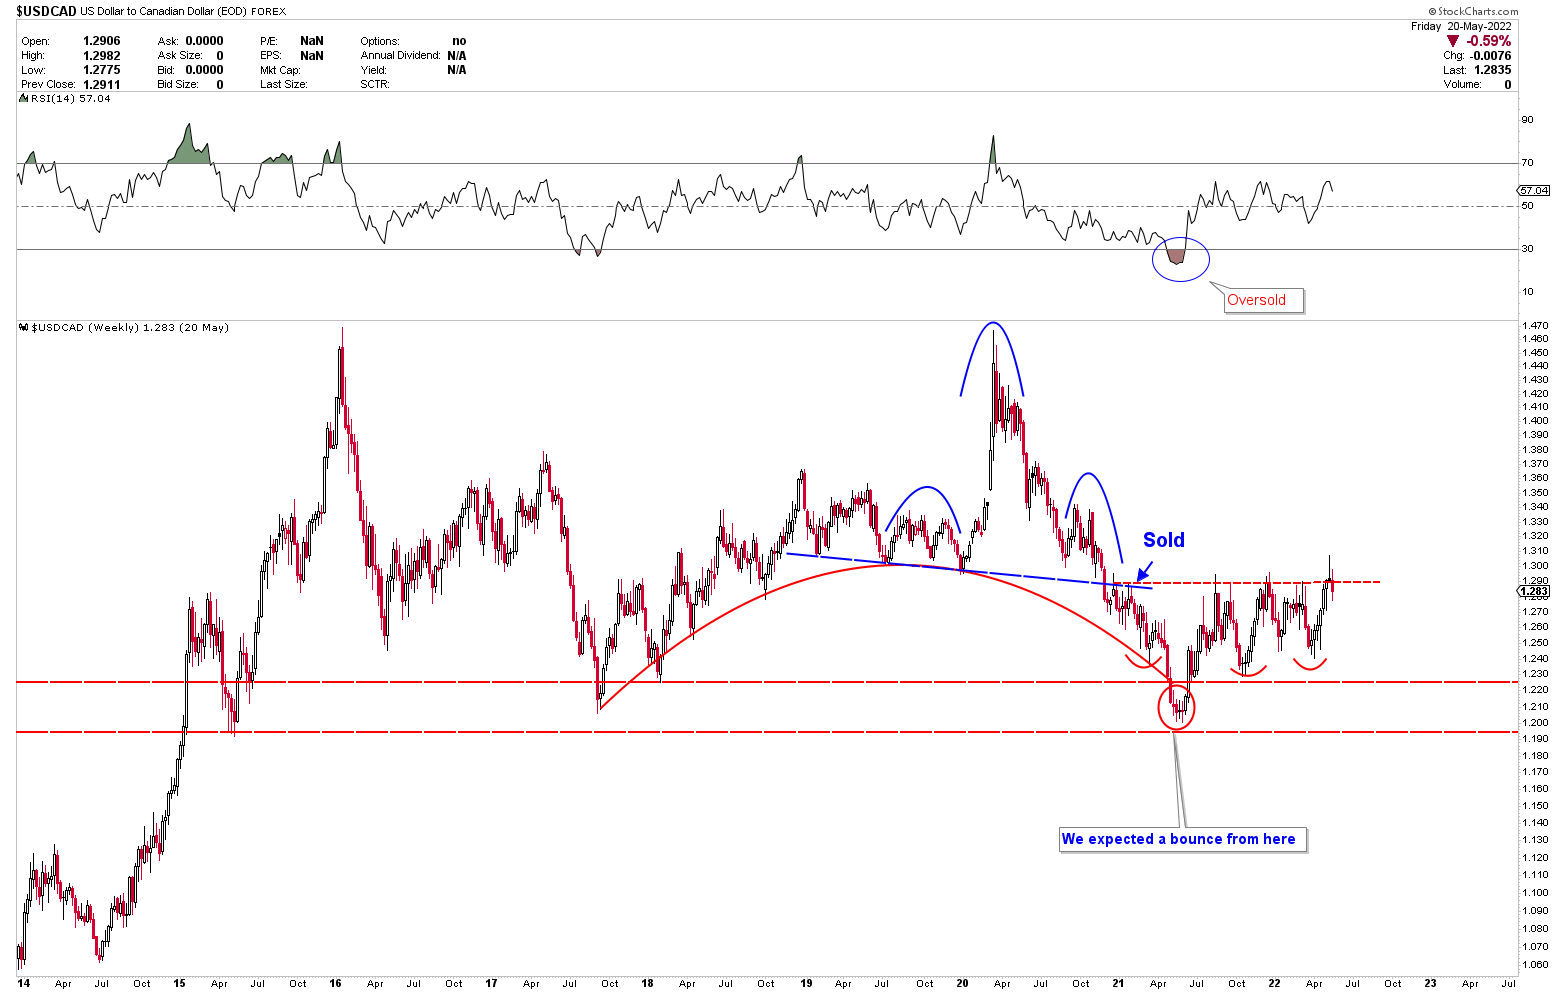
The latest updated chart shows a strong U-turn in the instrument from our identified bottom and the price is currently forming an inverted head and shoulders. There is still a need for some more data to identify the potential bottom or top at current levels.
Conclusions
Global pandemics and war are affecting the global economy. Economic and financial sanctions, as well as energy and food shortages, will have a significant impact on the global economy. Pandemics are typically followed by periods of high inflation, but war also causes inflation as states increase production and deficit spending to compensate for shortages. War, on the other hand, is typically followed by a period of low-interest rates as states attempt to rebuild balance sheets that have been stretched by war-time spending.
Negative real interest rates must be expected in the future as the US attempts to rebuild its balance sheet following the pandemic. The Fed is expected to raise interest rates soon, but it is unlikely to control inflation, which is a system design feature rather than a flaw. Based on the foregoing, financial markets are expected to experience significant turbulence, making short-term trading risky. Trading with high-risk yields high rewards. As a result, small lots must be considered in trader’s portfolio instead of big lots.
To receive the free trading alerts, signals and articles please subscribe as a Free member to the link below.


