


US Dollar Breaks Lower
The US dollar breaks lower on weekly charts, but there is a support region on monthly charts that must be overcome. The US dollar would crash if it fell below the monthly charts discussed in this article.
Highlights
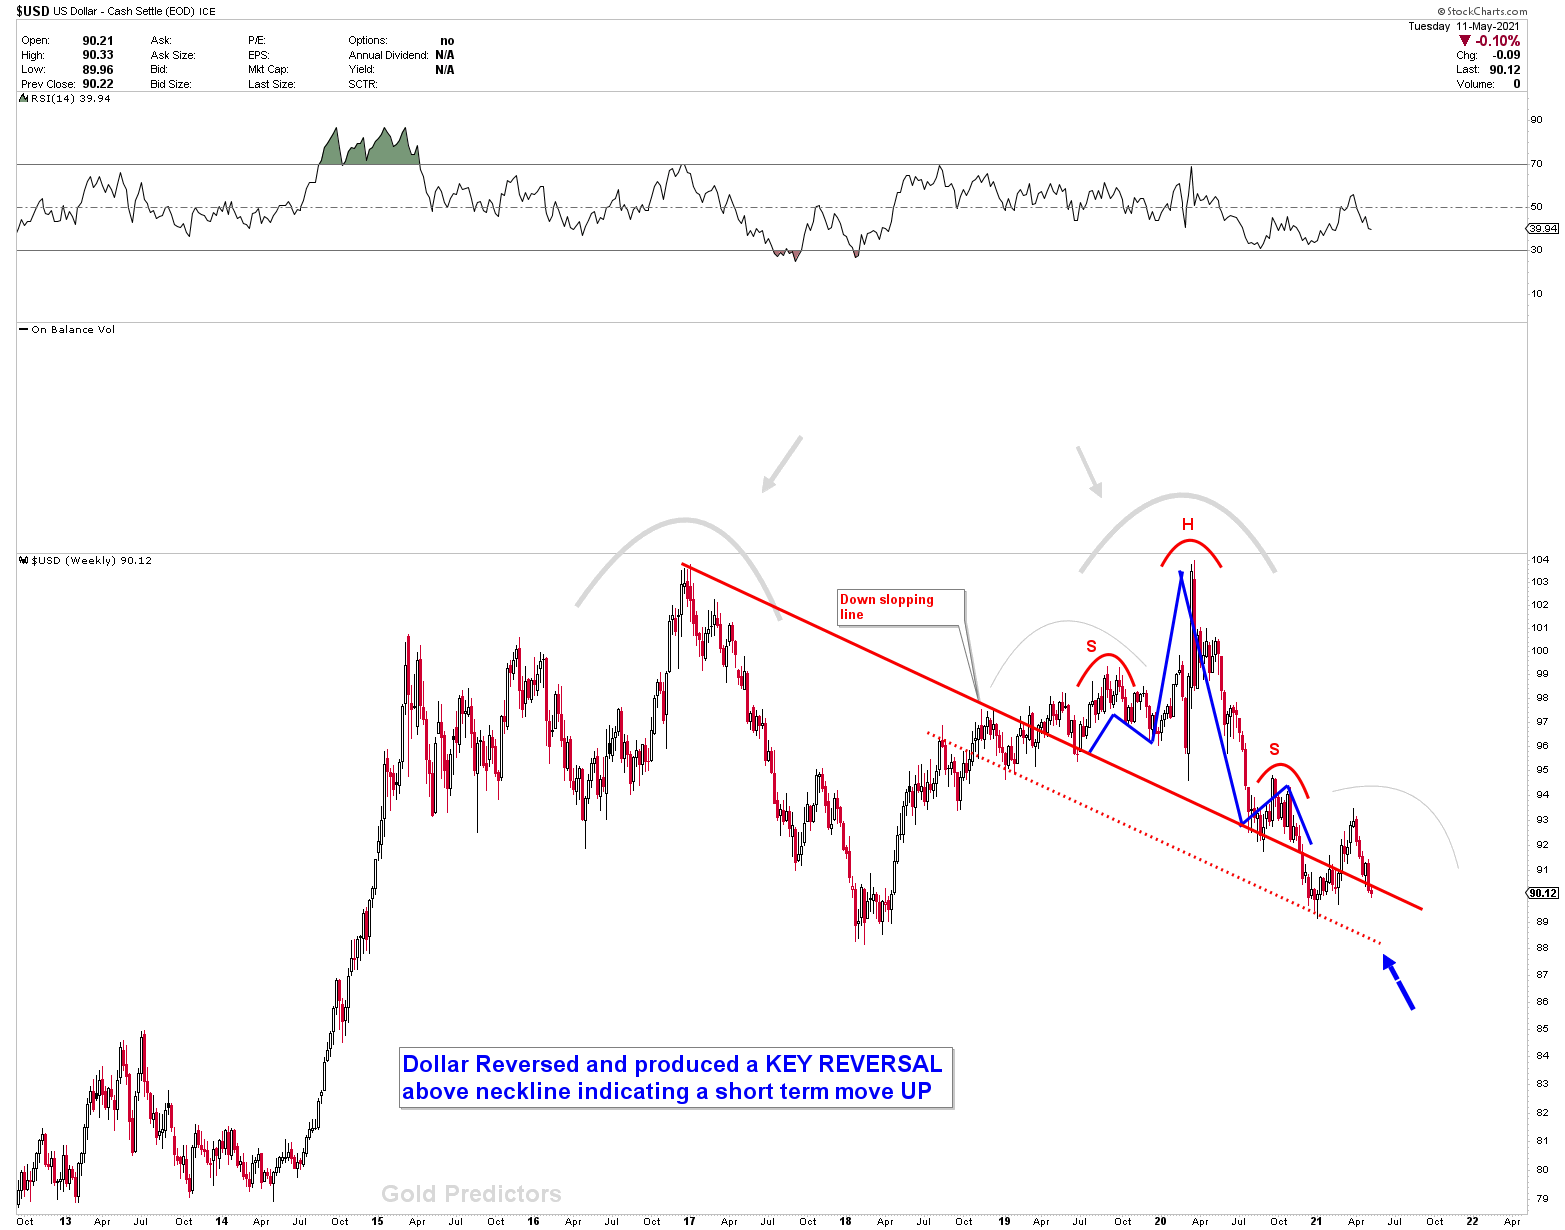
- The US dollar is falling and trading near long-term support.
- The US dollar is trading at PIVOT, a long-term support level where a breakout would crash the value.
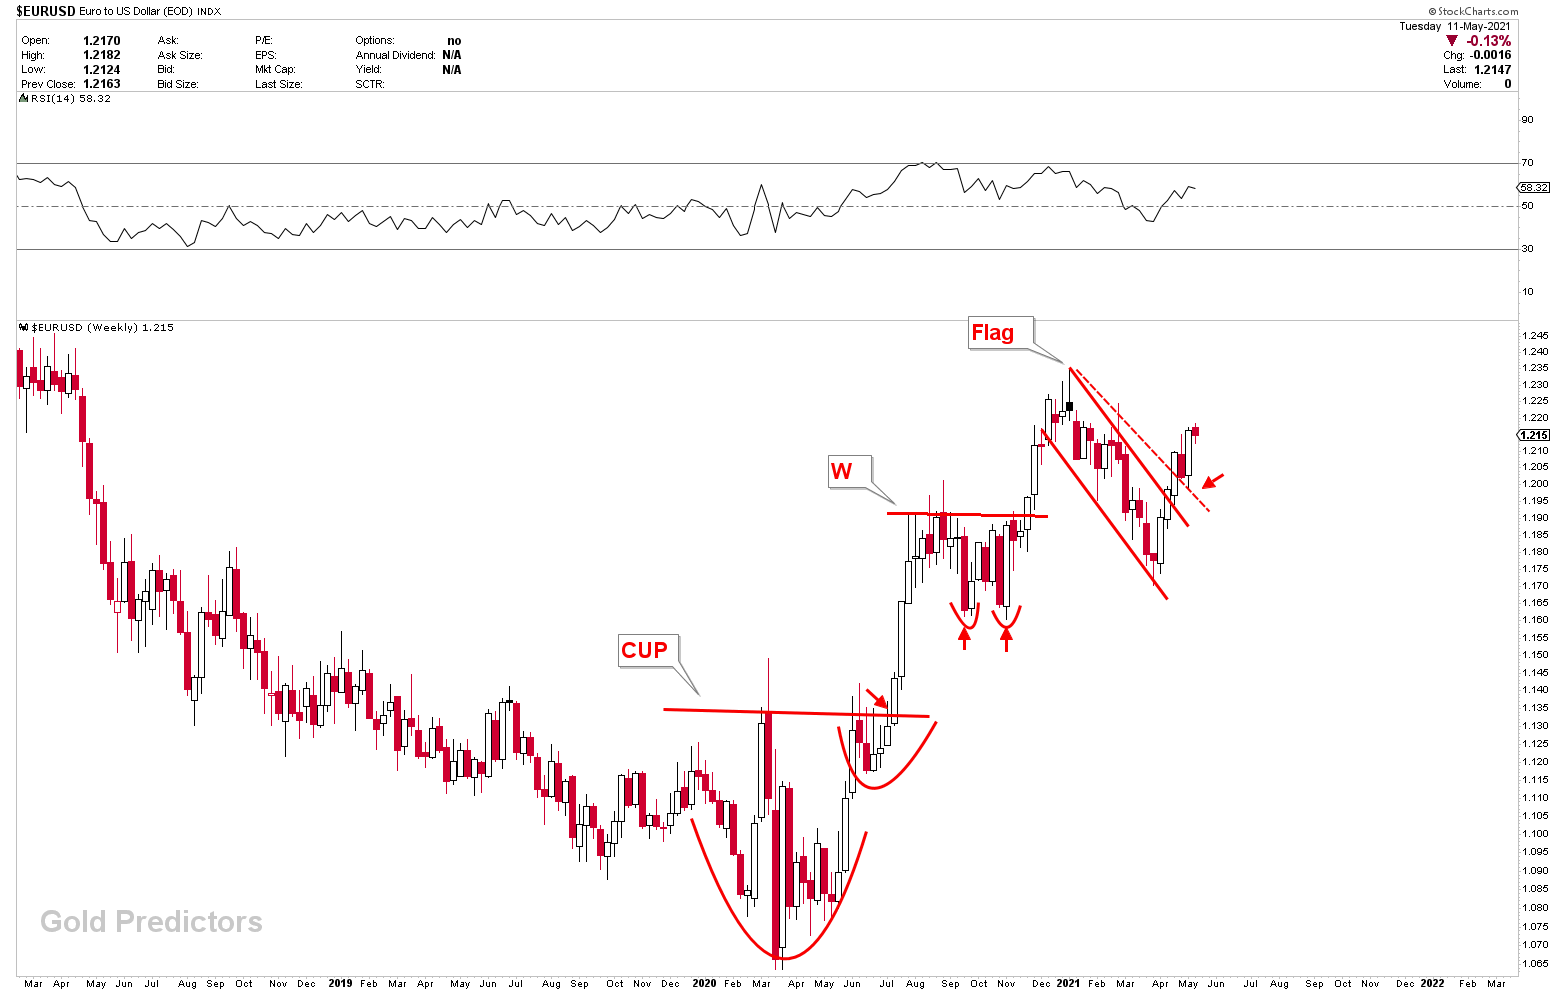
- Last week, the EURUSD retested the Flag and bounced back in a healthy manner to get back on track.
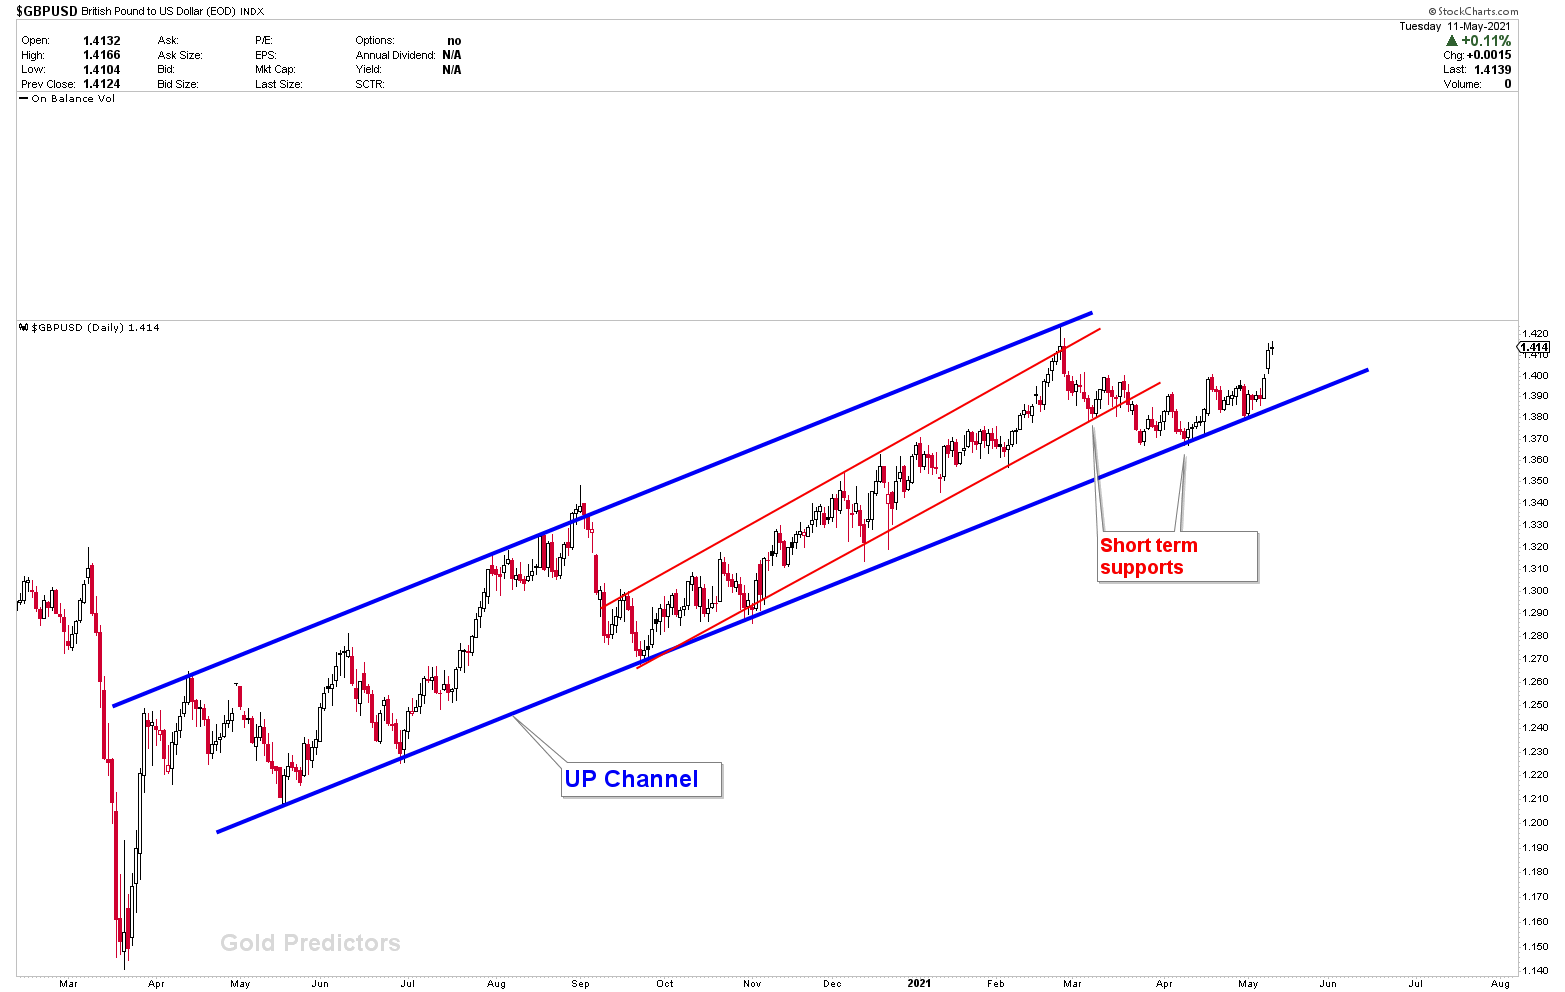
- The GBPUSD has been trading within a channel for the past few weeks. Last week, strong support provided a buying opportunity.
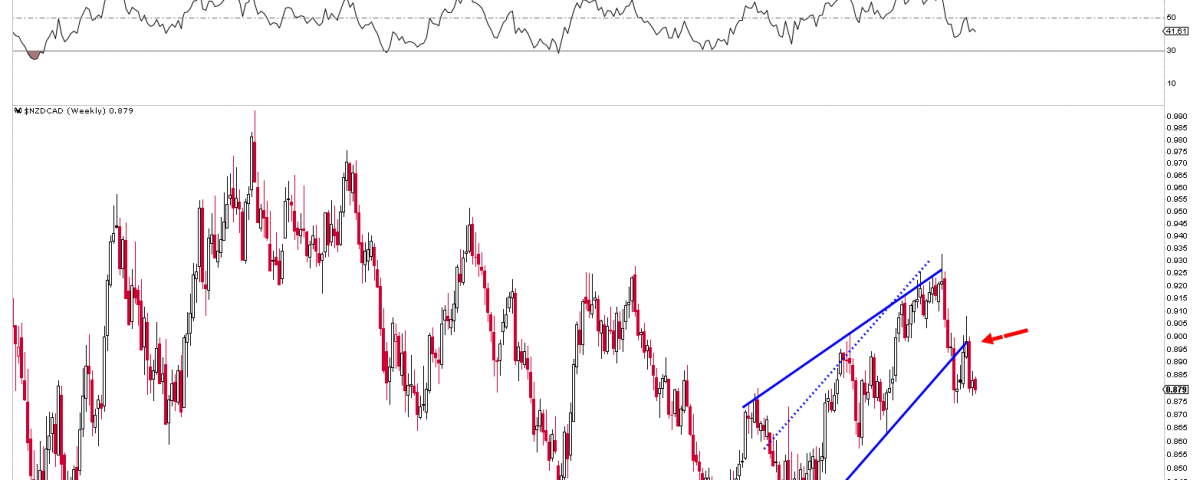
- The strength of the Canadian dollar triggered the NZDCAD and USDCAD to sell off.
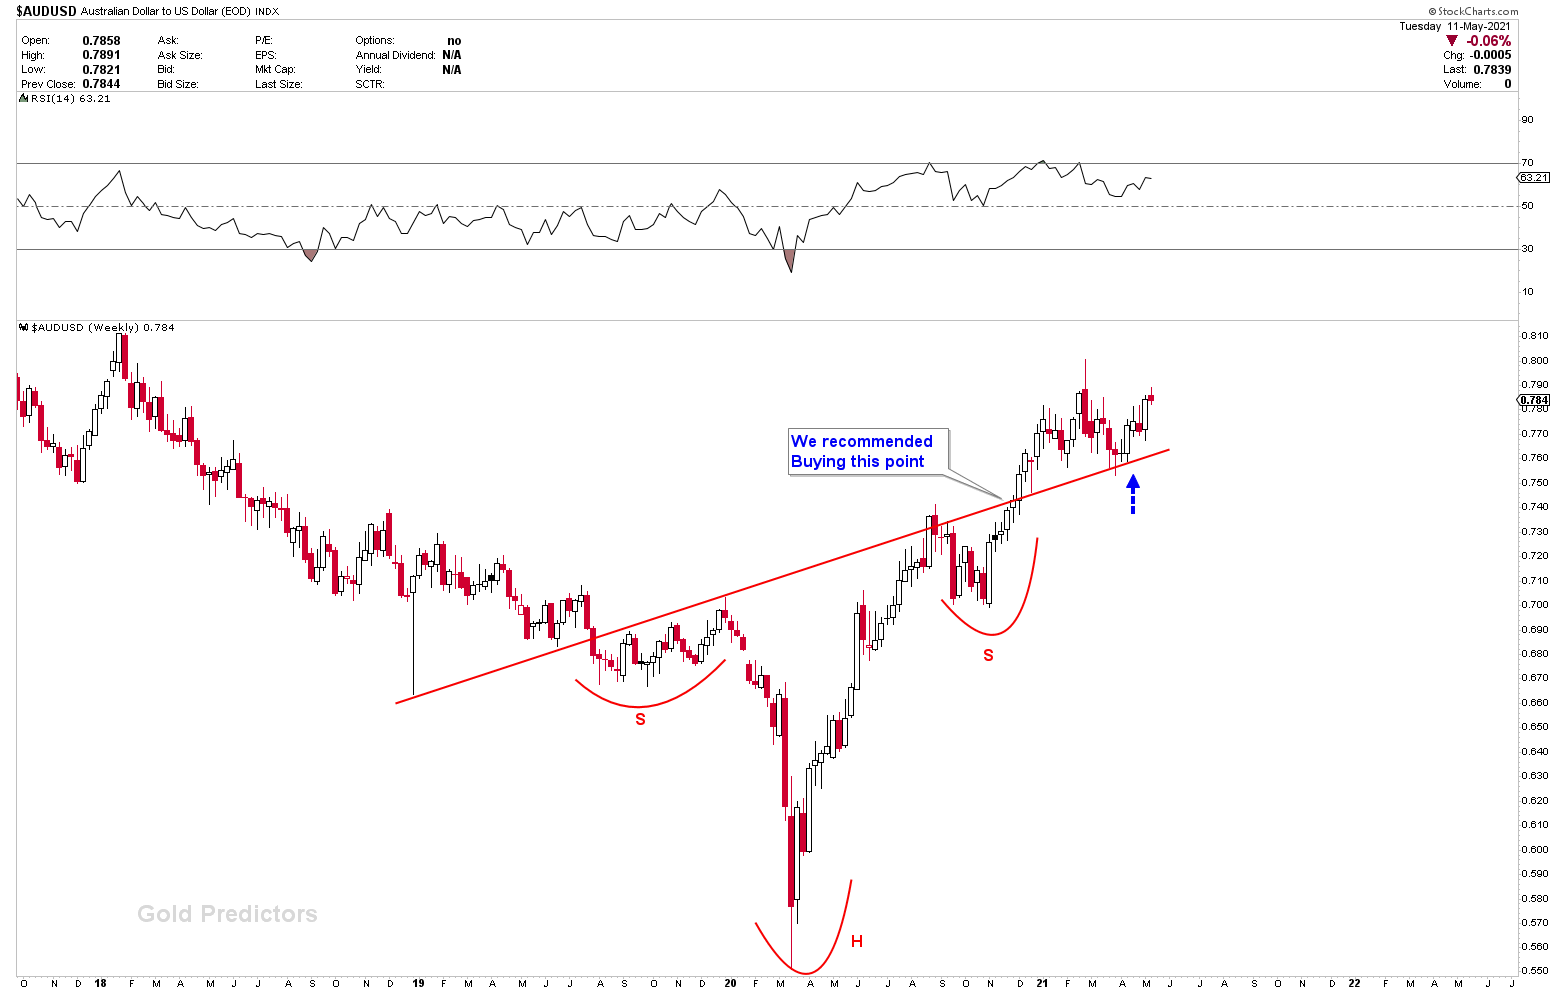
- On the neckline of the inverted head and shoulders, the AUDUSD produced another buying opportunity.
Weakest currency: USD
Strongest Currency: CAD, EUR, AUD
Best Instruments to Focus:
Short NZDCAD
Short USDCAD
Long AUDUSD
Long EURUSD
The US Dollar Poised to Go Lower
Last week, the US dollar breaks lower through the down sloping neckline and began to crash towards the dotted line, as shown in the chart below. As discussed in free article, the US dollar is currently trading on a long-term inflection on a monthly chart. A bounce may be established because the support is strong, but the last bounce seems to complete the patterns, and prices are expected to decline over the next week.
EURUSD and AUDUSD are the best instruments to take advantage as the US dollar breaks lowers. Prices have broken the flag formations over the complex CUP and W patterns, as shown in our previous EURUSD weekly chart. This indicates that prices are likely to grow. Last week’s retest of flag provided a fantastic buying opportunity.
The next instrument is the AUDUSD, which could benefit from the US dollar’s weakness. Last week’s retest of a breakout above the inverted head and shoulder was a good buying opportunity. Prices are expected to rise in the coming weeks and months.
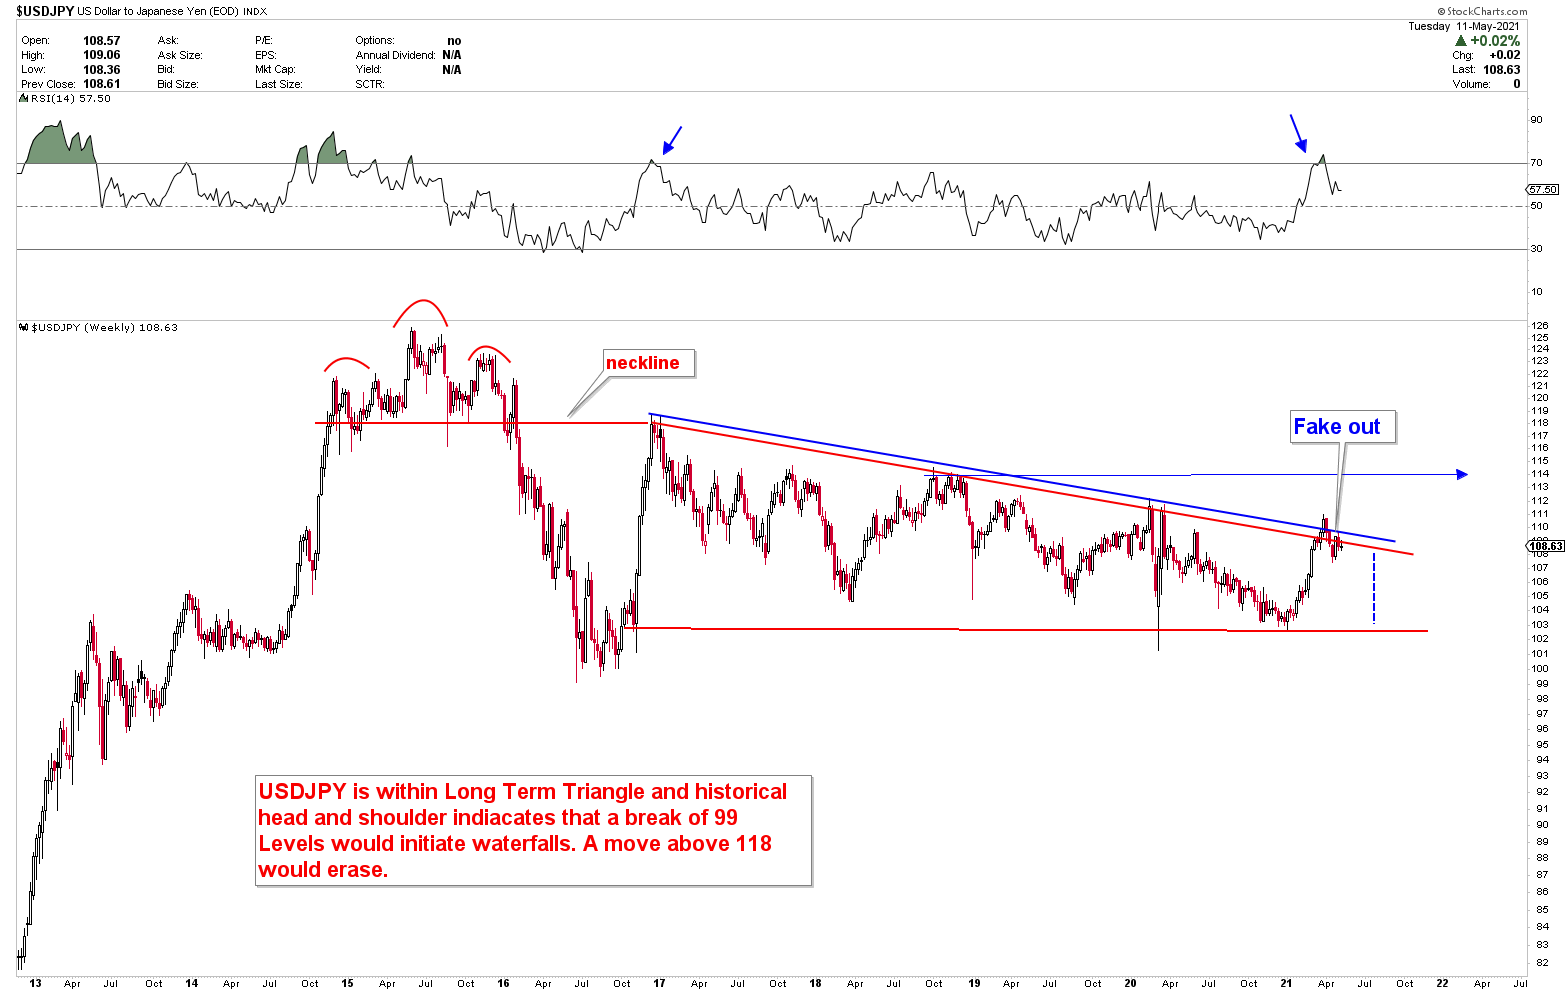
The USDJPY, which recently hit the triangle resistance, is another pair that has benefited from US dollar weakness. Last week, prices charted to the downside after hitting the triangle resistance. Because the instrument is highly volatile, large swings are possible. However, the primary path must continue to be downward.
Canadian Dollar Strength Persists
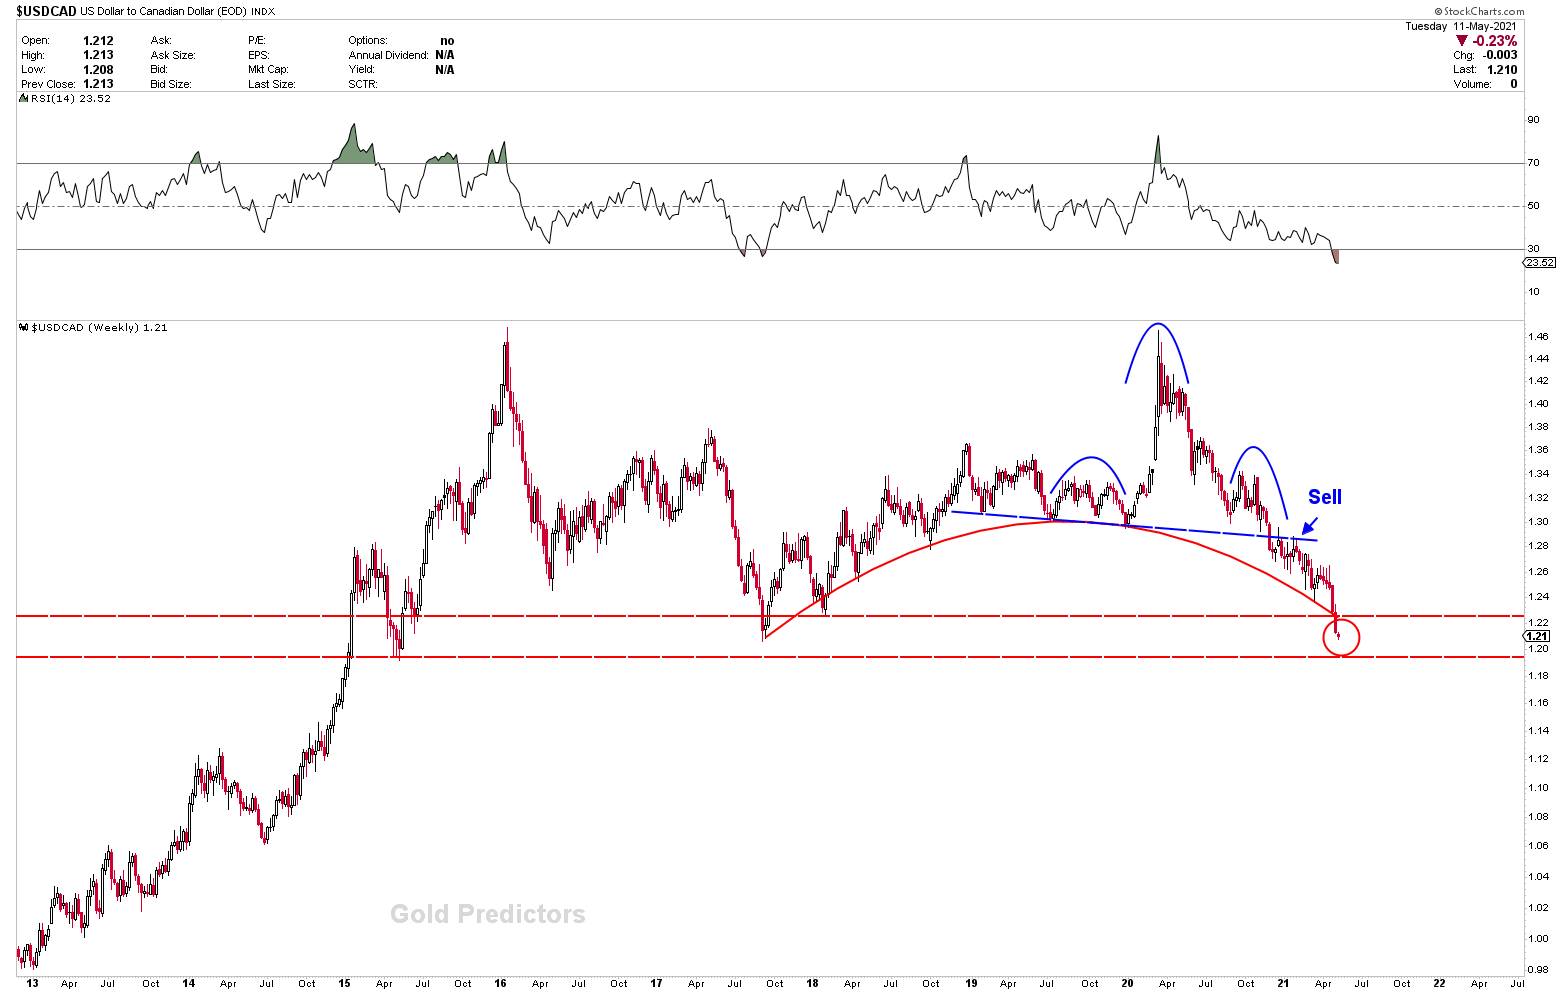
For the past few weeks, the Canadian dollar has been the most powerful currency. USDCAD and NZDCAD were the best instruments to take advantage of Canadian dollar strength. The USDCAD has developed a strong head and shoulders pattern. A retest of the head and shoulders was a selling opportunity, and prices are likely to fall over the falling curve. A read circle was used to mark the support levels on the chart below. Prices are likely to bounce back from the circle. However, due to strong bearish patterns, any bounce on daily charts must be viewed as a selling opportunity.
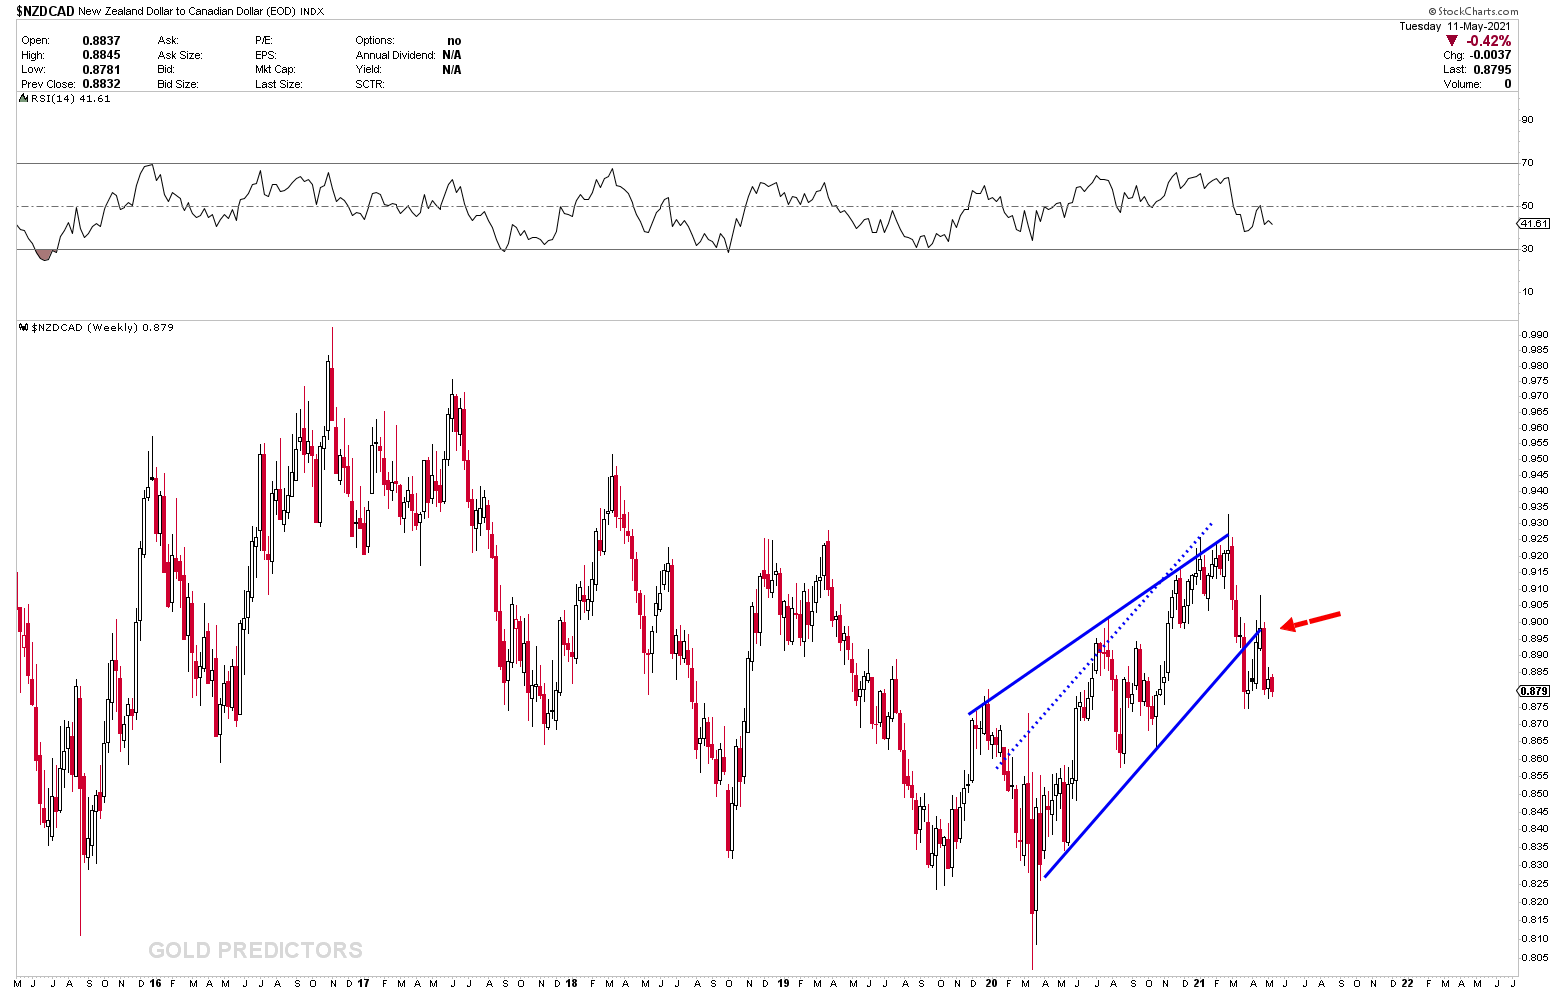
The NZDCAD is the next instrument which developed bearish patterns a long time ago. The chart we’ve been talking about for weeks has been updated. The rising wedge has been retested, and the price is now switching to the primary path. For the next few weeks, prices are expected to fall.
Pound Back on Track
Prices are on the verge of hugging the long-term blue resistance line. However, the chart’s development suggests that prices will rise. A strong pullback from the resistance is possible, but a breakout at any time should not be ignored. GBPUSD recently pulled back from a long-term resistance line, and if that pullback was sufficient, prices could break higher.
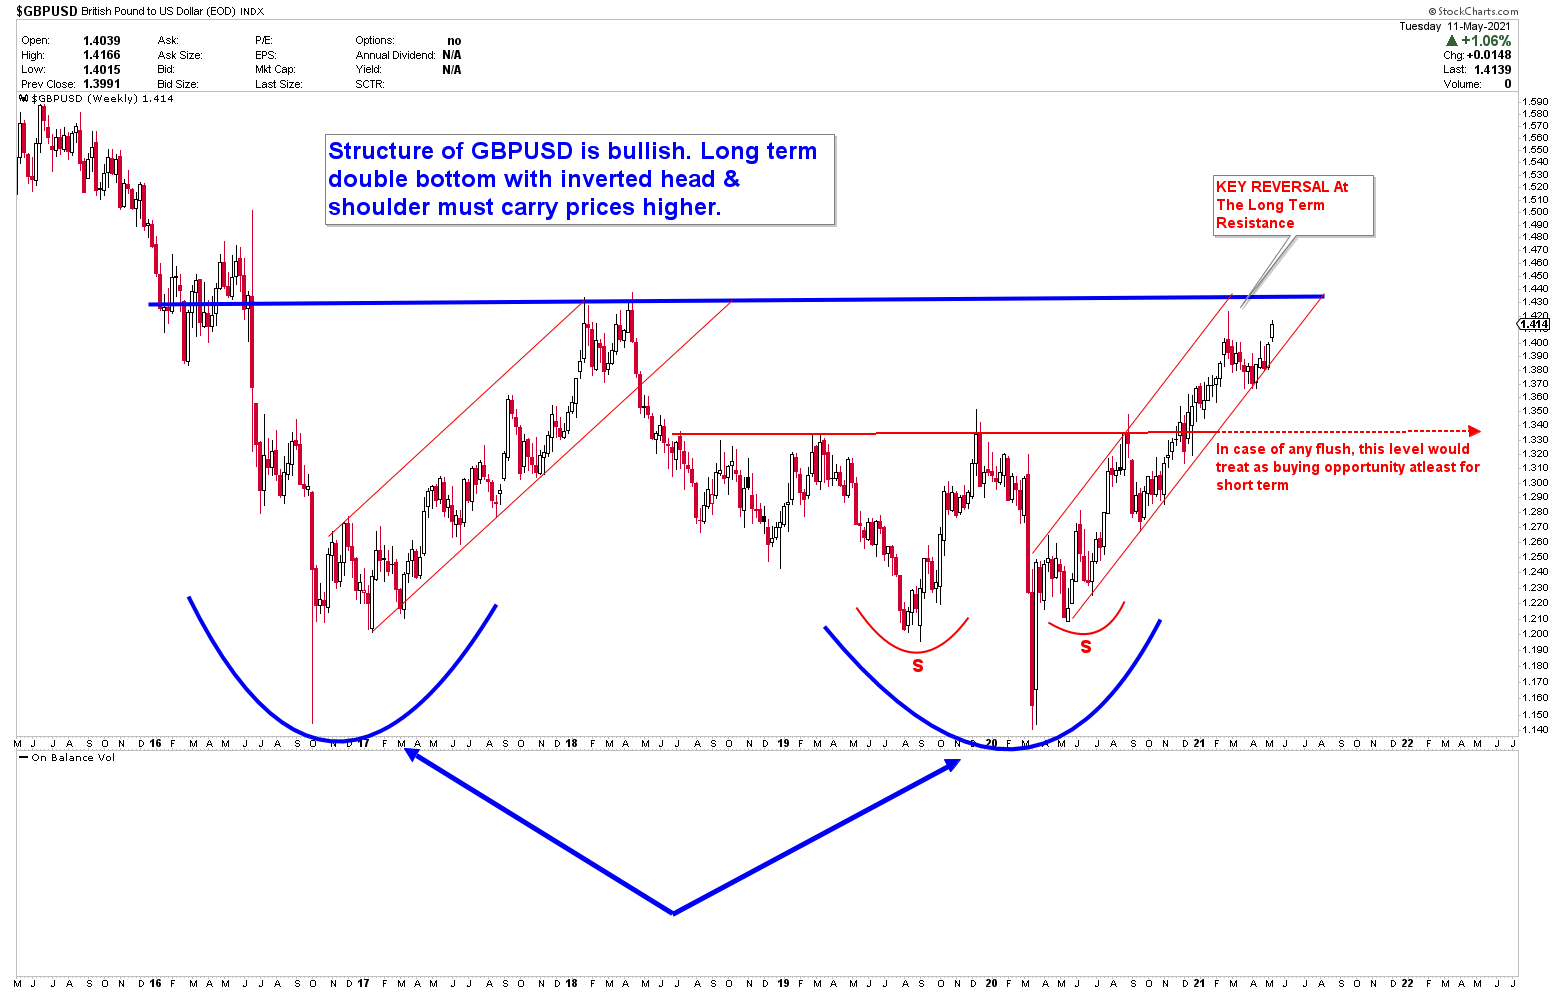
On daily charts, the GBPUSD pair was zoomed out, indicating that prices have been trading in the same channel as last month. On the support line, it created three buying opportunities, and prices are expected to rise from here.
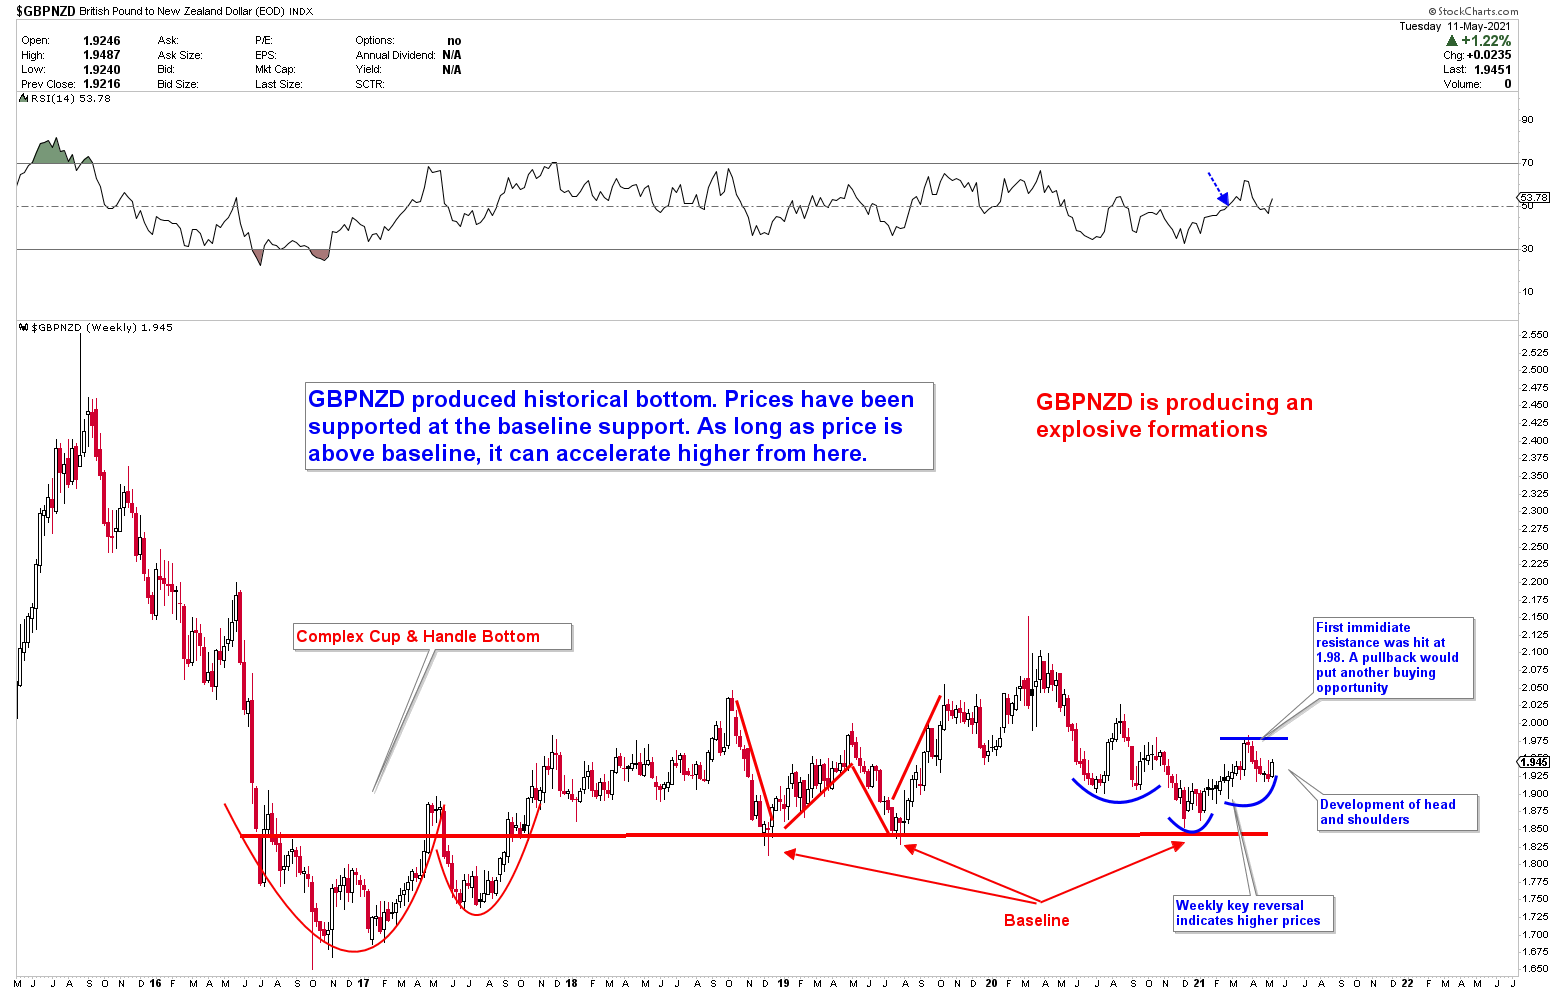
Let’s take a look at the weekly chart of GBPNZD. The historical complex CUP and HANDLE bottoms, followed by W patterns on the baseline, indicate that GBPNZD is about to soar. The 1.98 target was met, and a pullback from 1.98 appears to be completed. The instrument is expected to boom for the next few weeks and months once the pullback is over.
To receive the free trading alerts, signals and articles please subscribe as a Free member to the link below.


