


Technical Picture of Long Term Gold
The article impersonates the research on the opportunities for long term investors intending to obtain gold or accumulate their positions for long term gold security. The chief drivers of gold prices in 2019 are,
- Higher demands generated by governments in recent years. Central banks buying exercises.
- Speculative activities designed by India and Russia.
- Specific demands formulated by cryptocurrency insanity
- Global uncertainty formed by intensifying geopolitical contingencies and economic uncertainty.
- Technological and environmental transformations.Growing geopolitical conflicts between the US and China
Current Comprehensive Scenario
The gold market is having huge demands generated by governments. Heightened geopolitical and economic risks during the year increasingly forced central banks to expand their stores and re-focus their concentration on the principal objective of investing in safe and liquid assets. Russia is “de-dollarizing” its reserves, bought, 274.3t in 2018, financed by the almost entire sale of its US Treasuries holdings. Russia’s gold reserves have risen for 13 sequential years, arising by 1,726.2t over the period to total 2,113 at the end of 2018.

Following the inclination of gold demand by governments in 2018, it is prognosticate that the interest will continue to develop in 2019 and that will become one of the principal drivers of gold prices in the year 2019. Through studying at the technical side of gold, it is no surprise that fundamentals are totally synchronized with technical. While studying the gold graphs, it is remarked that gold prices must shoot extraordinary on a long term basis but the significant problem is HOW and WHEN?
Let’s examine a few charts to elaborate on answers to these questions.
Due to massive evaporation in currency markets, geopolitical uncertainty and central banks liquidity of gold demand, figures are challenging to divine accurately, consequently, in order to analyze during this situation by knowing the heavy volatility, we have distinguished the alternative cases for gold.
Case 1: Gold is Bull with NO Major Correction (90% probability)
Gold is soaring, with 8 years cycle low in place. We have recognized the 8 years cycle in 2016 when the price was trading at $1150/ounce by doing an instant update to all our premium members. According to our scientific model, December 2015 was determined to be the significant Low in Gold and this prophecy was validated as after that Gold has not acted under this level and 2.5 years are passed. This situation is soon transforming. Through every 8 years cycle low, a sharp peak is scheduled to produce specifically in the 3rd year of the foundation. In that case, early 2019 must be the astute peak, and we are however appraising that fresh hit to 1347 did already the 3 years overhead top. (if our evaluation is true then 1200 district should happen promptly in a few weeks.) (Premium Members-Please stay tuned for the monitoring of sharp fall in gold in recent weeks after our evaluation)
Let’s try to understand this scenario in deep using illustrations.
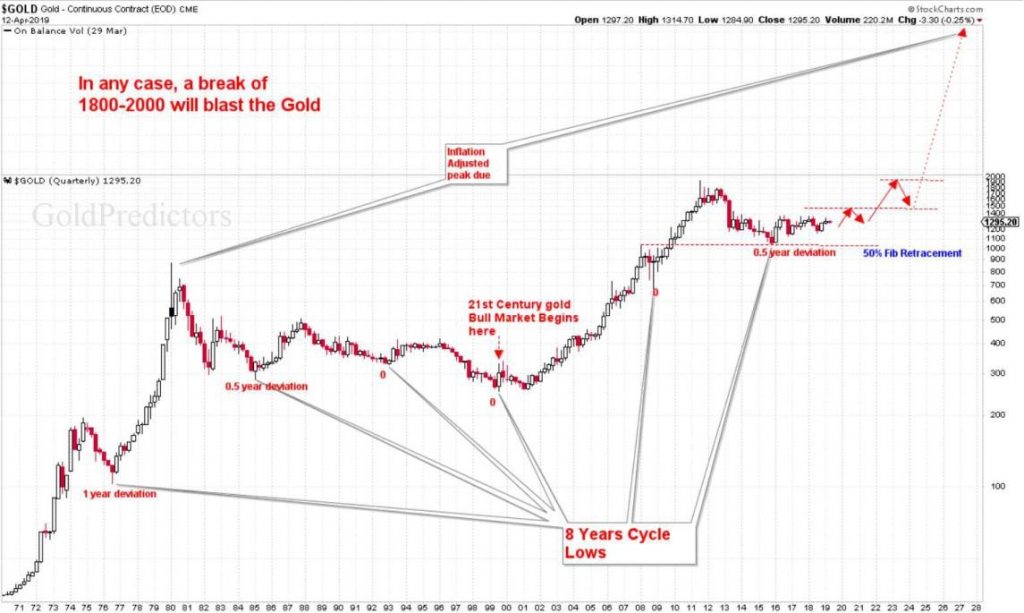
In the earlier graph, it is simply declared that after the 21st-century gold bull market commenced, gold is distinctly overseeing higher by long supports. The peak was formed in 2011 but the aforementioned top does not seem to be the authentic top according to inflation adjustments. If we anticipate the top of 2011 with a top of 1980’s then it must rest somewhere around $3000/ounce. In brief, gold is proceeding gradually and there is a huge obstacle at 1400-1500 and once it is realized, gold will explode.
Due to geopolitical uncertainty, leading liquidity furthermore central banks actions, higher demands coming from India and Russia, the prices of gold are quite unpredictable. The truth is that drivers of gold prices drive the market although the game behind the door is different. If fundamentals are so convinced that doesn’t indicate that prices of gold will be positive. The market always kicks out traders and investors from the game before prices regulate with fundamentals and technical. In uncomplicated terms, if gold starts to trade negatively before a bull leg starts, then the outlook will display as shown in the figure.
Case 2: Gold is Bull with Last Major Correction to 800-900 (Not Favored- Only 10% Probability)
The earlier figure demonstrates the concept of dropping gold before it launches. If gold declines, then the supreme support will be the 800-900 level which is 61.8% retracement of the 21st-century gold bull market and tested the support from the top of 1980. If this occurs, Gold Predictors will originate a CONFIRMED long term gold Bull signal for Long term traders and Physical Buyers (Depending on price patterns). Some investors are anxious about this case, if such happens then it will need time to finish current sideways. But my response to them is
“You are Lucky if this case develops as that is an outstanding opportunity to add your Physical gold”
Well, the time period for the aforementioned case might be the year 2024? (Maximum) (As 2024 is next 8 year but with the divergence of secondary cycles ”Will elaborate to premium members in details”) but it may arrive early.
Gold Formation
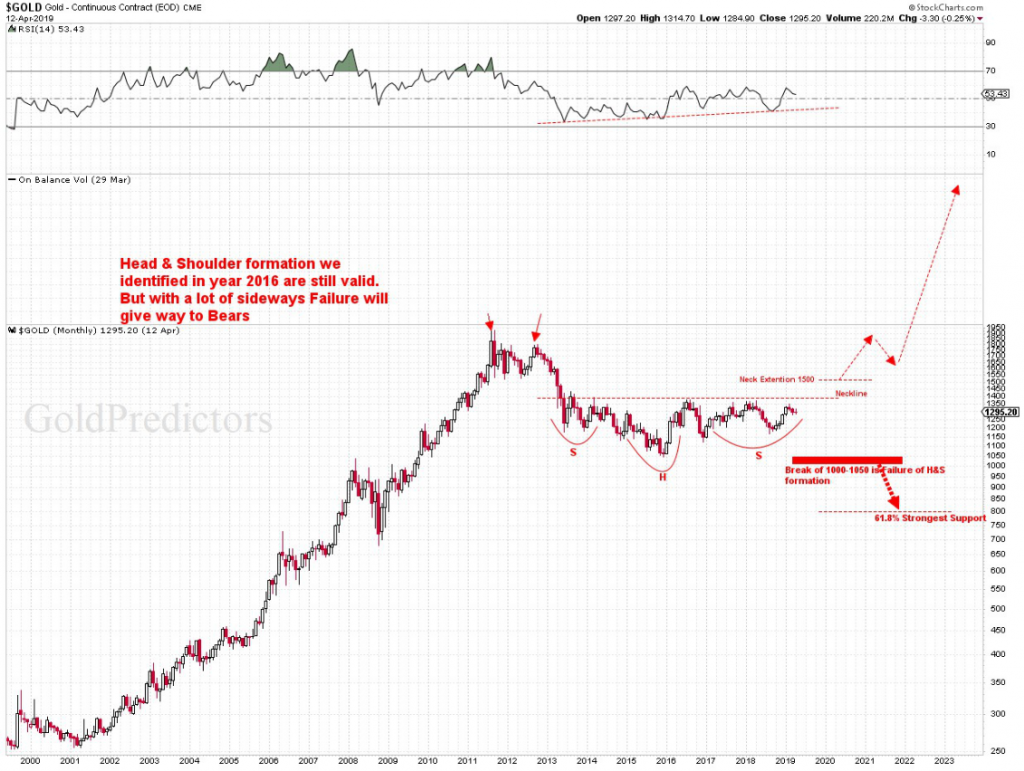
By zooming out the graph, we can clearly recognize the development of remarkable patterns. It is obvious that Inverse head and shoulder is emerging in gold prices. If prices breach the neckline at 1370-1430 zone then prices will commence to boom and this bang will be pretty sharp. However, there is another elongated neckline at 1500, which is a very significant level in gold history hence the 1500 level needs to be breached in order to authorize the Inv. H&S patterns.
On another hand, if prices breach the $1000/ounce level, the patterns will be eradicated and prices will commence trading deep towards second major support of 61.8% retracement as depicted in the previous chart.
Weekly candles points Lower Short Term for Good Buying Opportunity
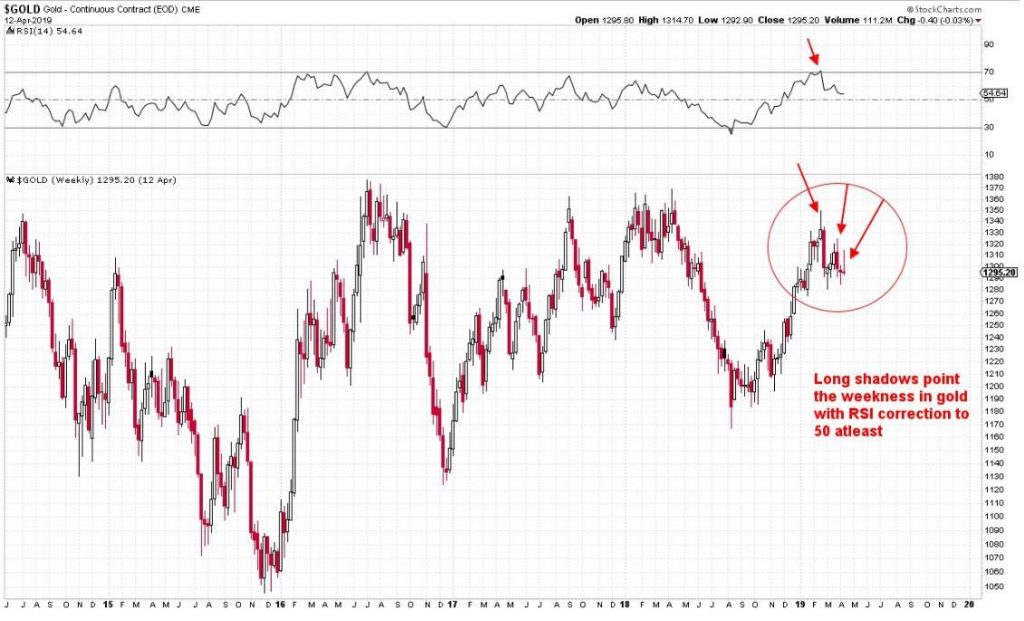
As depicted in the above chart the long shadows in weekly candles point out the weakness in prices and sharp correction towards lows. The weekly chart is now entirely pointless and sideways. There are big ranges to develop. The beak of those sideways is usually tremendous growth but let’s say if the pattern tears out, the process will provide remarkable opportunities for the investors and if patterns break upside then prices will originate to move much steeper from here.
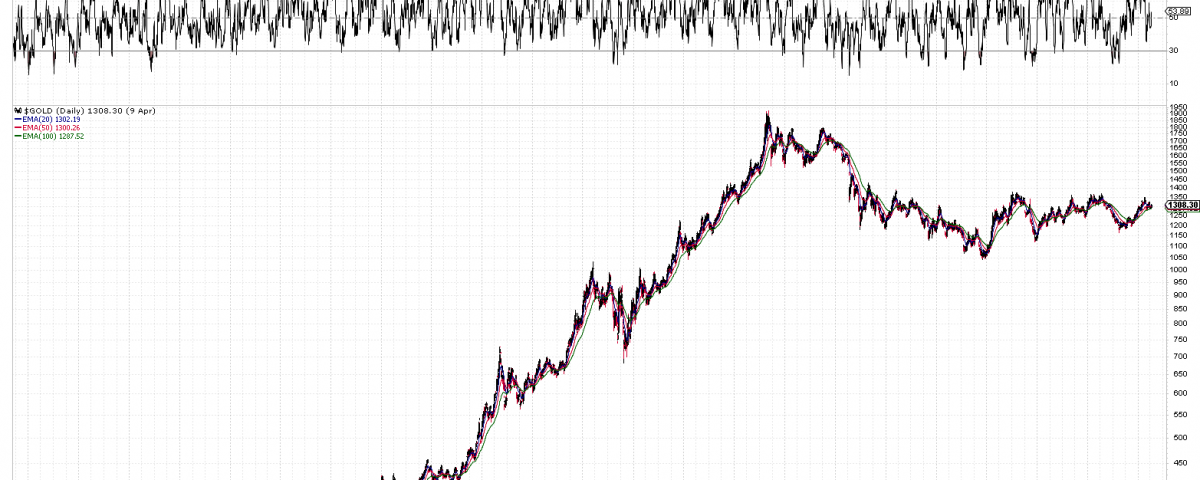
Daily Charts Indicate Weakness
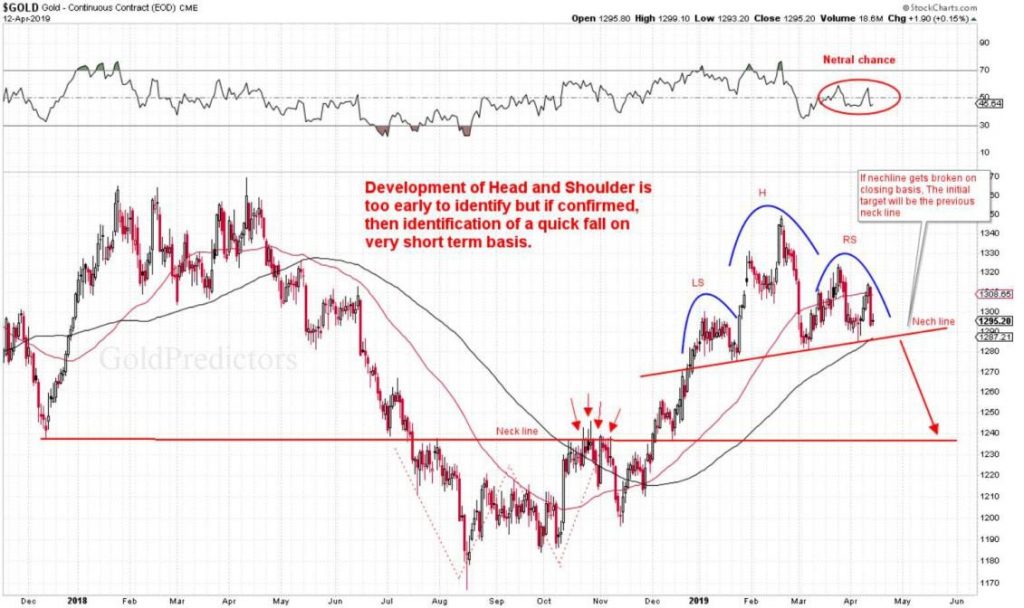
The blue head and shoulders are where prices spring to collapse. The neckline lies at 1282 which is a climbing neckline, suggesting a further sideways in the near prospect. A daily candle close beneath 1282 will unlock doors for next support which is the neck of W pattern at 1233-1240. So short term traders are encouraged to sell gold when there is any close below 1282. Well, premium members of goldpredictors.com are already short from 1307 and are already having a huge profit.
Time to Buy Physical Gold
According to the above-mentioned investigation, it is apparent that gold has to trumpet one time but when? It depends on the conditions stated in the preceding segments. To buy physical gold is a difficult discipline for investors. But for those who are watching me since the year 2012, they know how I trade. Investors cannot obtain Physical Gold for the short term, their objectives must lie in the long term.
For investors to expand their positions, I issued 2 Buy spots. One spot was USD 1000-1150/ounce range in the time period of October 2015 to February 2016 when 8 years cycles were diverging with Intermediate term cycles and that produced a Perfect Zone for Gold buyers. The second spot was 800-900 region. As time appeared early we went with the first zone.
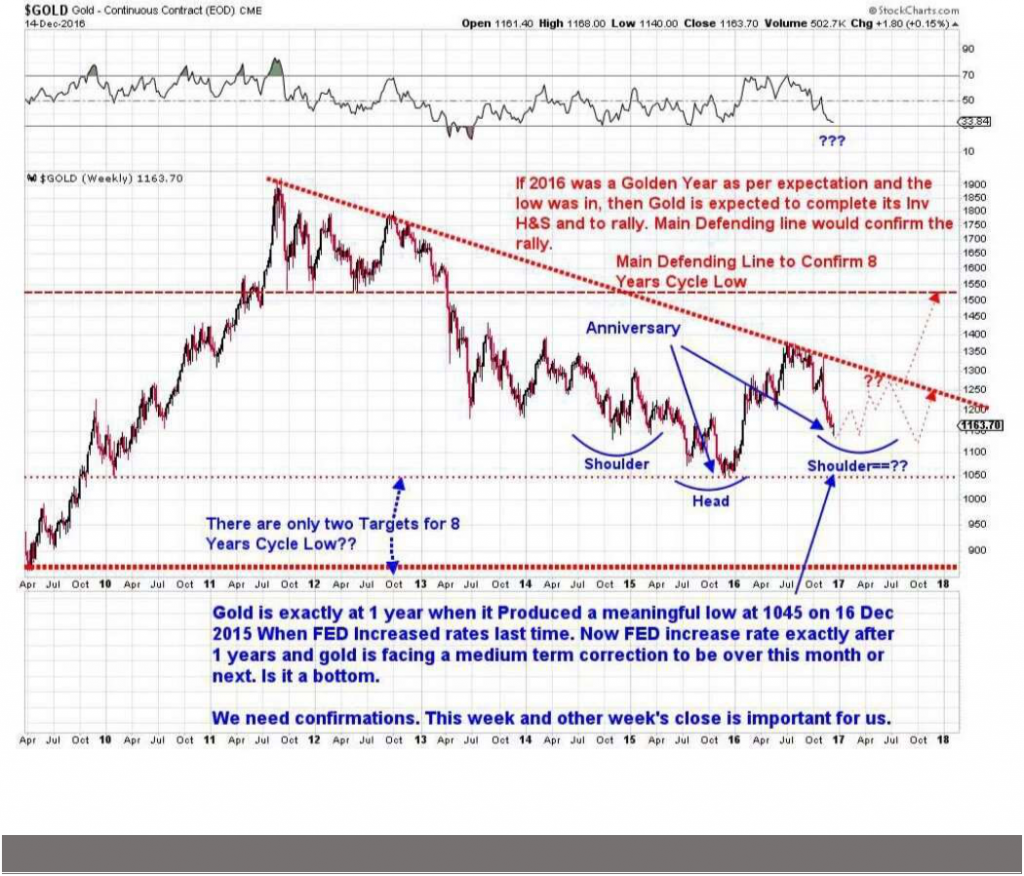
When the opportunity arose I published the article in December 2015 and declared 1150 as the Buying Spot. Investors supplemented their positions. Gold offered a Bottom at 1142 and that was so shocking that appears so true. And the second positions was at 1163 in December 2016, when the anniversary of gold lows arrive.
Here is the old chart is extracted from my diaries.
Note for Physical Gold Investors
This is not the season for buying physical gold due to a sideways pattern. Now for adding physical gold, those who already missed my entries, they will need to hold on and add at 800-900 zones. I will issue the signals when it happens. Unless the signal may come within the sideways patterns if any conflicting cycle rendezvous.
Final Note: The speculation in the gold market is now growing difficult with time. There are various circumstances which will be covered in premium sections. But the most significant factor is the current technical sideways actions which need to break in any direction before a next move develop. The positive fundamental does not indicate that gold prices will soar. There might be some crashes before the prices regulate with the fundamentals. To track these failures, it is best to be careful until the figures present any evidence. Short term cycles region influenced by these sideways actions. Short term traders should watch into selling gold next week as the patterns are formed to quit negative. Look for Tuesday and Wednesday big decline. A bottom of the week may generate on Wednesday at 12:30 PM (US time) {calculated according to my invented scientific model of cycles}.


