


Silver Builds Structural Breakout After Clearing Key Pivot Levels
Silver (XAGUSD) has regained strong momentum and is now testing a major resistance zone that capped previous rallies. Price broke out of a well-formed inverted head‑and‑shoulders pattern and continued to build strength through multiple pivot levels. At the same time, the silver-to-Dow ratio has broken above a key horizontal barrier, signaling an improvement in relative performance. With both price action and the ratio turning higher, the setup points to a potential shift toward a stronger structural phase for silver.
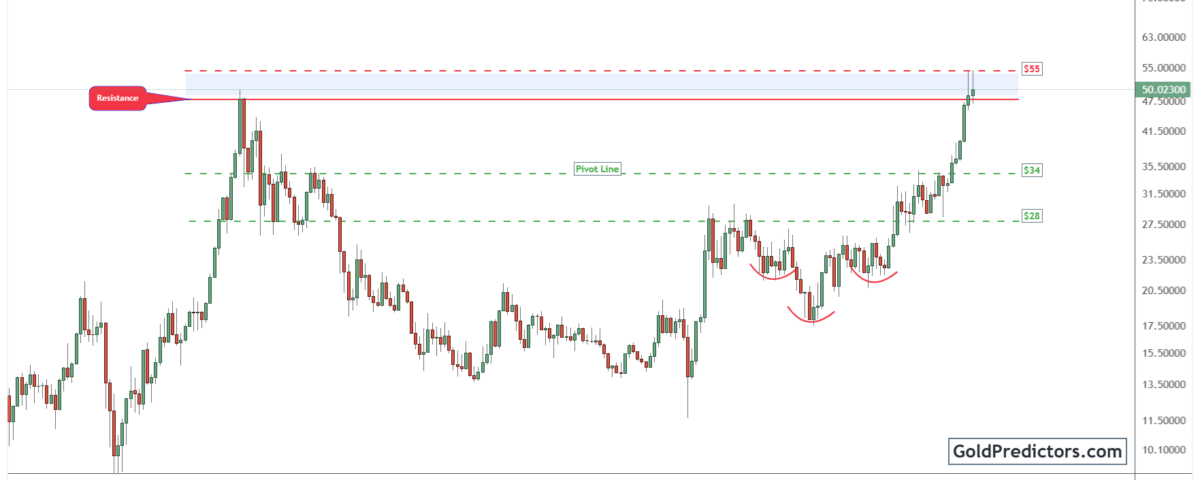
Silver Approaches Multi-Decade Resistance after Clearing Key Pivot Zones
The silver chart below shows strong upward momentum, with price now testing key resistance. This move began after silver broke out of a long-standing inverted head-and-shoulders pattern. Momentum accelerated as the breakout cleared multiple resistance levels. Silver surged past key pivot zones at $28 and $34, confirming sustained strength. It has now returned to the critical $50–$55 zone, a central ceiling that has capped past rallies.
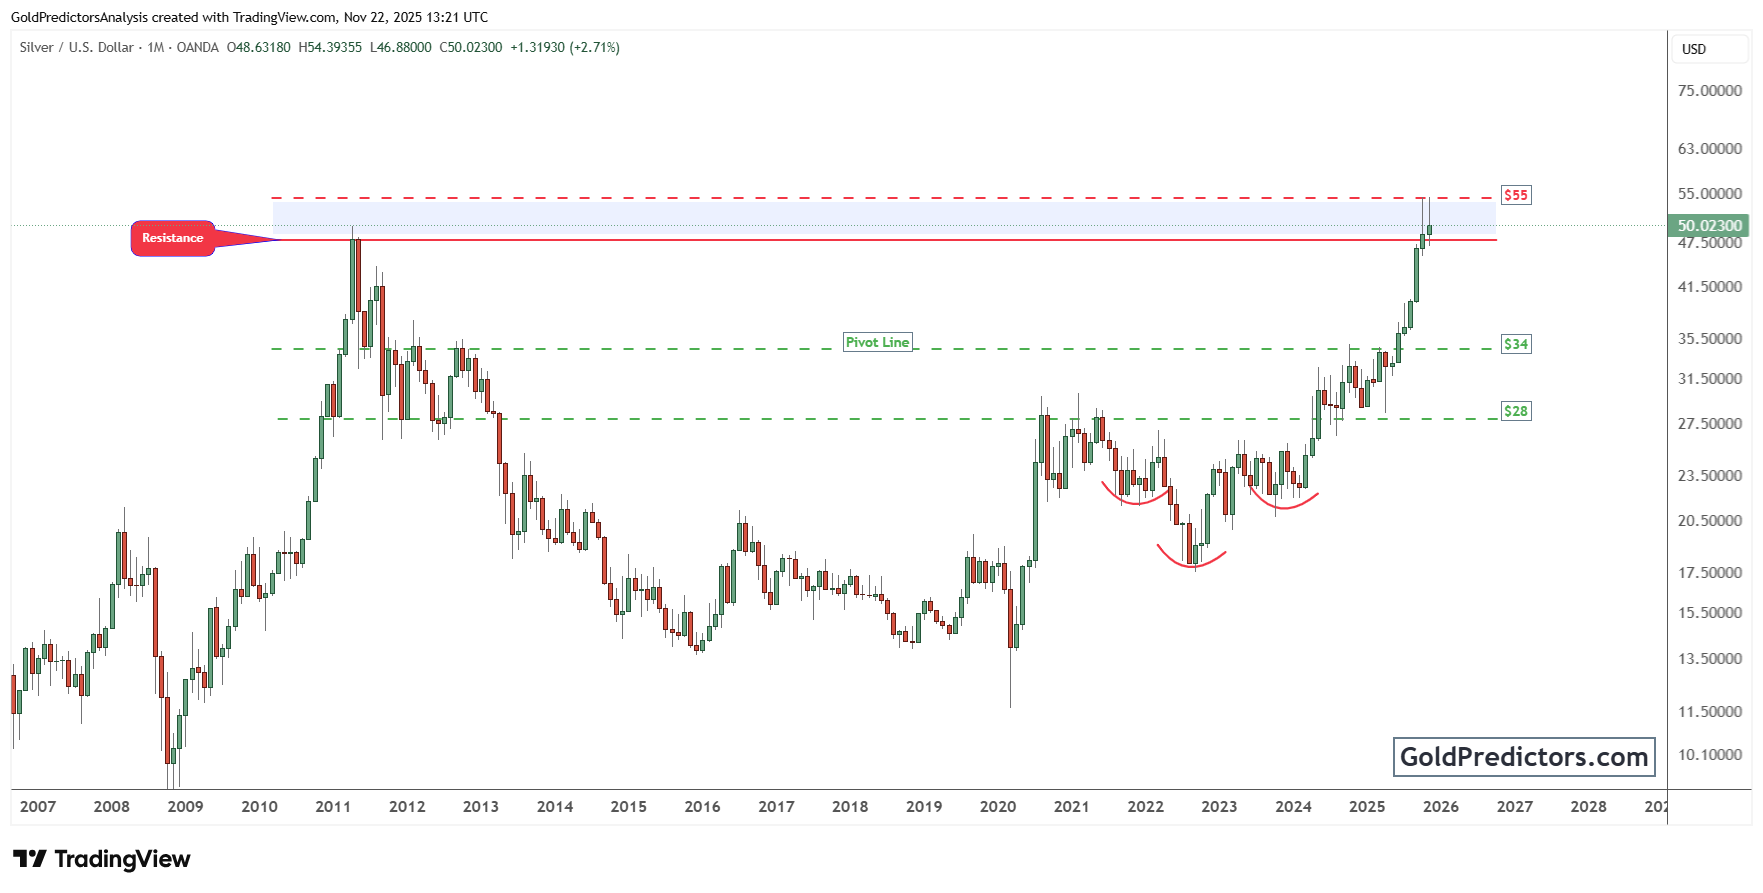
Previously, this zone acted as a significant barrier, capping silver’s upward move during the 2011 peak. At that time, the metal failed to sustain momentum and underwent a sharp reversal. However, this time, the setup appears more constructive. The move into this zone is supported by stronger technical structure and broader macro tailwinds. A well-defined inverted head-and-shoulders setup signals a constructive base and growing bullish momentum.
Silver’s recent advance appears to be part of a broader shift rather than a temporary reaction. It suggests that the metal may be entering a new phase of valuation. The breakout has emerged from an inverted head-and-shoulders formation, supported by sustained momentum. A clear move above the $55 barrier would confirm a structural shift and open the door to a potential price discovery phase. Breaking this resistance could propel silver into previously uncharted territory, offering considerable upside potential.
Silver-to-Dow Ratio Breaks Out, Signaling Long-Term Relative Strength
The chart below displays the silver-to-Dow ratio, providing a long-term perspective on silver’s relative performance against the equity market. For decades, the ratio has fluctuated within a broad triangular formation, characterized by lower highs and a steady base. This structure highlights silver’s extended underperformance during the multi-decade bull run in stocks.
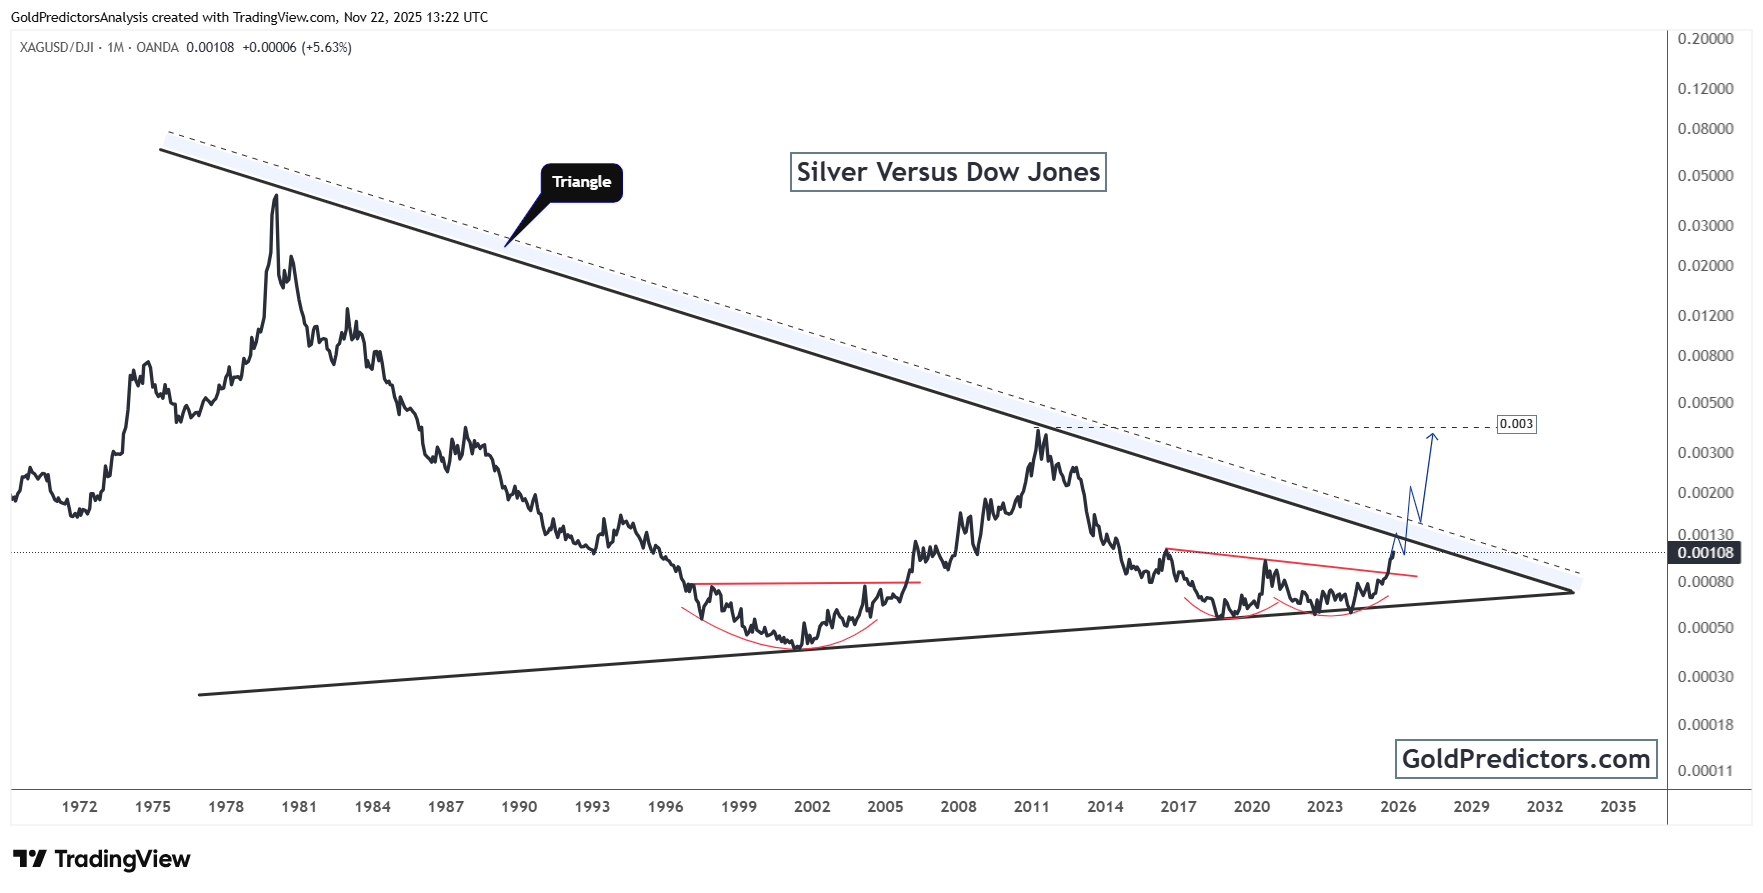
However, the chart now shows a clear breakout above a key horizontal resistance level, supported by a base shaped by two rounded bottoms. This formation indicates a sustained period of consolidation and development of support. The move aligns with silver’s recent price strength, suggesting the metal may be entering a phase of outperformance relative to equities.
Based on the current setup, the projected move targets a ratio of approximately 0.003, indicating significant outperformance against the Dow. Historically, silver has gained strength against equities during times of monetary stress, inflationary pressure, and broader financial instability. The current backdrop is marked by geopolitical tensions, rising sovereign debt, and evolving central bank policy. These factors may set the stage for a renewed rotation into hard assets, such as silver.
Conclusion: Silver Approaches Structural Breakout with Rising Momentum
Silver is approaching a key level as the price moves toward the multi-decade resistance zone near $55. Unlike previous rallies that failed at this level, the current advance is underpinned by stronger technical structure and macroeconomic support. A well-formed inverted head-and-shoulders pattern and sustained momentum through prior pivot zones indicate a more durable foundation for this move. A clean breakout above $55 would confirm a major structural shift and could lead to an extended period of price discovery.
At the same time, the silver-to-Dow ratio has moved above a critical horizontal resistance level, following the completion of two rounded bottoms. This development suggests a potential reversal in silver’s long-standing underperformance relative to equities. While the broader triangle formation remains intact, this early breakout signals growing relative strength. It also supports the case for silver taking the lead in the next phase of the macro cycle.
Overall, these technical signals and macro conditions highlight a bullish setup for silver in both nominal and relative terms. A sustained breakout may trigger renewed institutional interest, particularly as global uncertainty deepens. With rising geopolitical tensions, mounting debt burdens, and shifting central bank policy, demand for stable, real assets is likely to accelerate. In this environment, silver stands well-positioned to reclaim its place as a core holding within the broader hard-asset rotation.
Gold Predictors Premium Membership
Get exclusive short-term and swing trade ideas with precise entry levels, stop-loss, and target prices, including justification and analysis — all delivered directly via WhatsApp.
Our premium service includes deep technical analysis on gold and silver markets. We cover cycle analysis, price forecasting, and key timing levels.
Members also receive a weekly market letter with detailed analysis, commentary from our Chief Analyst, including actionable insights, trade timing, and direction forecasts for gold and silver.
Stay ahead of the market — join our premium community today.


