


Silver Breaks Key Resistance: Long-Term Bullish Setup Points to $100 Target
Silver (XAGUSD) has broken decisively above a multi-decade ceiling that rejected every major rally since 1980. The breakout completes a massive cup and handle formation and signals a major structural shift in the long-term trend. Price now holds above the $55 level with strong momentum and technical confirmation. At the same time, the S&P 500-to-silver ratio has broken below key support, highlighting a broader rotation out of equities and into hard assets. These developments point to a potential long-term move toward the $100 region. A correction from $84-$85 might develop, but this will be considered as a buy signal to target $100 or higher.
Silver Surges Above Multi-Decade Ceiling With $100 Target in Sight
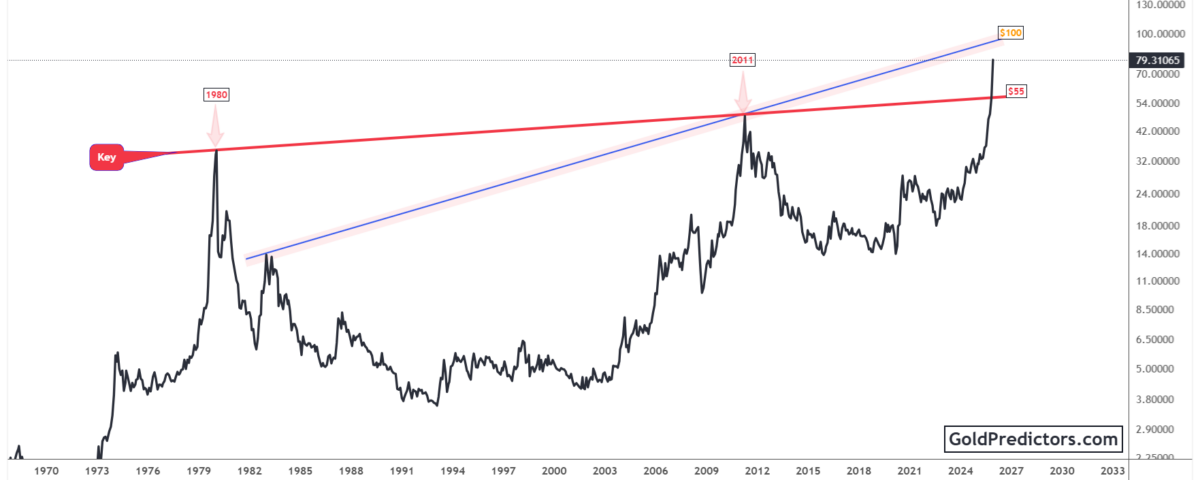
The silver chart below shows a clean breakout above a multi-decade resistance that capped rallies for over 40 years. The red trendline, drawn from the 1980 and 2011 peaks, acted as a multi-decade ceiling and rejected every major rally for more than 40 years. In 2025, silver closed above this barrier with strong momentum, clearing the $55 level. This breakout completes a multi-decade cup and handle formation, signaling a major shift in silver’s long-term trend.
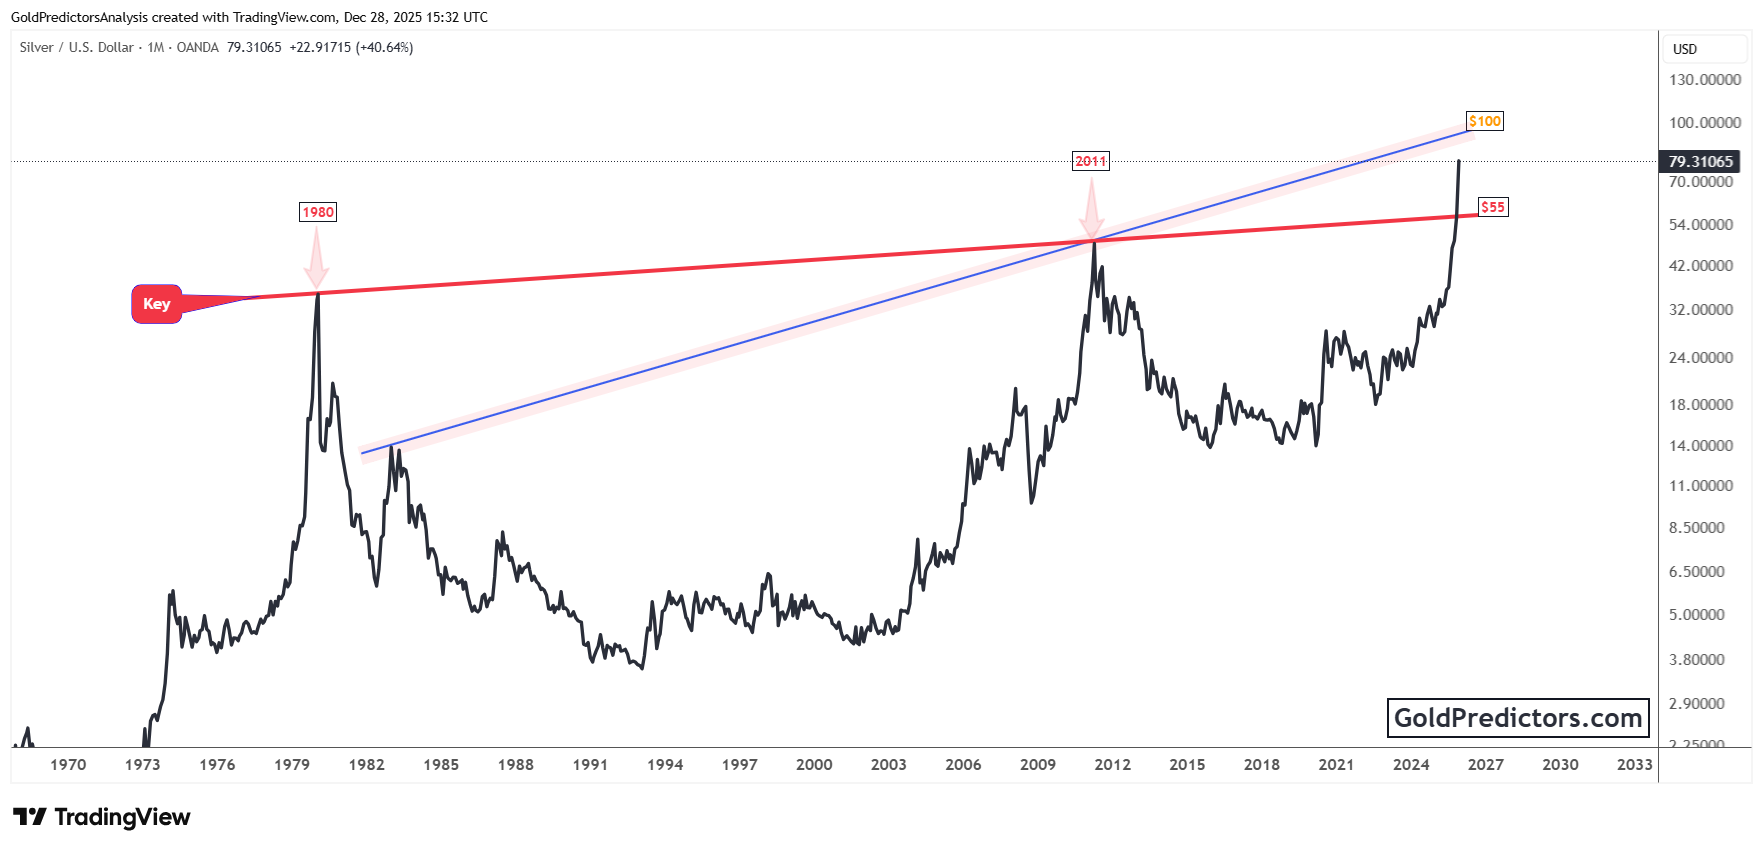
Historically, the pattern has shown repeated failures near the $50 level, each followed by a sharp reversal. Silver reached this threshold in 1980 and 2011, but neither rally resulted in a sustained uptrend. In both instances, the moves lacked structural support and quickly lost momentum. On the other hand, the current breakout appears more durable. A well-defined technical base, stronger macroeconomic tailwinds, and a confirmed move above multi-decade resistance back it. This breakout sets the stage for significantly higher long-term upside.
Silver is now positioned to potentially reach the $100 region, supported by strong breakout momentum and alignment with its long-term trend. This upside zone corresponds with the rising blue trendline that began in 1983 and intersects the 2011 retracement area. The path now points decisively toward the $90–$100 resistance band. Silver’s breakout above long-term resistance confirms a structural shift and signals the start of a broader revaluation phase that could unfold over several years.
Silver Gains Momentum as S&P 500 Ratio Breaks Long-Term Support
The chart below shows the S&P 500 versus silver ratio, a key gauge of capital flows between equities and hard assets. This ratio has historically followed a pattern of rising equity outperformance followed by sharp reversals toward hard assets. Each major peak in the ratio has preceded a significant drop, suggesting cyclical capital rotation from equities to silver.
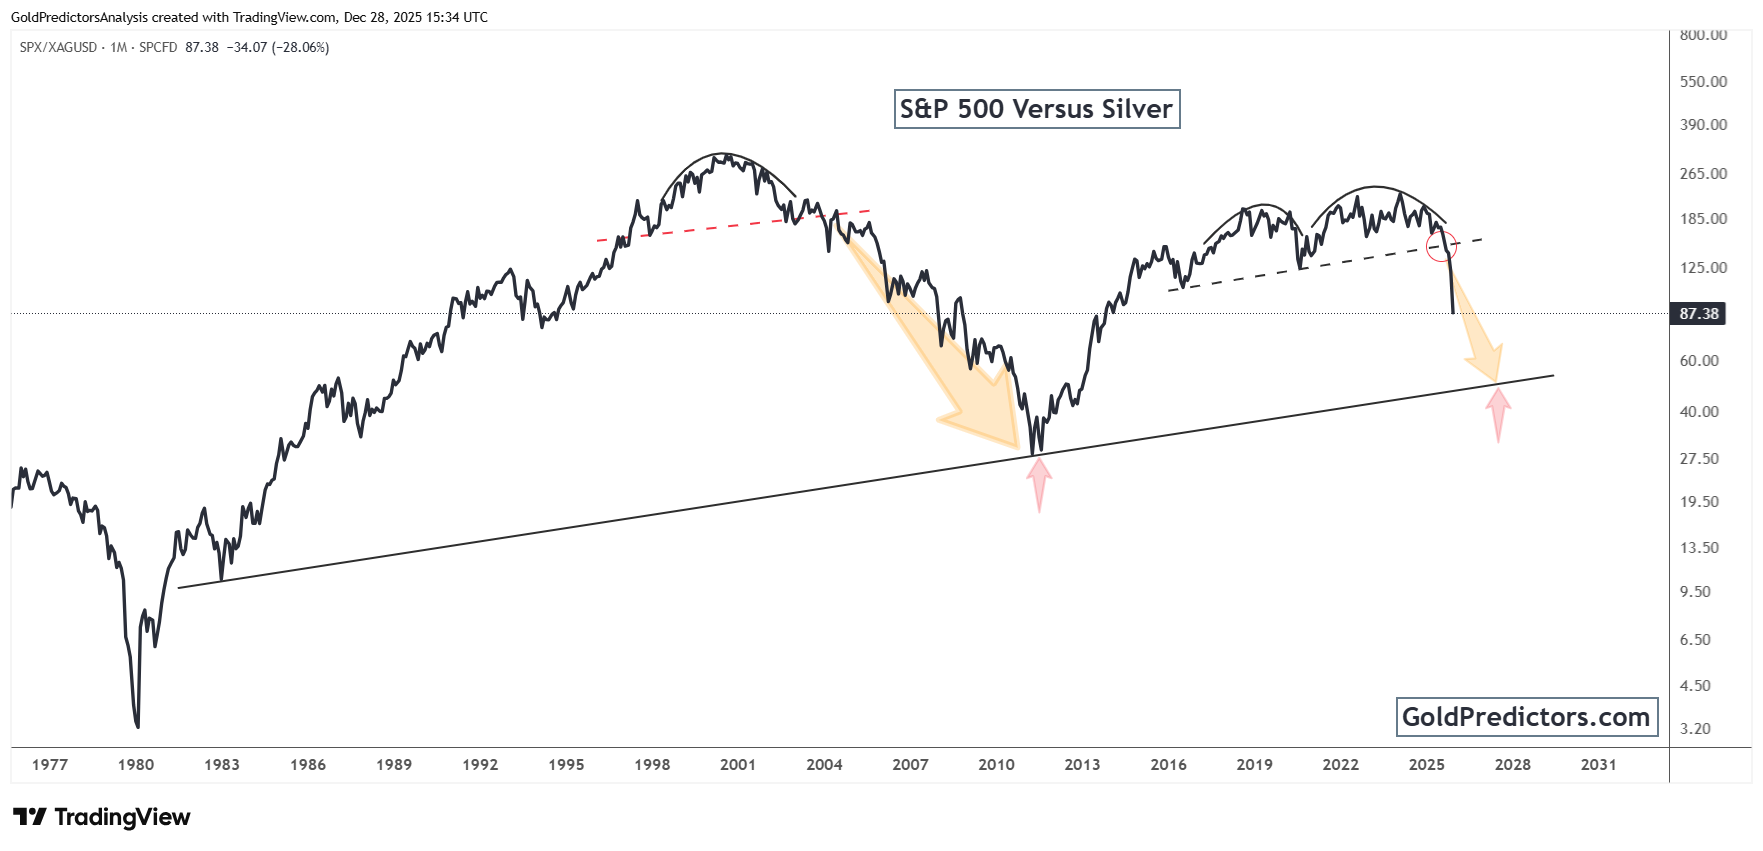
The current structure resembles a large topping pattern with two rounded peaks. The ratio has recently broken below a multi-year support trendline. This breakdown mirrors the setup from the early 2000s, where a similar pattern led to a deep decline in the ratio and a strong silver rally. The repeated nature of this pattern strengthens the case for another major reversal.
Furthermore, the downside projections align with a potential move toward the rising trendline that has served as key support since the early 1980s. If a similar pattern unfolds, the ratio may decline sharply, highlighting a broader rotation from stretched equity valuations into hard assets like silver. This technical breakdown strengthens the outlook for silver outperformance in the years ahead.
Conclusion: Silver Enters a New Bull Market Phase With Upside toward $100
Silver’s breakout above the multi-decade ceiling marks a pivotal moment in the metal’s long-term trend. After decades of failed rallies near the $50 level, the price has finally surged above this critical resistance with conviction. The breakout is not only technical but also structural, supported by a massive cup-and-handle formation, rising macroeconomic stress, and increased demand for hard assets. This shift signals the early stages of a sustained revaluation that could drive silver significantly higher.
At the same time, the breakdown in the S&P 500-to-silver ratio highlights growing capital rotation out of equities and into tangible assets. Historically, similar breakdowns have preceded major silver rallies, as capital flowed out of overvalued financial markets and into hard assets. The ratio has now broken long-term support, replicating conditions seen during previous major reversals. This move confirms that silver’s strength reflects a broader macro rotation that has historically favored sustained outperformance.
The technical and macro backdrop suggests silver could be entering a sustained move toward the $100 region. The combination of rising macro stress and a confirmed breakout forms a strong foundation for a long-term bullish trend. Silver now appears to be transitioning into a new phase of strength, supported by structural validation and shifting capital flows.
Gold Predictors Premium Membership
Get exclusive short-term and swing trade ideas with precise entry levels, stop-loss, and target prices, including justification and analysis — all delivered directly via WhatsApp.
Our premium service includes deep technical analysis on gold and silver markets. We cover cycle analysis, price forecasting, and key timing levels.
Members also receive a weekly market letter with detailed analysis, commentary from our Chief Analyst, including actionable insights, trade timing, and direction forecasts for gold and silver.
Stay ahead of the market — join our premium community today.


