


Is Gold Entering a New Bull Cycle? Technical Analysis Confirms Major Breakout
Gold (XAU/USD) has long served as a haven in times of uncertainty. Its price movements reflect global economic trends, monetary policy, inflation expectations, and investor sentiment. In recent years, gold has captured the attention of traders, investors, and analysts due to its impressive price action. This article discusses the technical analysis of the gold market using long-term charts to understand the next wave of gold prices. It is observed that the formation and breakout of a cup and handle pattern, along with the ratio of gold mining stocks to gold prices, indicate that the gold market has entered a new bull cycle.
Gold Technical Analysis Points to New Bull Market
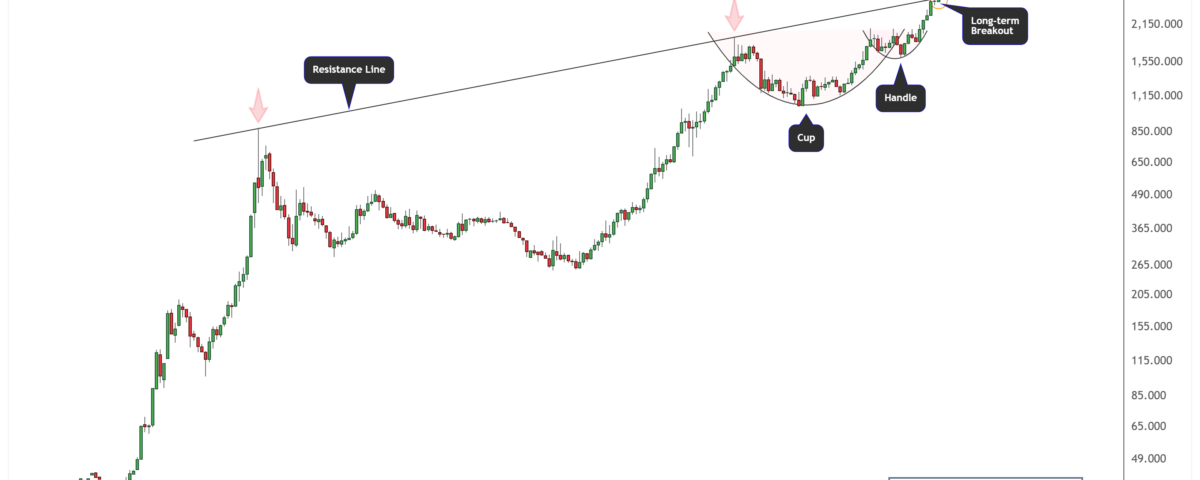
The gold quarterly chart below shows that the price has followed a long-term bullish trend since the 1960s. This trend has formed a series of bullish patterns over time. A significant cup-and-handle pattern developed between the 2011 peak and the 2024 breakout. This pattern signals a continuation of the historical uptrend and suggests a strong upward surge.
A large rounded base formed after the 2011 peak, completing the “cup” shape. The pullback and sideways movement from 2020 to 2022 created the “handle.” This classic pattern suggests accumulation and consolidation before a major price surge. The breakout occurred in early 2024 when gold decisively moved above the resistance line, previously tested in 1980 and 2011.
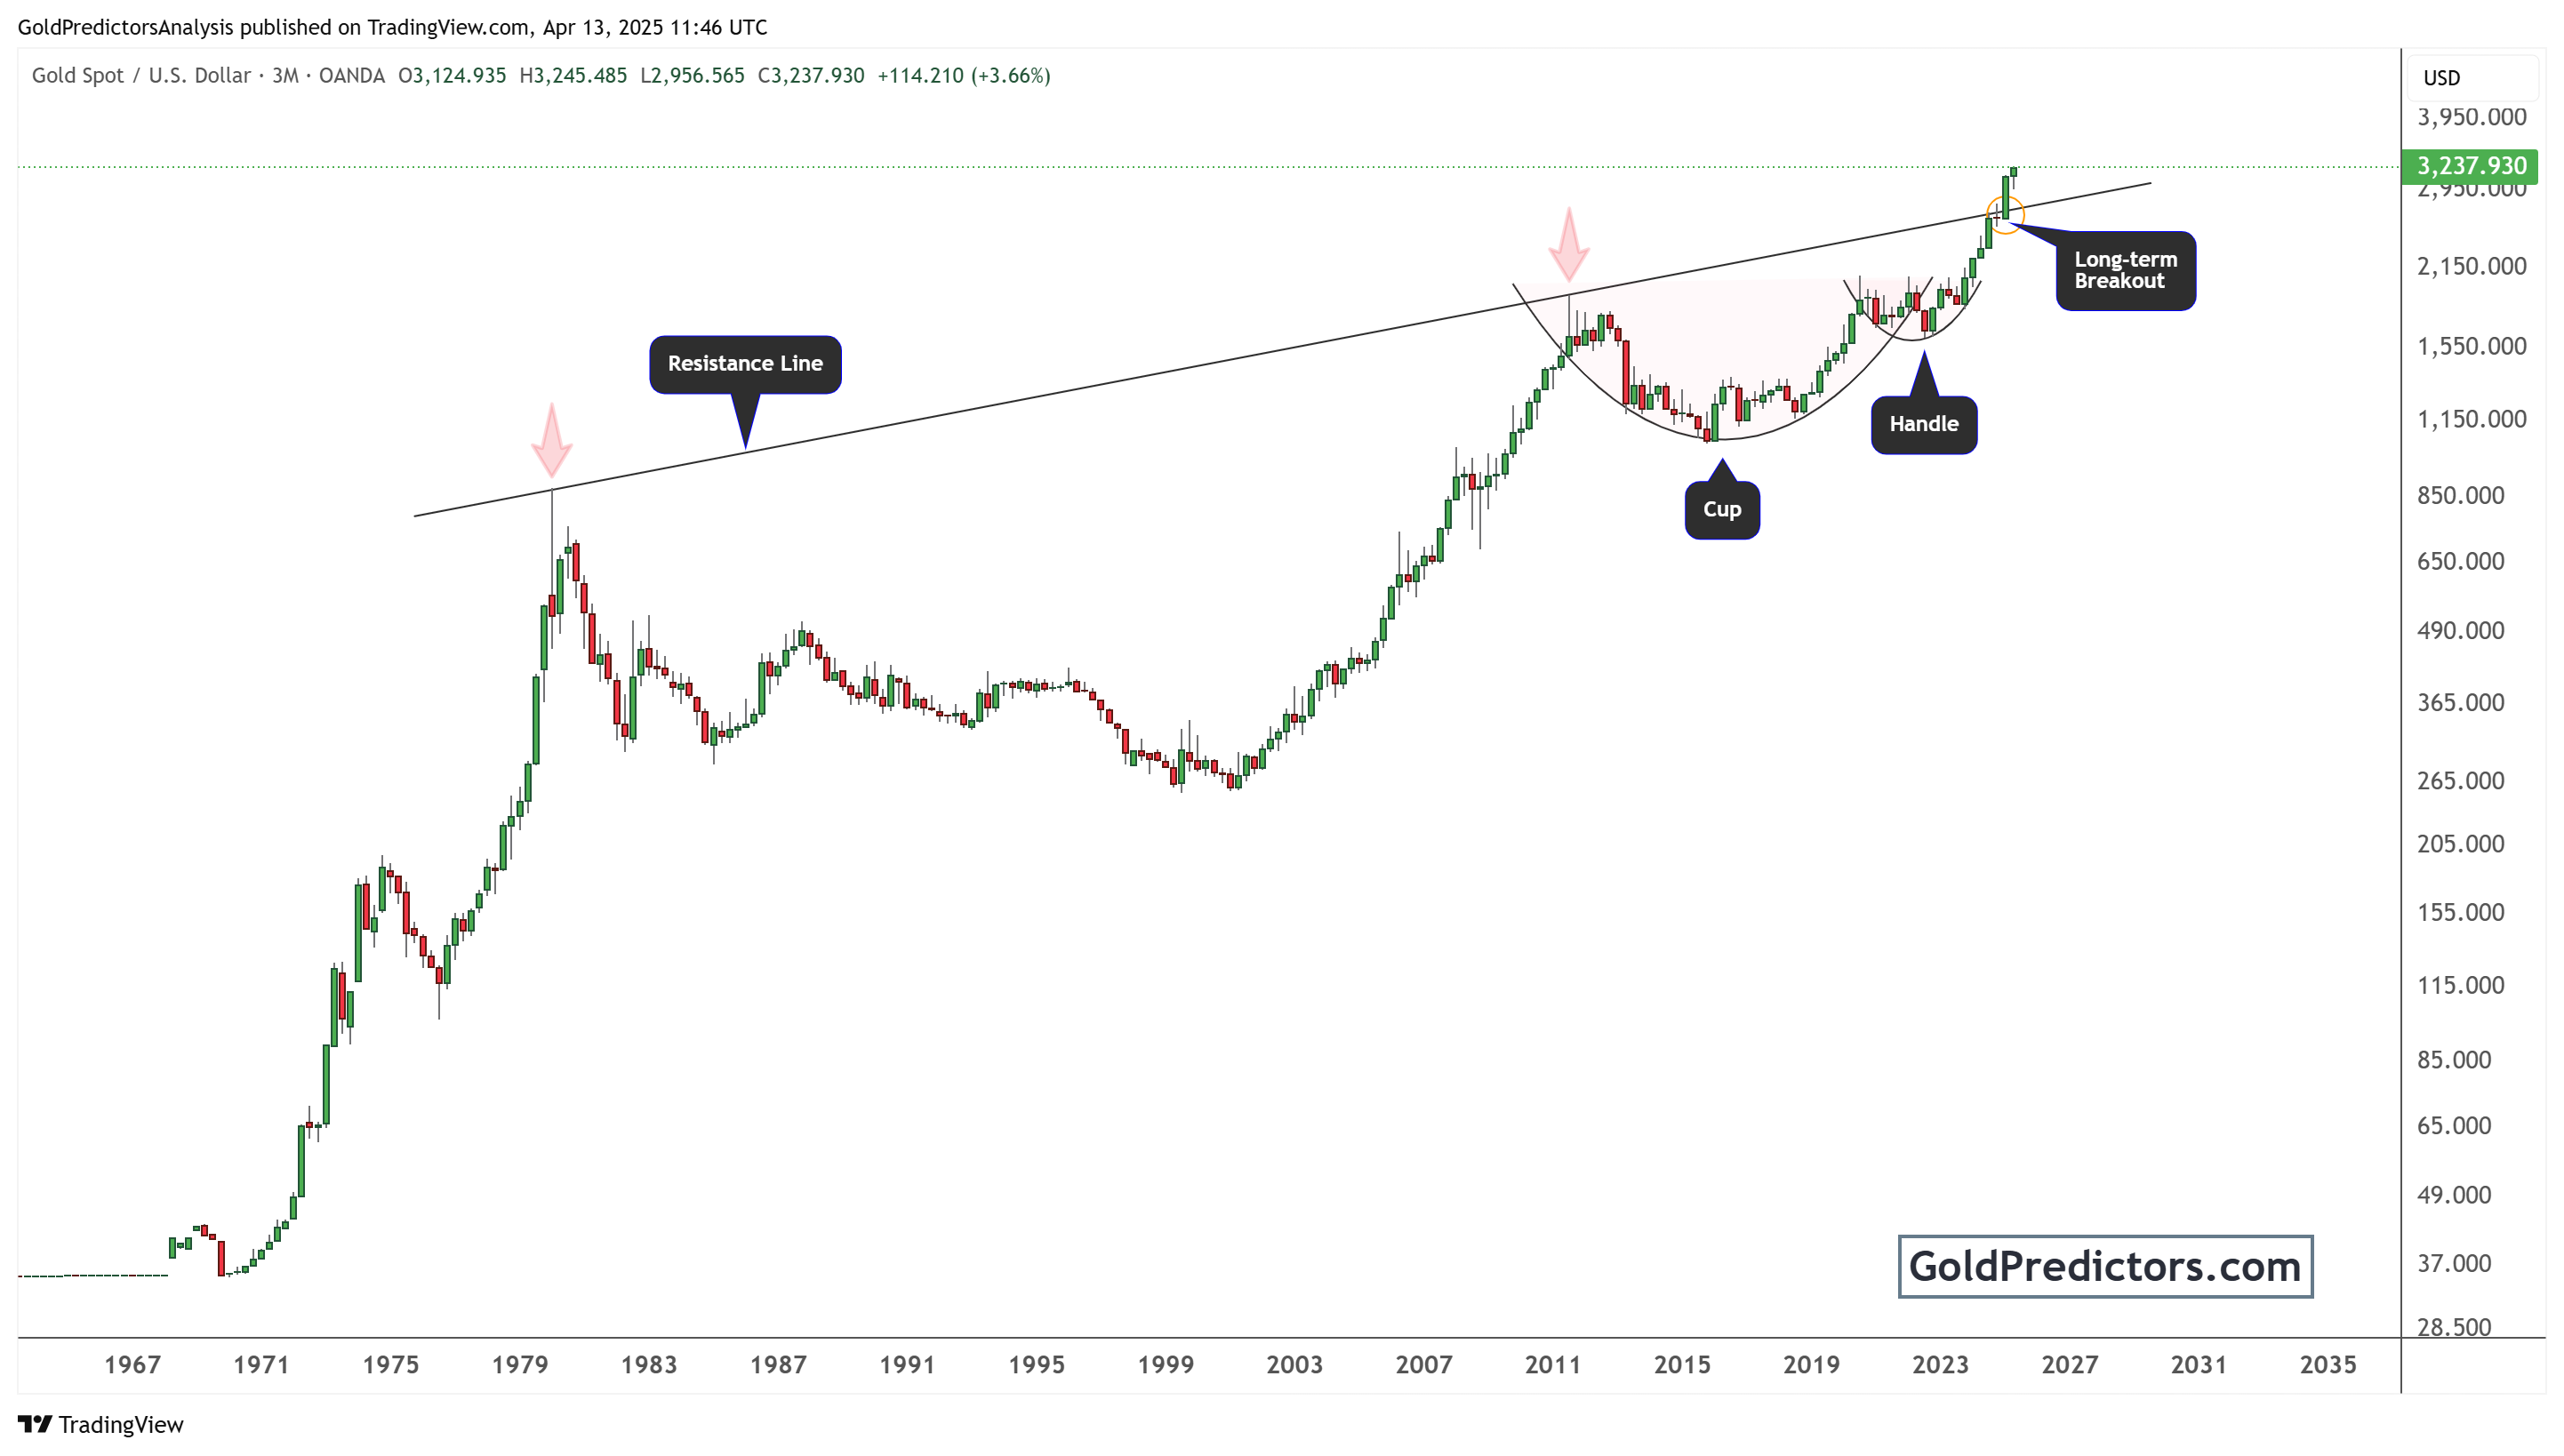
This resistance line was a ceiling for over four decades, making the recent breakout historically significant. Gold broke above $3,000 in March 2024, signalling strong bullish momentum. This breakout could trigger a long-term rally, with potential targets above $4,000 in the coming years.
This pattern reflects technical strength and investor confidence in gold amid global inflation fears, central bank buying, and geopolitical uncertainty. Historically, breakouts from such long-term resistance levels signal a multi-year uptrend.
Gold Miners vs Gold: GDX/XAUUSD Ratio Nears Critical Breakout Point
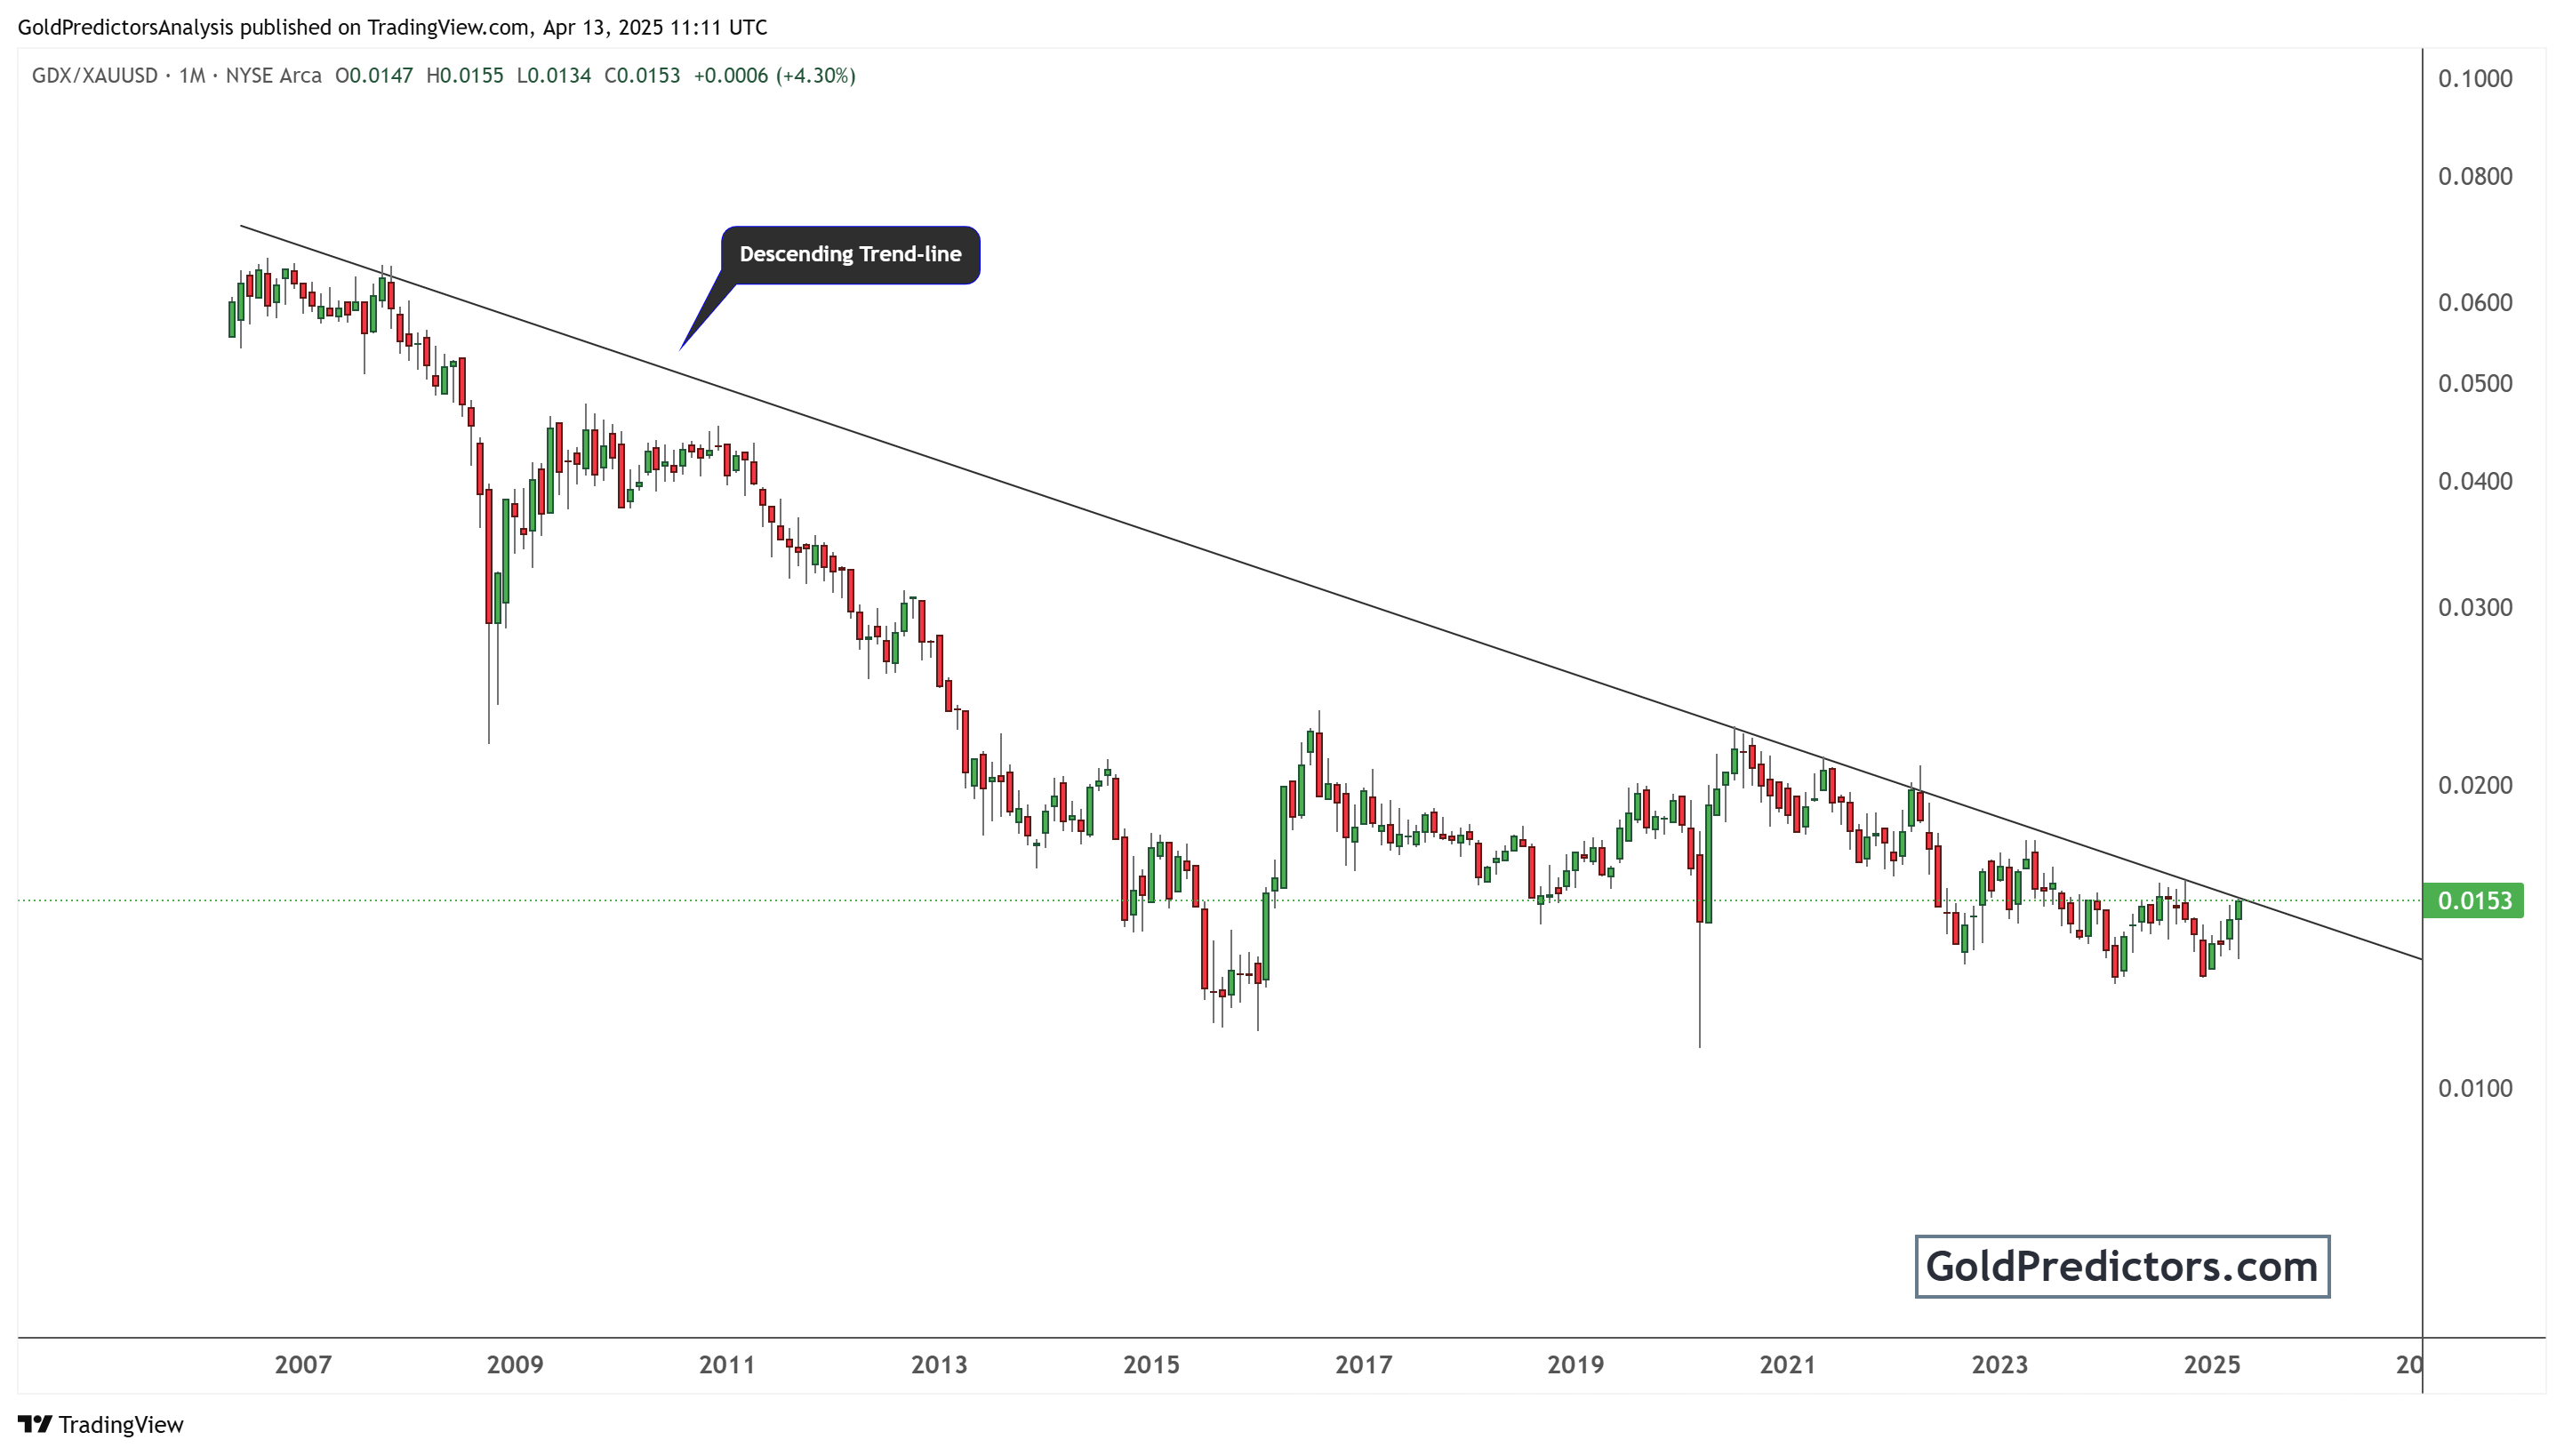
The chart below shows the monthly price action of the GDX/XAUUSD ratio, which compares gold miners (GDX) against gold. This ratio provides insight into the relative strength of gold mining stocks compared to the physical metal. Since 2008, the ratio has been in a long-term downtrend, forming a descending trend line that has acted as consistent resistance.
As of April 2025, the ratio is at 0.0153 and approaching the trendline again. This is crucial because any breakout above this descending trendline would suggest a potential shift in market sentiment. A breakout would mean gold miners may start outperforming gold itself—a scenario typically seen in the early stages of major bull markets in the precious metals sector.
Gold mining stocks are often leveraged plays on gold, meaning they can outperform gold when prices rise significantly. If gold maintains its current momentum, investors might begin rotating into miners, expecting higher returns. Thus, the GDX/XAUUSD ratio breakout would further confirm the bullish trend in the broader gold market.
Moreover, if the ratio breaks and holds above the trendline, it could initiate a re-rating of mining stocks. Historically, these breakouts align with increased capital inflows into the sector, sparking a new investment cycle.
Conclusion: Gold Breakout Signals a New Bull Market Cycle
In conclusion, the technical breakout in gold, supported by long-term patterns and historical resistance levels, signals the beginning of a new bull cycle. The breakout above $3,000 in early 2024, following the formation of a classic cup and handle pattern, highlights strong investor confidence. This move is technically significant and aligned with macroeconomic factors such as inflation, central bank demand, and global uncertainty. These elements create a solid foundation for sustained bullish momentum in gold prices.
At the same time, the GDX/XAUUSD ratio shows early signs of a breakout from its long-term downtrend. This shift suggests that gold mining stocks may soon outperform physical gold. It could start a new capital rotation into the mining sector if confirmed. These technical signals support a broader bullish outlook for the precious metals market, pointing to strong potential for gold and gold-related equities in the coming years.


