


How This GDX Breakout Trade Returned 36.9% in 3 Months
This GDX swing trade case study highlights a successful real-money setup executed in early 2025. The trade setup captured a strong rally from a confirmed breakout, moving from an entry at $46 to an exit at $63. The position reflected disciplined technical execution, seasonal strength in the gold sector, and alignment with macroeconomic trends. This trade can be studied as a model for identifying low-risk, high-reward opportunities in the mining equities sector.
GDX Trade Summary
Instrument: VanEck Gold Miners ETF (GDX)
Trade Type: Medium-Term Swing Trade
Entry Price: $46 (Buy Entry after breakout confirmation)
Stop Loss: Below $41 support
Target: $63 (Final Exit)
Trade Duration: May – Aug 2025
Profit: +$17 per share (+36.9%)
Chart-Based Strategy and Technical Justification
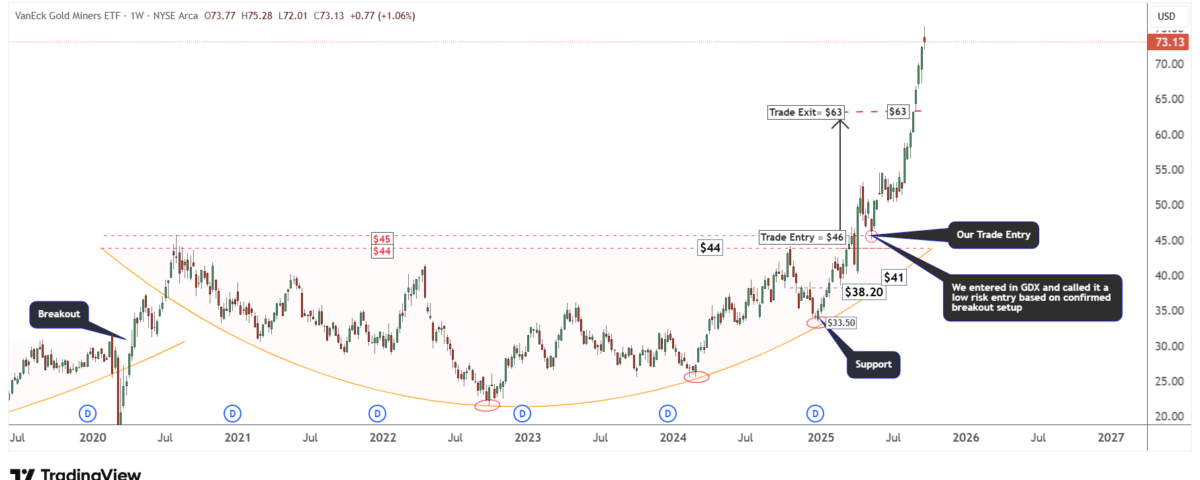
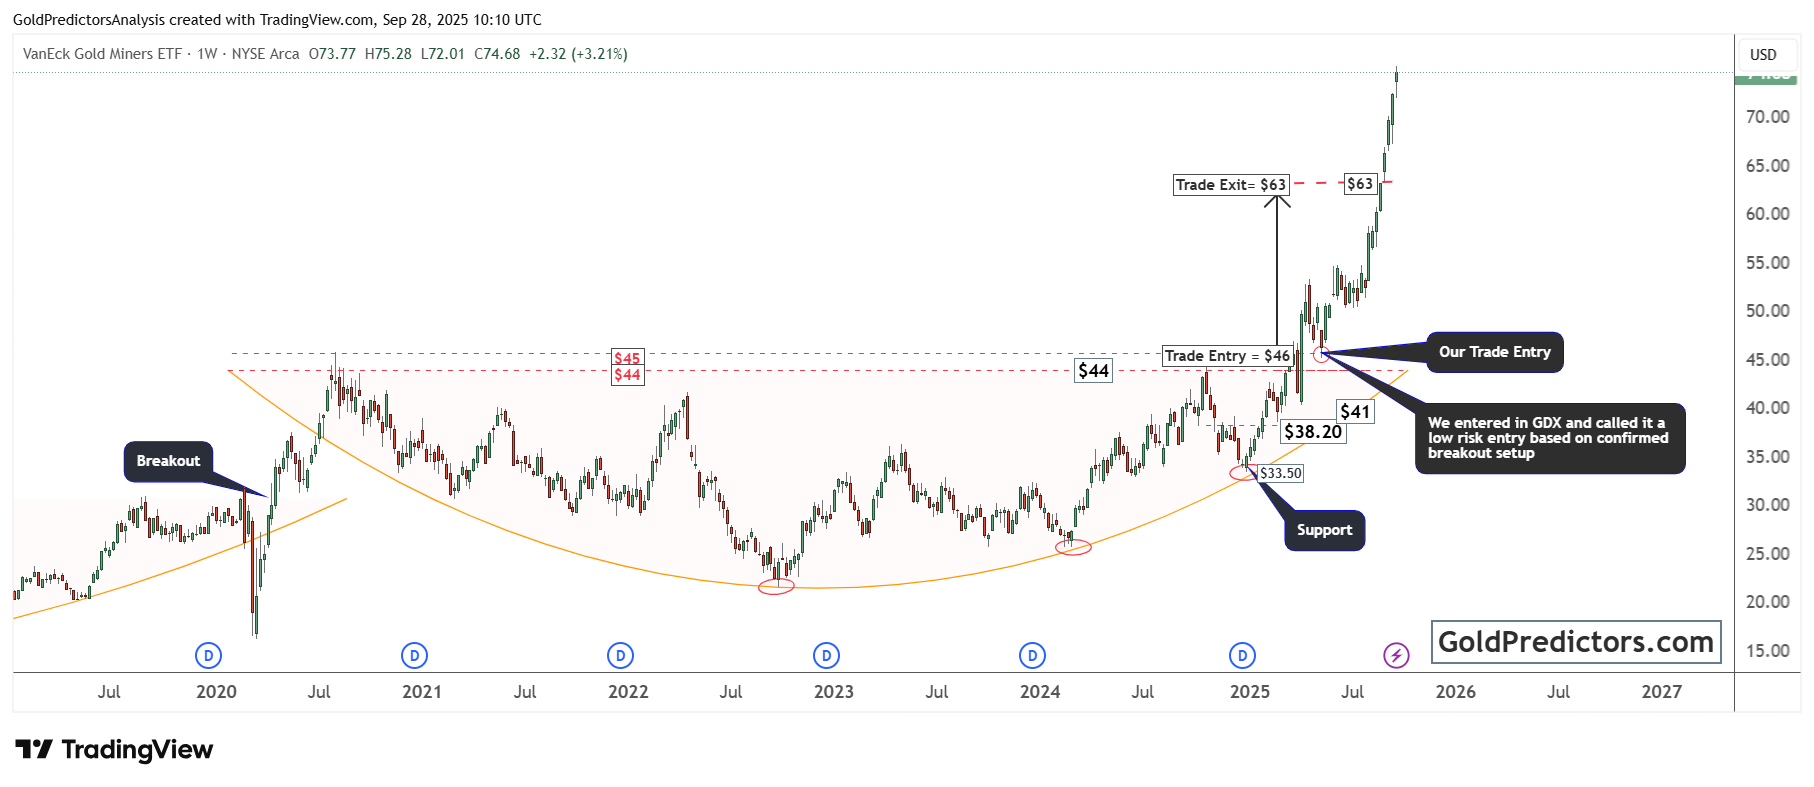
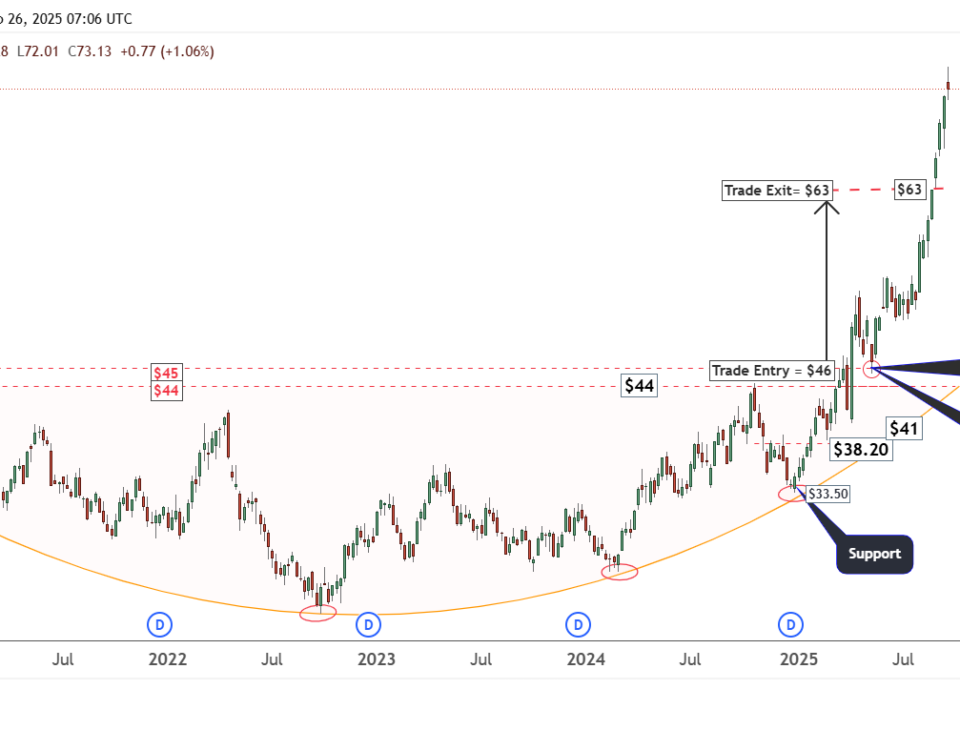
On the breakout in March 2025, a long trade was executed at $46 as GDX cleared multi-year resistance between $44 and $45. The setup was identified as a low-risk entry point, since years of consolidation had compressed the price beneath this zone.
Key technical factors included:
- Cup-and-Handle Formation: A large basing pattern had developed between 2020 and 2024, forming a rounded cup with multiple support touches around $33.50 and $38.20. This indicated long-term accumulation.
- Breakout Level: $44–$45 served as significant horizontal resistance, repeatedly tested since 2020. The breakout above this level in 2025 confirmed trend reversal.
- Support Alignment: Rising trendline support reinforced the base, while prior lows ($33.50 and $38.20) established a strong risk-control zone.
- Low-Risk Entry: Entry at $46 placed the trade just above resistance-turned-support, with a stop below $41 for favorable risk-to-reward.
The setup created a classic breakout trade, with momentum confirmation as the price accelerated through $50 and beyond.
This trade was delivered to Gold Predictors’ premium members to registered email addresses.
Trade Execution and Momentum
- Entry: Position initiated at $46 when the price corrected after a breakout from $45.
- Momentum Confirmation: GDX advanced rapidly, breaking through resistance layers and attracting institutional inflows.
- Exit: The position was closed at $63, locking in a +36.9% gain. The exit was timed as the price reached measured-move targets and momentum indicators flashed short-term overextension.
Fundamental Drivers Behind the Trade
This trade was supported not only by technical structure but also by macroeconomic and fundamental conditions in early 2025:
- Gold Market Strength: Spot gold rallied sharply in Q1–Q2 2025 as markets anticipated multiple Fed rate cuts. This provided direct support to miners’ earnings outlook.
- Falling Real Yields: With U.S. inflation stabilizing while rate-cut bets rose, real yields softened, reinforcing demand for gold and related equities.
- Central Bank Buying: Global central banks continued their record gold accumulation programs, ensuring strong baseline demand.
- Geopolitical and Trade Risks: Persistent U.S.-China tariff disputes and broader geopolitical tensions kept safe-haven demand elevated, feeding into higher mining stock valuations.
The alignment of these drivers provided conviction to ride the breakout.
Key Takeaways and Lessons Learned
- Long-Term Bases Yield Big Moves: The multi-year cup-and-handle pattern created the foundation for a strong breakout.
- Defined Levels Matter: Entry above $45 provided a clear structure with tight downside risk.
- Ride Sector Tailwinds: Mining equities often amplify gold’s moves. When fundamentals align, leverage can be significant.
- Exit at Strength: Capturing gains at $63, when momentum became extended, ensured profits were locked before overbought exhaustion.
What You Can Learn from This Trade
- Enter breakouts with explicit confirmation, not anticipation.
- Use long-term consolidation patterns to identify powerful setups.
- Combine sector fundamentals with technical precision.
- Take profits when momentum stretches too far, even in bullish conditions.
Summary
This GDX swing trade from $46 to $63 delivered a +36.9% return in just a few months. It demonstrated how combining long-term technical bases, breakout confirmation, and supportive fundamentals can produce high-probability, high-reward opportunities. By respecting levels, timing entries with discipline, and managing exits based on technical extension, this trade showcased structured execution in practice.
To see the performance of all trades, please visit the performance page below.
PerformanceStay tuned for the next trade setup at Gold Predictors.
Gold Predictors Premium Membership
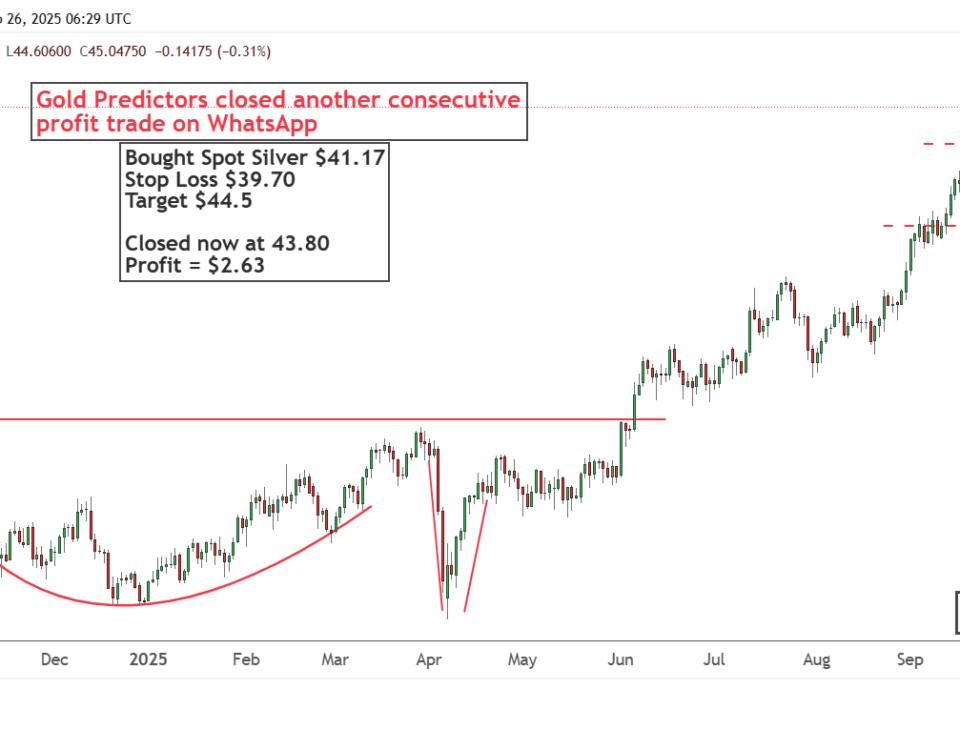
Get exclusive short-term and swing trade ideas with precise entry levels, stop-loss, and target prices, including justification and analysis — all delivered directly via WhatsApp.
Our premium service includes deep technical analysis on gold and silver markets. We cover cycle analysis, price forecasting, and key timing levels.
Members also receive a weekly market letter with detailed analysis, commentary from our Chief Analyst, including actionable insights, trade timing, and direction forecasts for gold and silver.
Stay ahead of the market — join our premium community today.
