


Historical Analysis of SPX/Gold Ratio: Is Gold Entering a Long-Term Bull Run?

The recent SPX/Gold ratio movements have caught the attention of many investors and market analysts. These movements signal a potential major shift in the long-term trend for gold prices. Historically, the SPX/Gold ratio has been a reliable indicator of primary economic cycles. This ratio predicts large-scale shifts in asset allocation between equities and precious metals. This article explores the historical precedents and analyzes why the latest breakdown could indicate the beginning of a long-term bull run for gold.
Understanding the SPX/Gold Ratio and Its Significance
The SPX/Gold ratio measures the relative strength of the S&P 500 Index (SPX) compared to gold prices. A rising ratio indicates that equities outperform gold, whereas a declining ratio signals the opposite. This ratio is crucial because it can provide insights into the market’s risk sentiment. The ratio also indicates the inflation expectations and the global economy’s health.
Historically, sharp declines in this ratio have coincided with periods of economic uncertainty. This uncertainty has hit the stock market turmoil and a strong rally in gold prices. This makes the SPX/Gold ratio a valuable tool for understanding the broader market dynamics and predicting major trends in gold.
Historical Patterns: Key Turning Points in the SPX/Gold Ratio
The chart below highlights four major historical turning points where the SPX/Gold ratio peaked and declined sharply. Each decline in the ratio has resulted in a surge in gold prices.

These key events are:
- The Great Depression (1930)
- During the early 1930s, the SPX/Gold ratio peaked as the stock market was euphoric. However, the subsequent crash led to a sharp decline in the ratio, and gold became a preferred safe-haven asset.
- The End of the Bretton Woods System (1971)
- In 1971, President Nixon ended the gold standard, decoupling the U.S. dollar from gold. This led to significant economic uncertainty. This uncertainty caused a massive rally in gold as the SPX/Gold ratio collapsed.
- Dot-Com Bubble Burst (2001)
- The early 2000s saw a speculative frenzy in technology stocks. This drives the SPX/Gold ratio to new highs. When the bubble burst, investors sought safety in gold, leading to a long-term decline in the ratio and a decisive bull run for gold.
- Global Financial Crisis (2008-2011)
- The 2008 financial crisis saw a significant drop in the SPX/Gold ratio as the stock market crashed. Gold rallied to all-time highs as investors fled to safety. The ratio remained suppressed until the economic recovery.
Current Market Scenario: The Significance of the 2024 Breakdown
The latest data point on the chart indicates that the SPX/Gold ratio is breaking down from a key level in 2024. This signals that a major shift might be underway. This trend closely resembles the patterns observed during the previous three cycles. This price behaviour suggests that gold could be on the cusp of another long-term bull run.
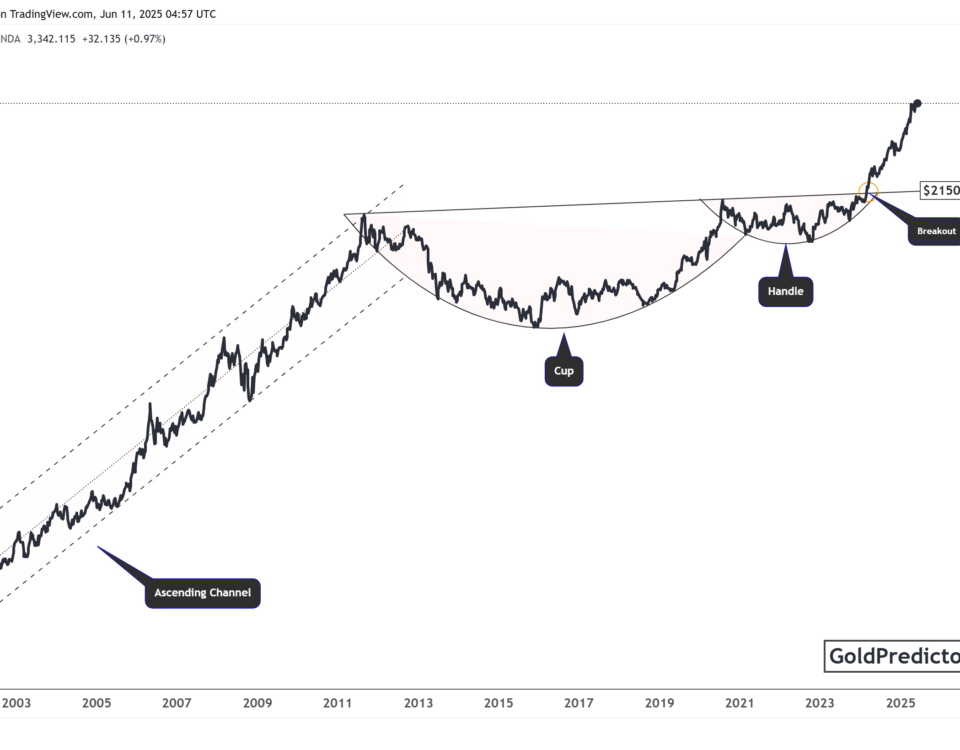
Key Technical Analysis Observations
- The 2024 breakdown occurs after a rounding top is formed. This rounding top indicates a decisive shift in the balance of power between equities and gold.
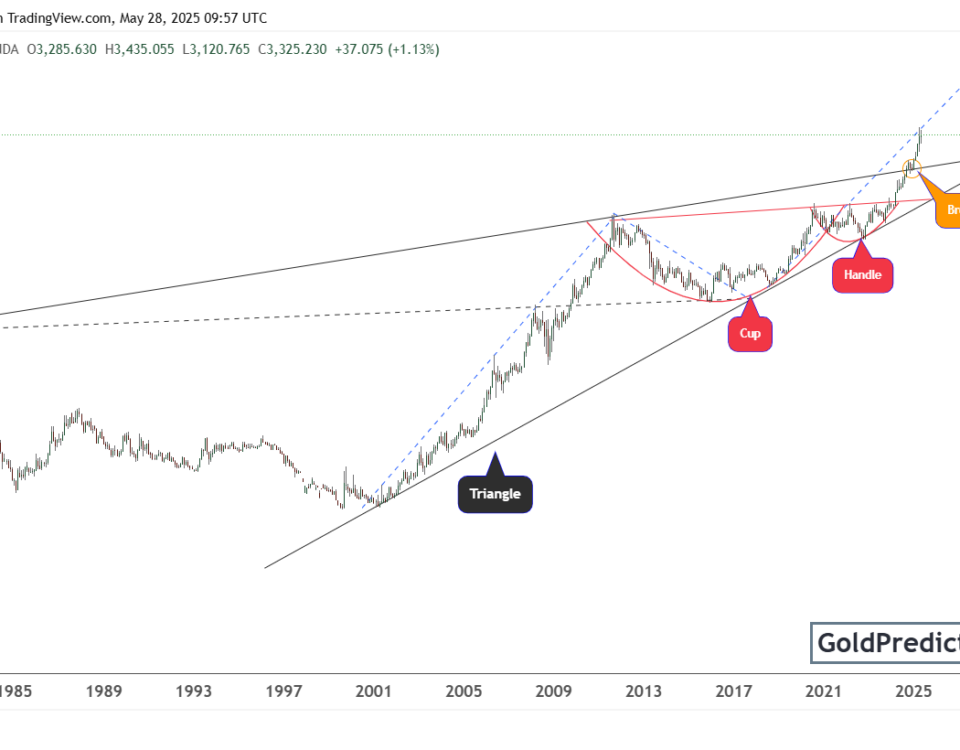
- The SPX/Gold ratio appears to form a long-term wedge pattern. Each peak occurs within the wedge pattern.
- If this breakdown is sustained, the ratio could decline sharply over the next few years, similar to the declines seen in 1971, 2001, and 2008.
What Does This Mean for Gold?
The chart strongly suggests that gold is entering a new phase of its long-term cycle. This indicates the potential for substantial gains over the coming years. Several factors support this bullish outlook as below:
Macroeconomic Uncertainty: Rising geopolitical tensions in the Middle East are increasing this new move. On the other hand, high inflation and concerns about a global economic slowdown create a favorable environment for gold.
- Weakening US Dollar: A weakening dollar has historically been a key driver of higher gold prices. As the Federal Reserve shifts its monetary policy stance, the dollar could come under pressure, further boosting gold.
- Declining Real Yields: Real yields will likely decline due to economic stagnation and lower interest rates. This would enhance the appeal of non-yielding assets like gold.
- Increased Institutional Demand: Institutional investors increasingly diversify into gold to hedge against inflation and potential market turmoil.
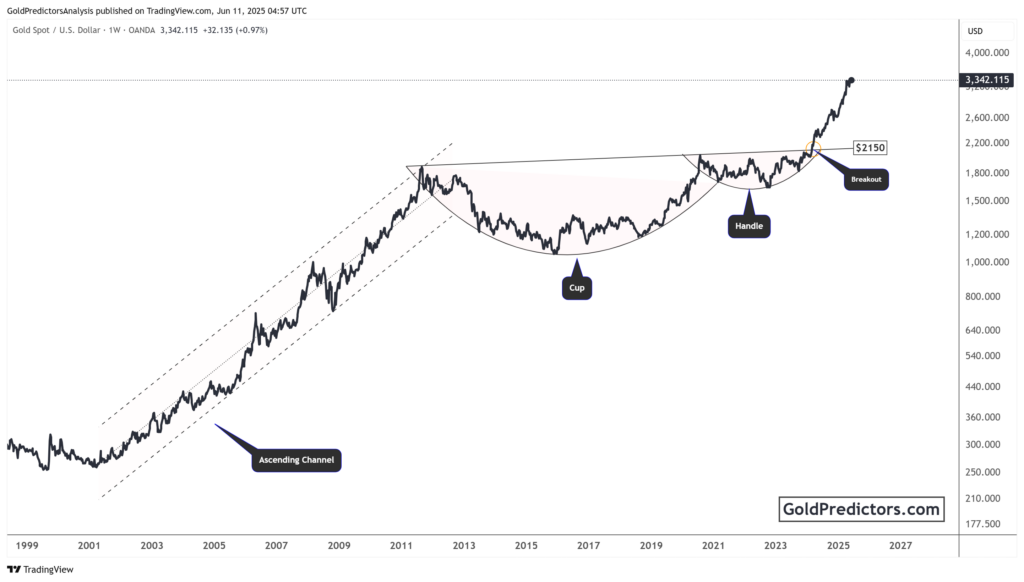
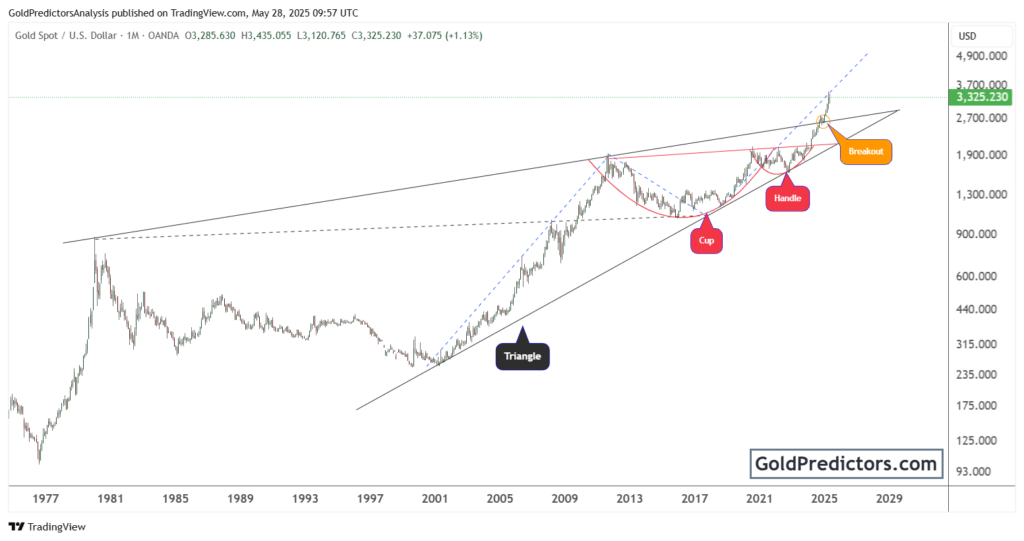
Gold’s Potential Price Targets for the Next Bull Run
If history is any guide, gold prices could experience a significant upside in the next few years. During the 1971 and 2001 cycles, gold surged by more than 500% from its breakout point. Even a conservative estimate would suggest that gold could rise by 200-300% from its current levels.
Price Projections Based on Historical Data
- Short-Term Target: $2,700 per ounce (within the next 6-12 months)
- Medium-Term Target: $3,500 – $4,000 per ounce (by 2026)
- Long-Term Target: $5,000+ per ounce (by 2028 or beyond)
Investment Strategies: How to Position for the Upcoming Bull Run
Given the bullish outlook for gold, investors can consider several strategies to capitalize on this opportunity:
Physical Gold: Allocating a portion of the portfolio to physical gold (coins, bars) provides direct exposure to price movements and a hedge against systemic risk.
Gold ETFs and Mutual Funds: For investors who prefer liquidity and lower transaction costs, gold ETFs like SPDR Gold Shares (GLD) offer a convenient way to gain exposure.
Mining Stocks: Mining stocks typically have higher leverage to gold prices, making them attractive options for more aggressive investors. Companies like Barrick Gold and Newmont Corporation are industry leaders to consider.
Options and Futures: Options and futures contracts provide opportunities to profit from price movements with lower upfront capital. However, they come with higher risks and complexity.
Conclusion: Is 2024 the Beginning of a New Gold Supercycle?
The breakdown of the SPX/Gold ratio in 2024 could mark the beginning of a multi-year bull run for gold. This bull run might resemble the previous 1930, 1971, and 2001 cycles. The economic uncertainties are rising, and equities are facing increased volatility. These conditions are ripe for gold to become the asset of choice for long-term investors.
As history has shown, significant SPX/Gold ratio declines have led to explosive growth in gold prices. Investors would be wise to monitor this ratio closely and consider positioning themselves for a potential surge in the precious metals market.
To receive premium updates and trading signals for gold and silver, please subscribe using the link below.
