Gold & US Presidential Election
THE TIME OF HIGH VOLATILITY BEGINS FROM NOW
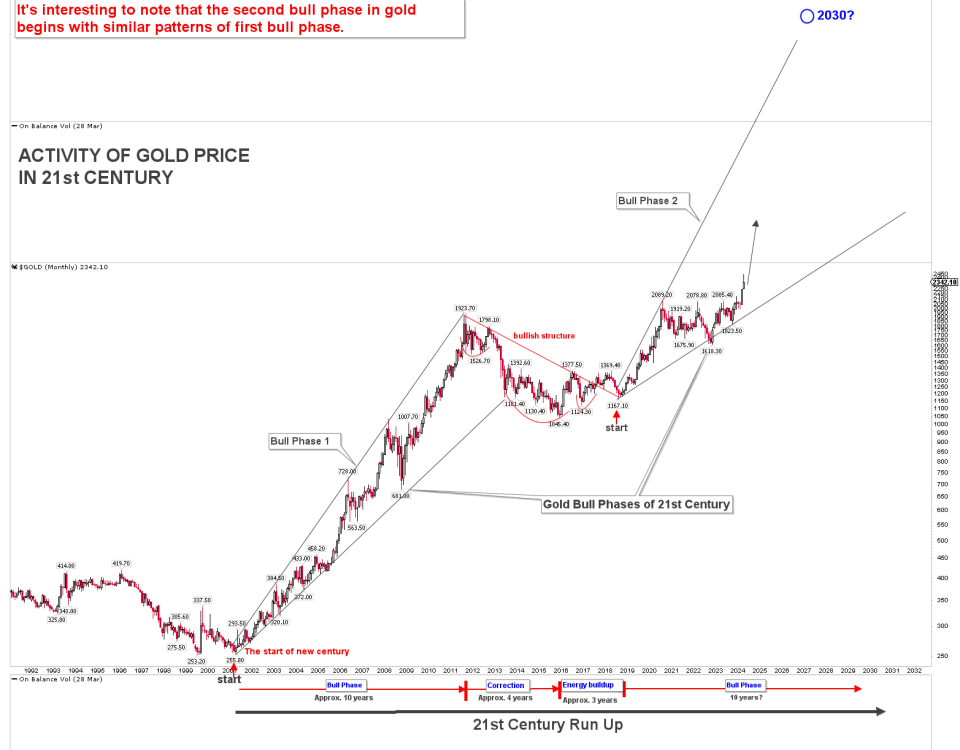
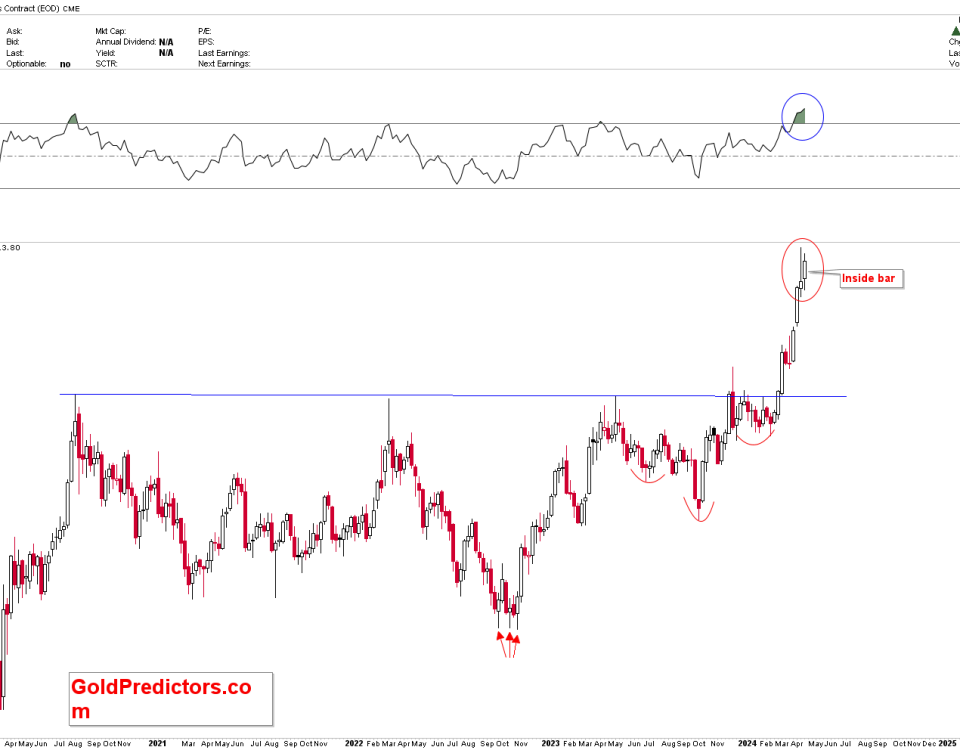
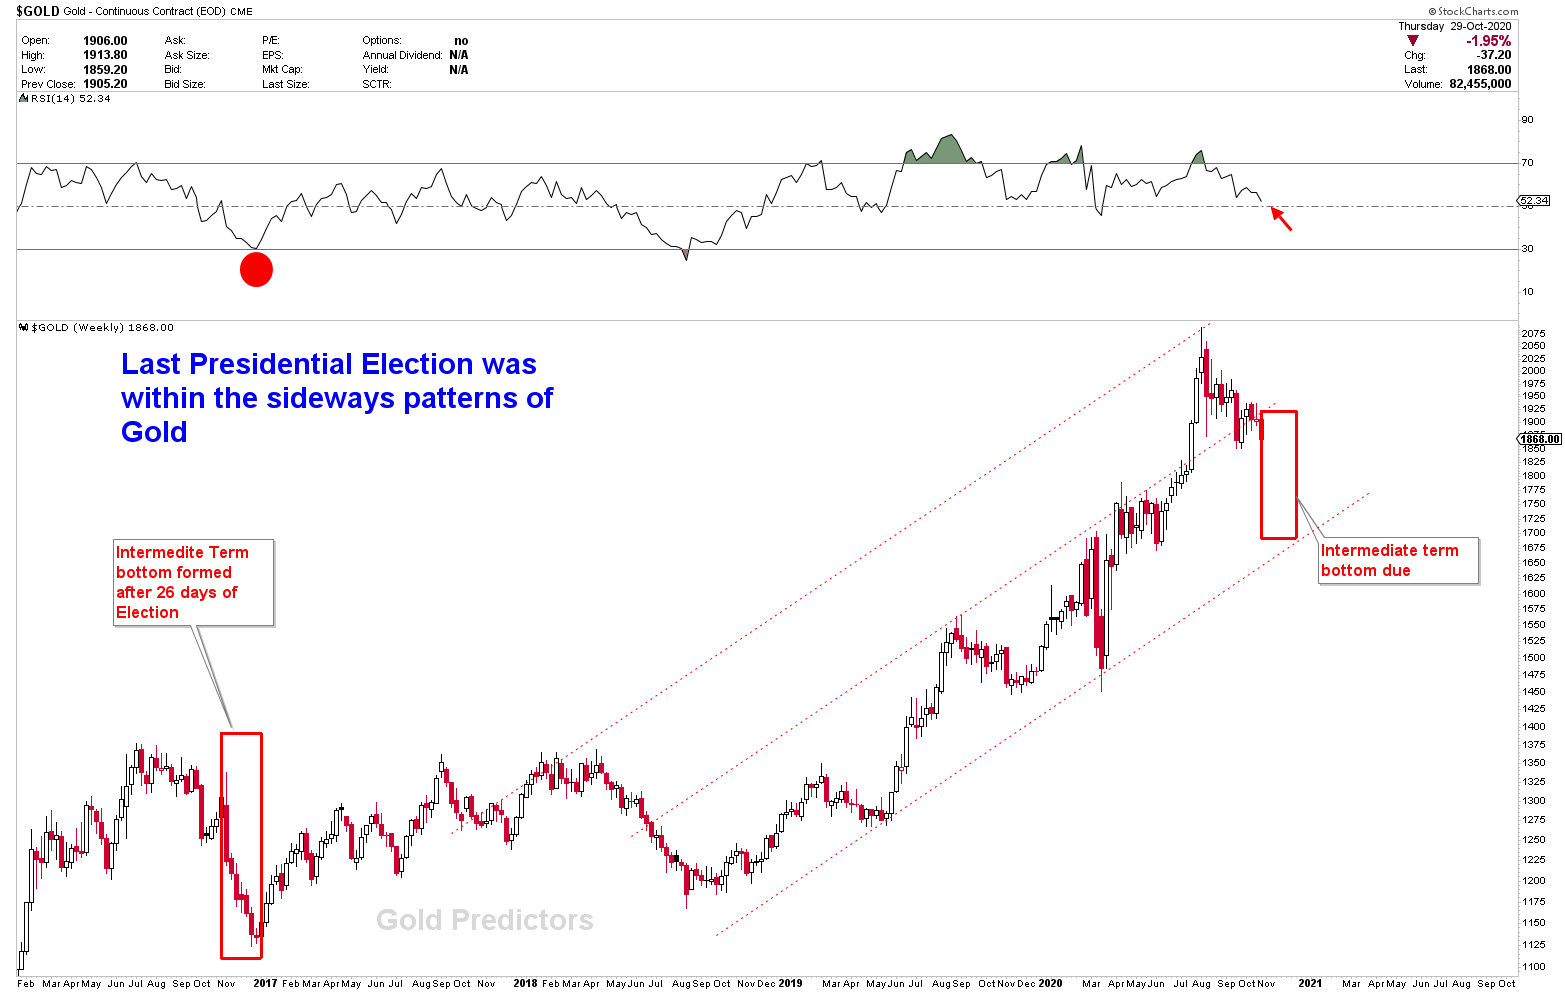
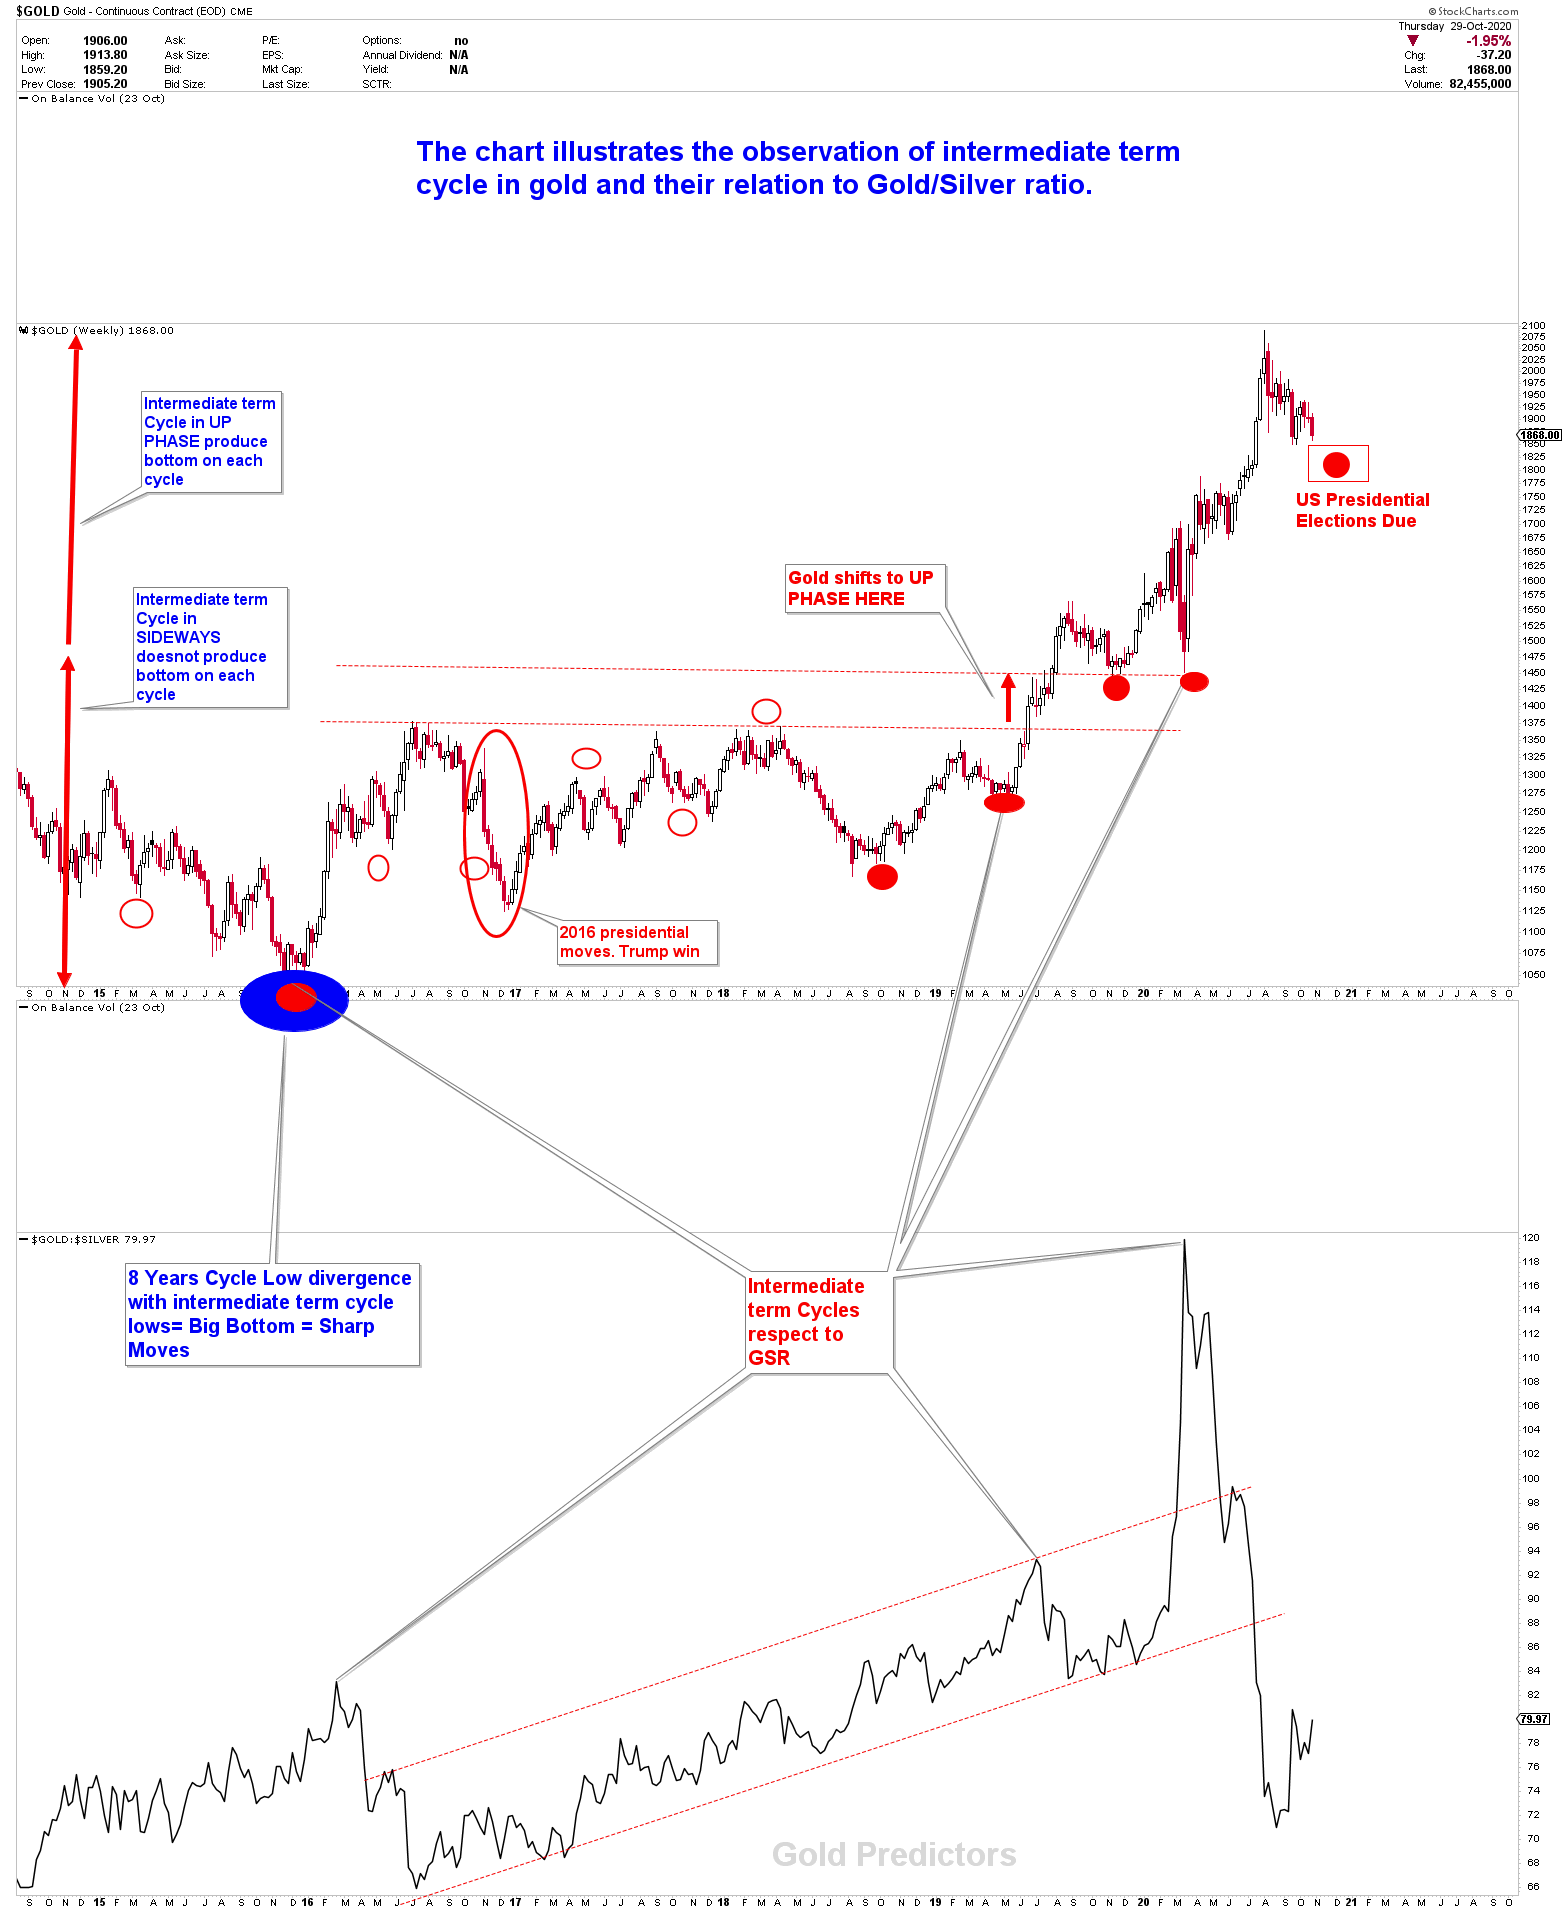
U.S. President Donald Trump and Democratic Challenger Joe Biden are now going into the final full week of campaign until the November 3rd election. Gold Traders everywhere prepare for the uncertainty of a falsified end result in the most crucial election of generations. The controversy could extend into January 2021 in the worst-case situation. Extraordinary times produce extraordinary possibilities and traders live in some of the most thrilling times of history. Precious metal values are currently breaking down towards supports. In the end, this means that a major move is on the way in either direction. The only question now is in which way? Whatever the winner – the result is likely to cause a range of explosive shifts around the commodity complex from precious metals to the energy markets. Elections have implications, but markets may not be immediately clear. For example, the last election of 2016 was a powerful decline in gold when trump wins. Within 4 years of the November 2016 election, Gold gained 84.49% as trump gets president. As shown in the chart, gold was in sideways trends before the November 2016 elections, and due to market dynamics and pre-election intermediate-term cycles, prices were expected to drop. Prices rebounded after 26 days of election, later entering the bull phase. But the current story is different anyway. Gold is now in the Bull phase with the intermediate-term cycles set to bottom in the October / November 2020, for higher prices into year end. So prices are likely to drop sharply, probably during the election period.
How Dollar Is Effected After the election?
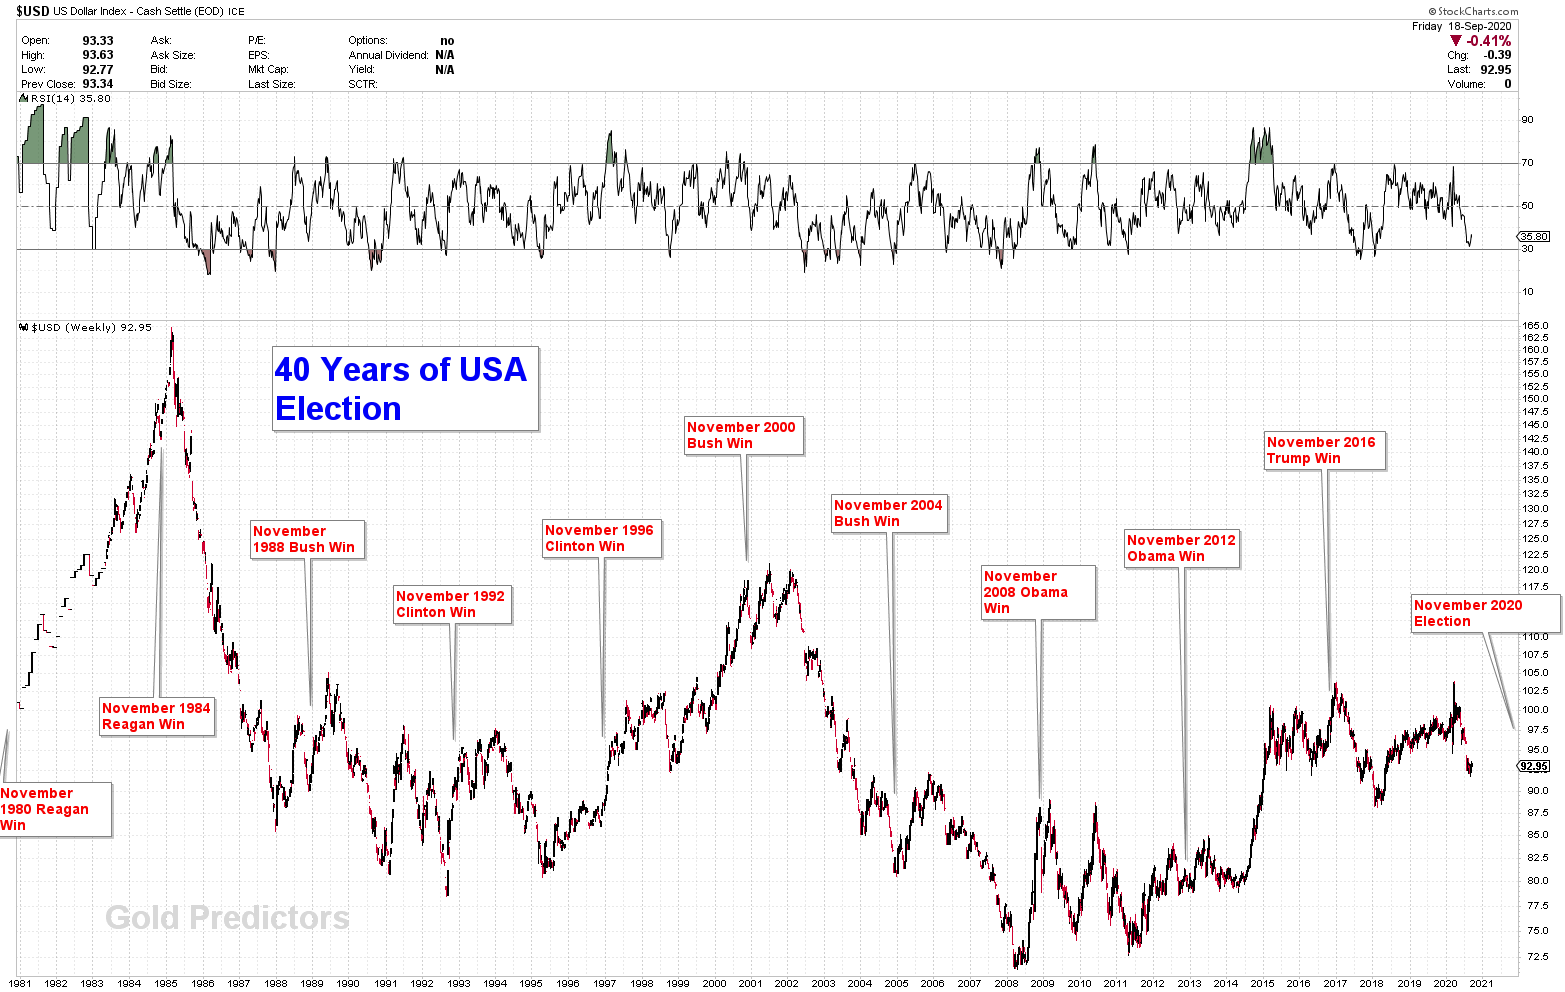
Looking at the 40-year US election on our charts, it is clear that there is considerable uncertainty prior to the election, first the volatility on the dollar market is expected to migrate into other global financial markets including stocks , bonds , commodities and forex. In most situations, a fake heads will be the first move, then the actual move comes. The market tone in dollar market is set after the dust is clear.
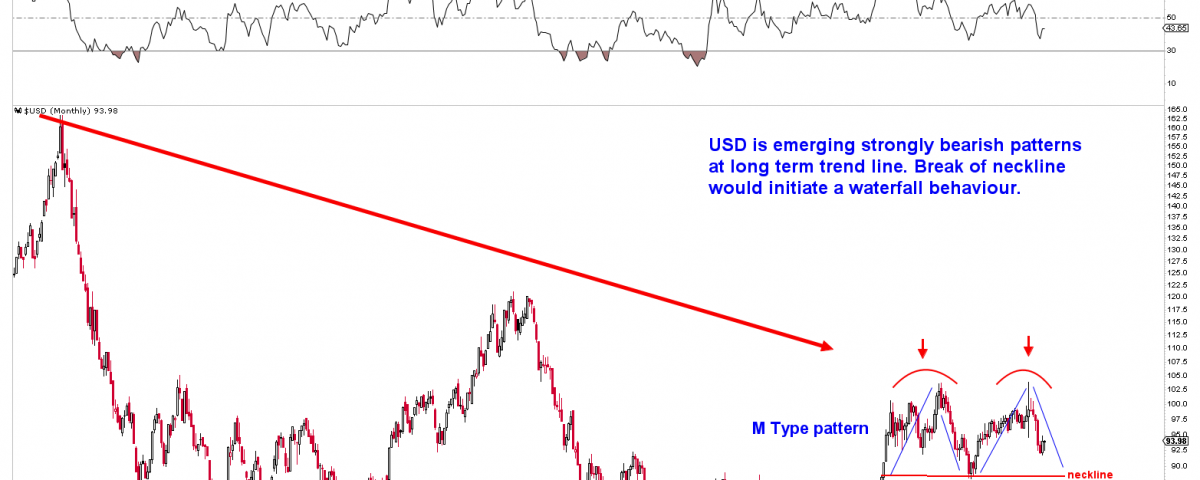
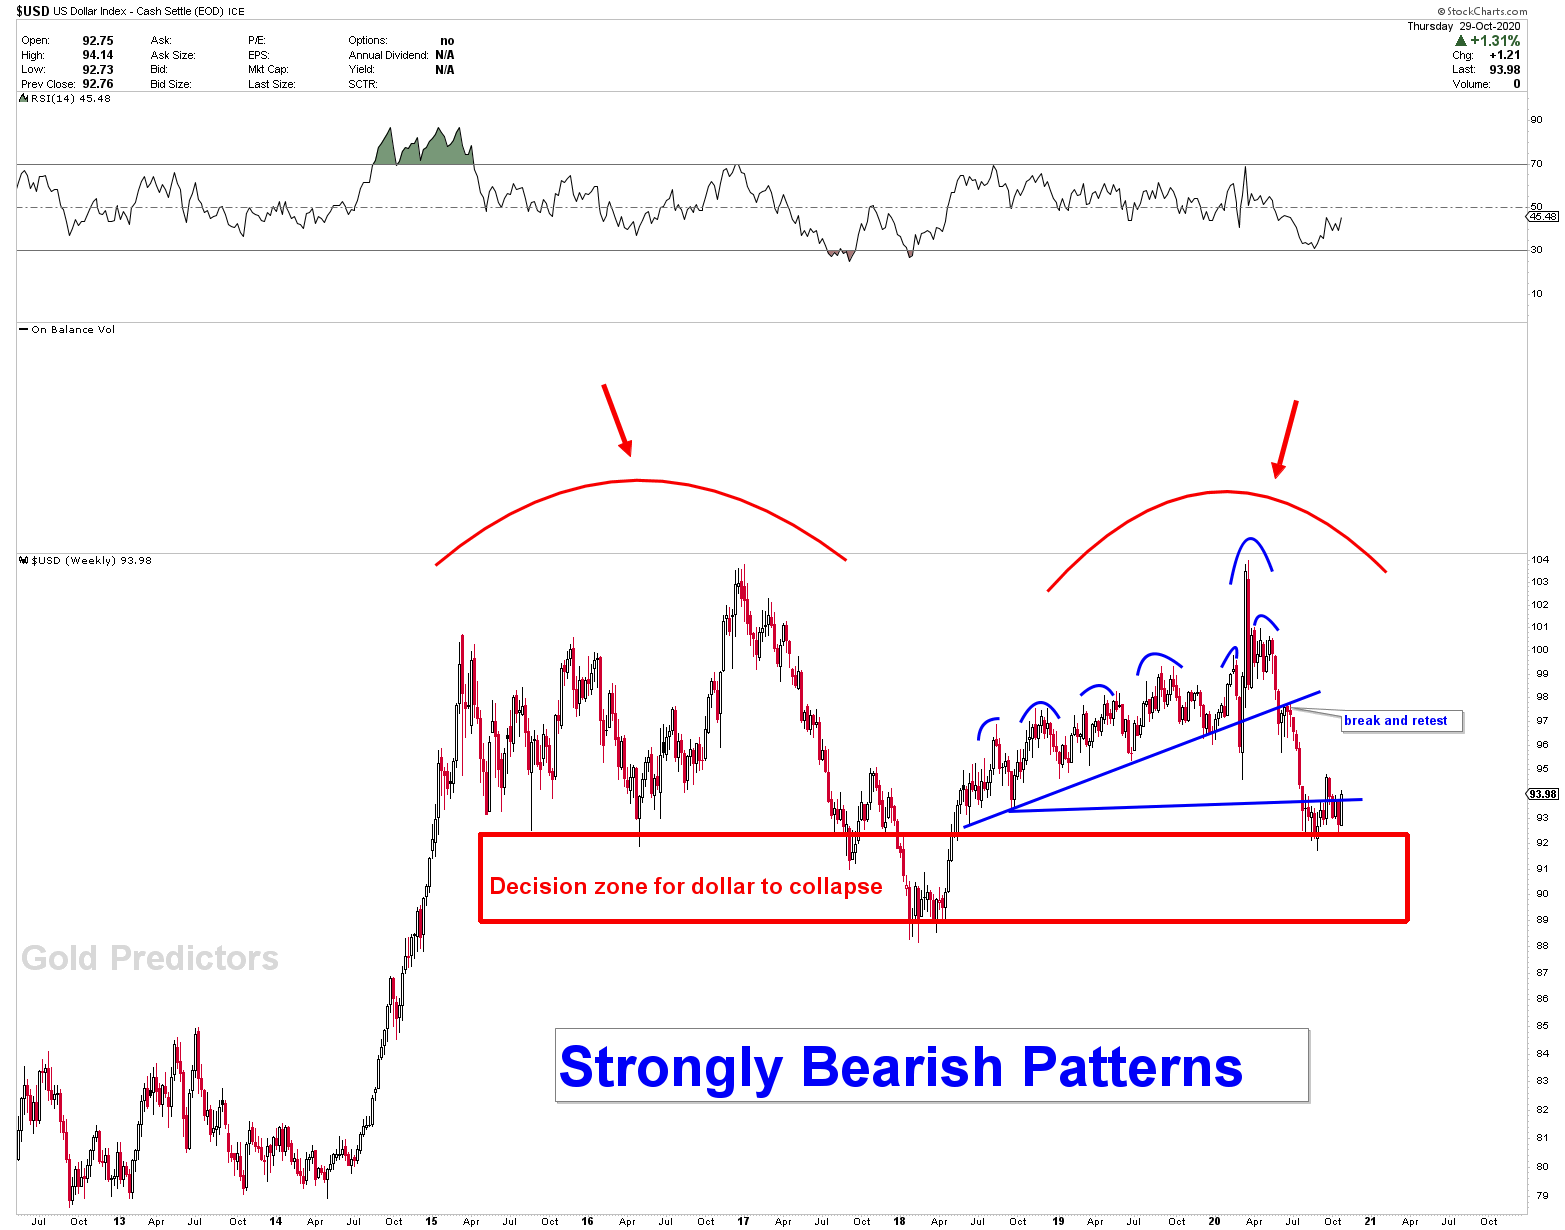
The chart published a month ago has not been changed and pattern classification is still has to resolve to downside. On this weekly dollar chart, prices have broken the blue neckline and are trading in most critical areas where, if broken down, waterfalls can start, indicating new skies in commodities.
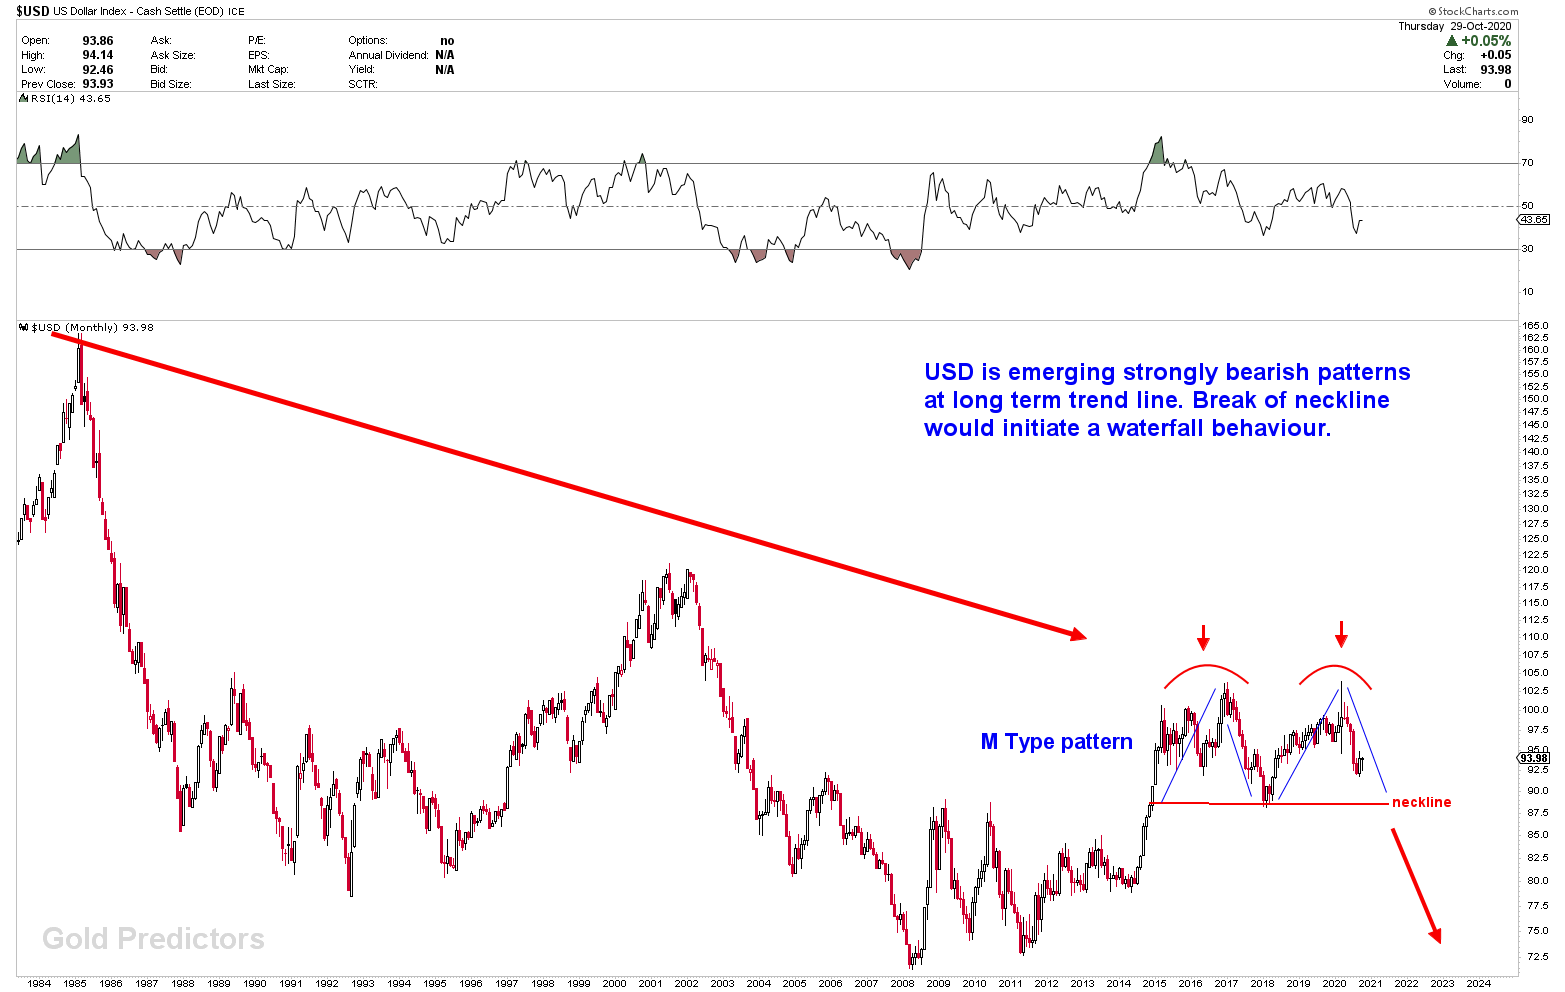
Let’s zoom out this chart on monthly scale. The dollar resumes after the long-term trend line where it emerges M-type patterns and a neckline break could be the real breakdown. Will expand this chart in a long-term article after election.
Gold Evaluation Before Election
To evaluate the gold price, we try to pick few of our charts, published in the month of September 2020. These charts are updated with the current prices as shown below. We marked the 1931 infection point. The number of 1931 was discussed since September 2020, and therefore we lifted our stop losses due to short-term uncertainty in gold markets. 1931 was the inflection point for the next move higher, this number was discussed in each article when price traded at 1848. The creation of rounded pattern after the break of triangle normally indicates we could get a short-term bottom during election.
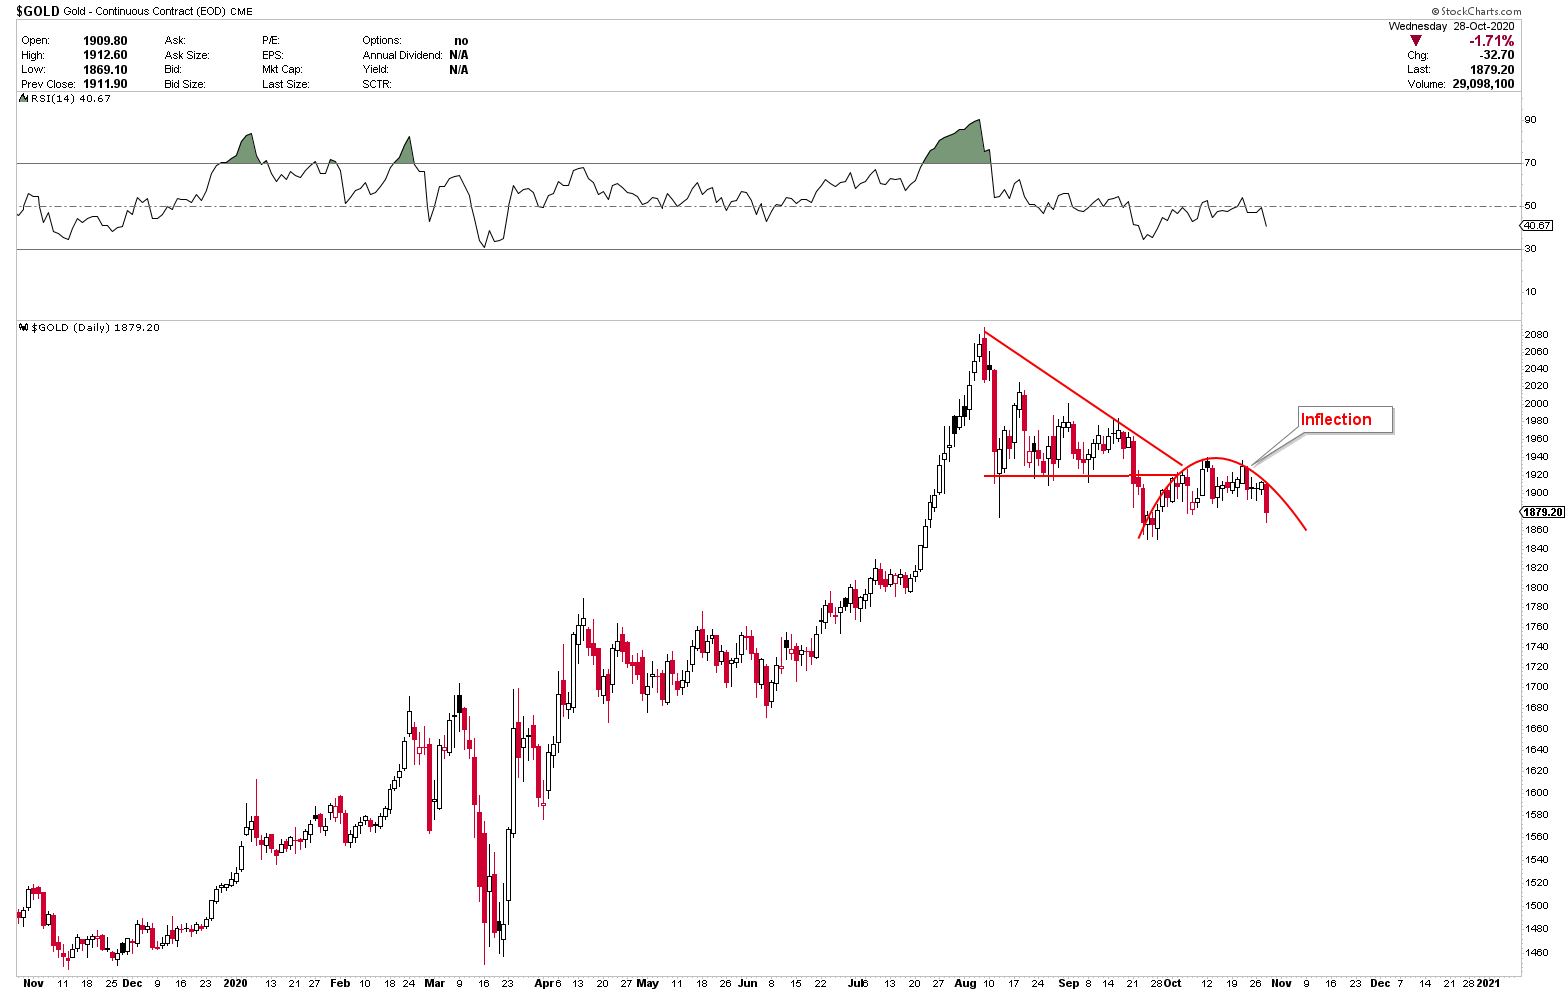
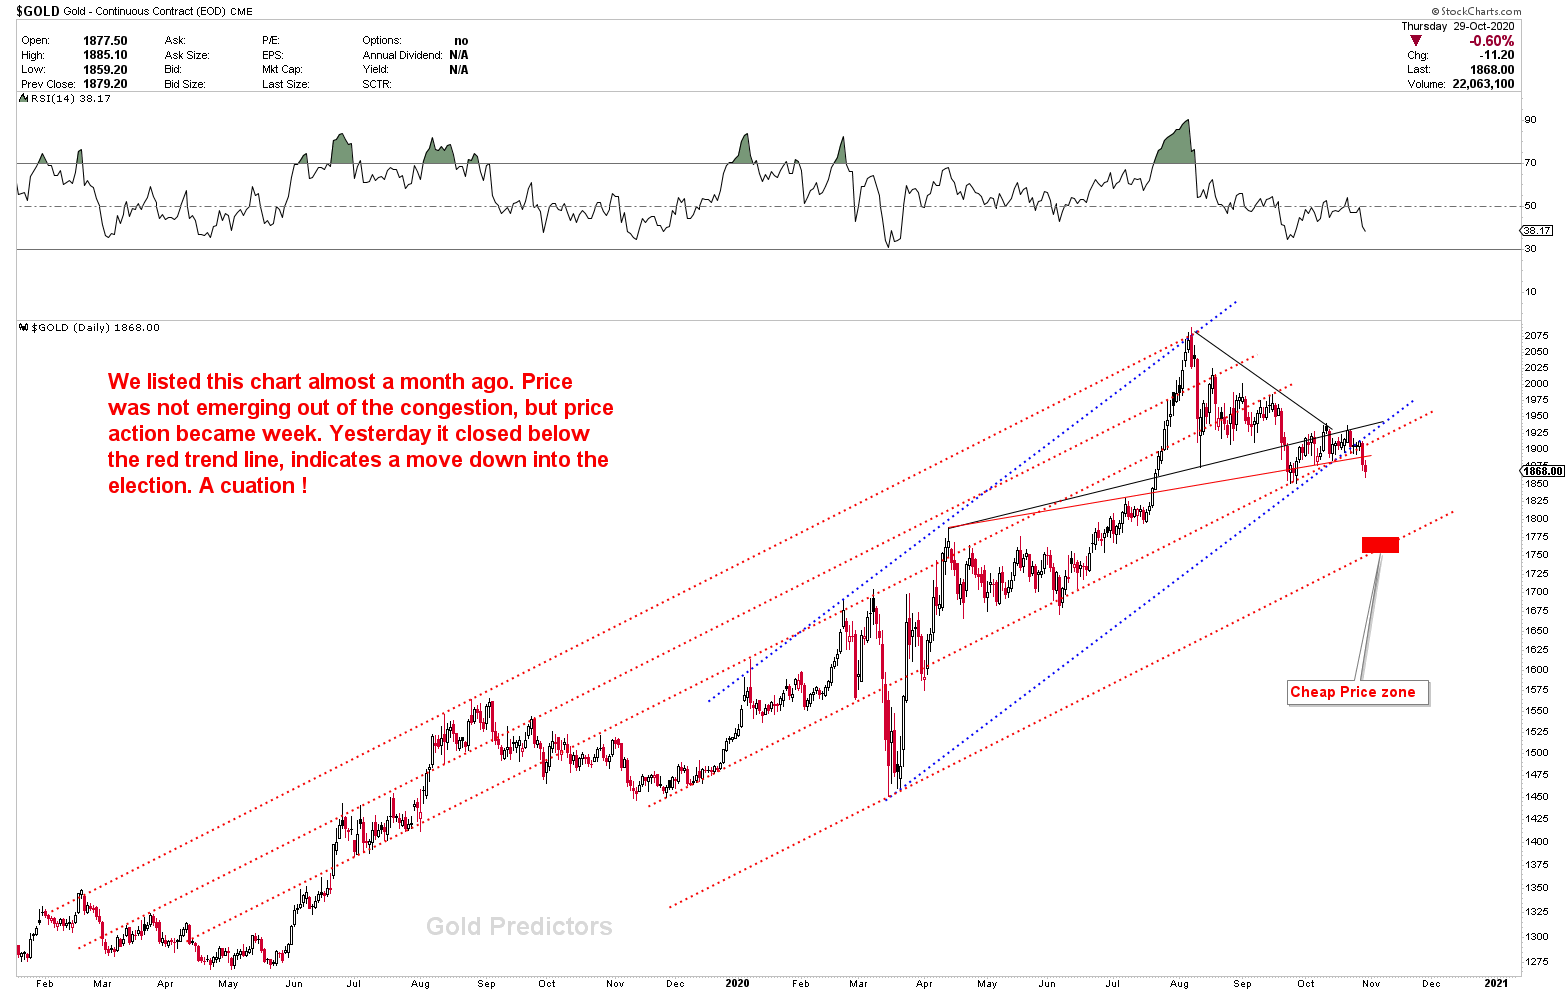
Yesterday, prices closed below the BLUE and RED trend lines and also produced a quick reversal from the black triangle indicating a conclusion to a due gold bottom in a few days. The bad thing is, this scenario happened just before 5 days of election, and therefore nothing is guaranteed, as there might be huge moves in any direction.
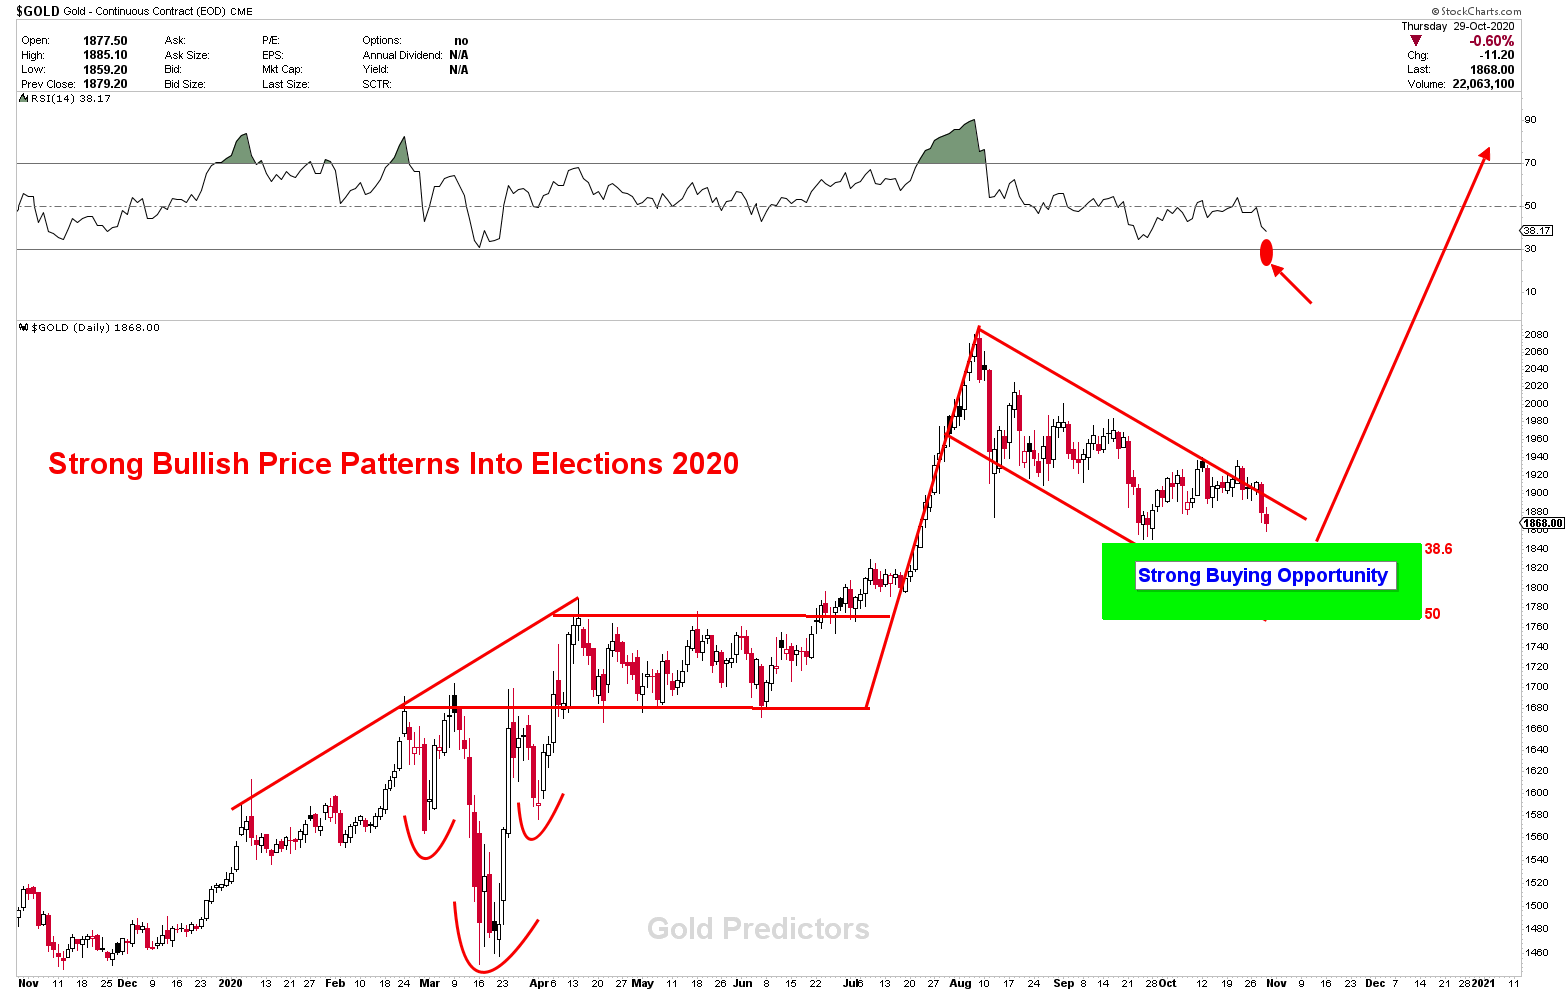
Lets have a look on the chart from the previous update again. We first posted this chart in early September. Few head fakes came, but the target remains the same. Gold pattern is extremely bullish. If prices hit the green support zone, this may be a good buying opportunity. The last low was 1848 inside the support zone, but to prove that low, the 1931 must be broken. Currently, a break of the last lows of 1848 will trigger a bottom somewhere in the green zones and we expect strong buying opportunities. The green zone is where lower trend lines are rising.
Gold Intermediate Term Cycles
The market cycle refers to the economic patterns observed in various business environments. A financial cycle is one when a certain security or several securities that belong to the same asset class perform better than others. This can be because the existing market conditions can be sufficient for growth according to the business model under which the securities work. Gold and Silver also move in the similar patterns. They produce, short term, intermediate term, medium term and long term cycles.
When gold fell sideways after 2011 top, the short-term and medium-term cycles began to change their periods. We stopped discussing short-term cycles because of high fluctuations and uncertainty. The beauty of gold and silver is that they hold their cycles over time, but due to massive uncertainty the timing and length are often influenced.
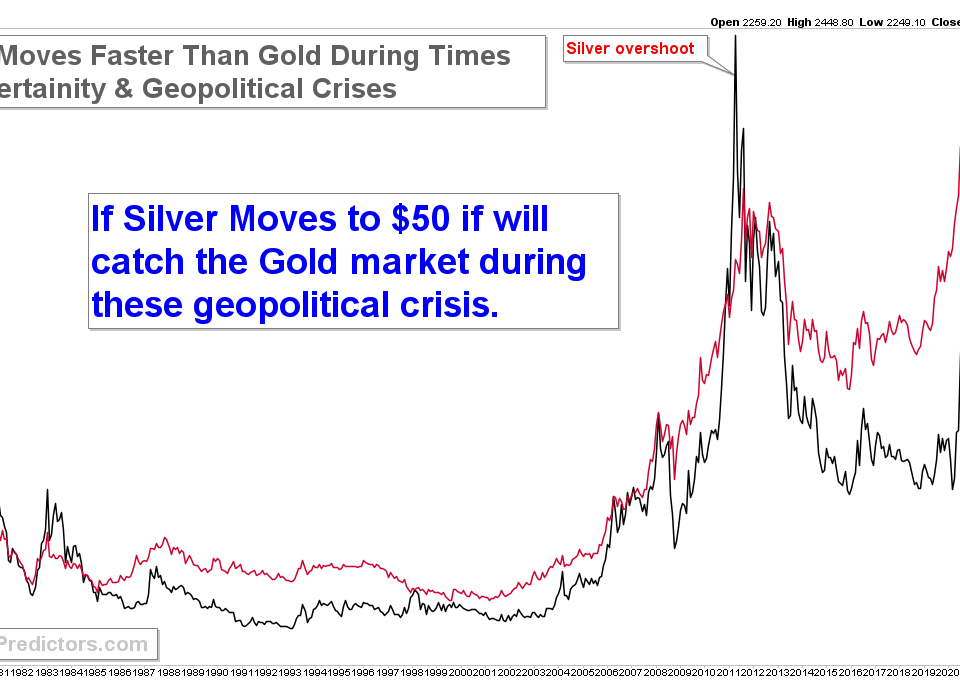
We are not trying to mention gold cycle in the illustration below. But we try to note the gold price relation to GSR (gold/silver ratio). The GSR is about how much silver you need to buy a single ounce of gold. If the ratio is 25 to 1, then you will use 25 ounces of silver to buy one ounce of gold at the current price. A narrow ratio will be called 25 to 1. A narrow ratio means that the relative value of silver is up and a wide ratio implies that the relative value of gold is up. This ratio is an indicator for determining the right and wrong times to buy or sell silver and gold. The gold / silver ratio profits when fluctuations occur.
Today, gold and silver trades are mostly synchronised without much adjustment. But if the ratio stretches or is narrow to extreme amounts, trading opportunities will be generated. The customer who owns one ounce of gold will sell it and buy 100 ounces of silver if the GSR is extended to 100. As the ratio increases, silver is more favourable because silver is much cheaper relative to the ratio. Some consider trading with the GSR to be a good technique for accumulating either gold or silver. As shown in the following chart, when GSR peaks, the price of gold bottoms and good buying opportunities occur in the gold chart. The case of the top and bottom of August and March are visible in the charts. As GSR rises, it shows that silver moves slower than gold, or that silver is weaker than Gold. If GSR drop, the silver is stronger than gold. Silver lead gold, particularly when gold enters the bull phase. Yesterday, the GSR break to rise, suggesting that a new high in GSR will produce a bottom in the gold and silver, which must be a good buying opportunity in gold.
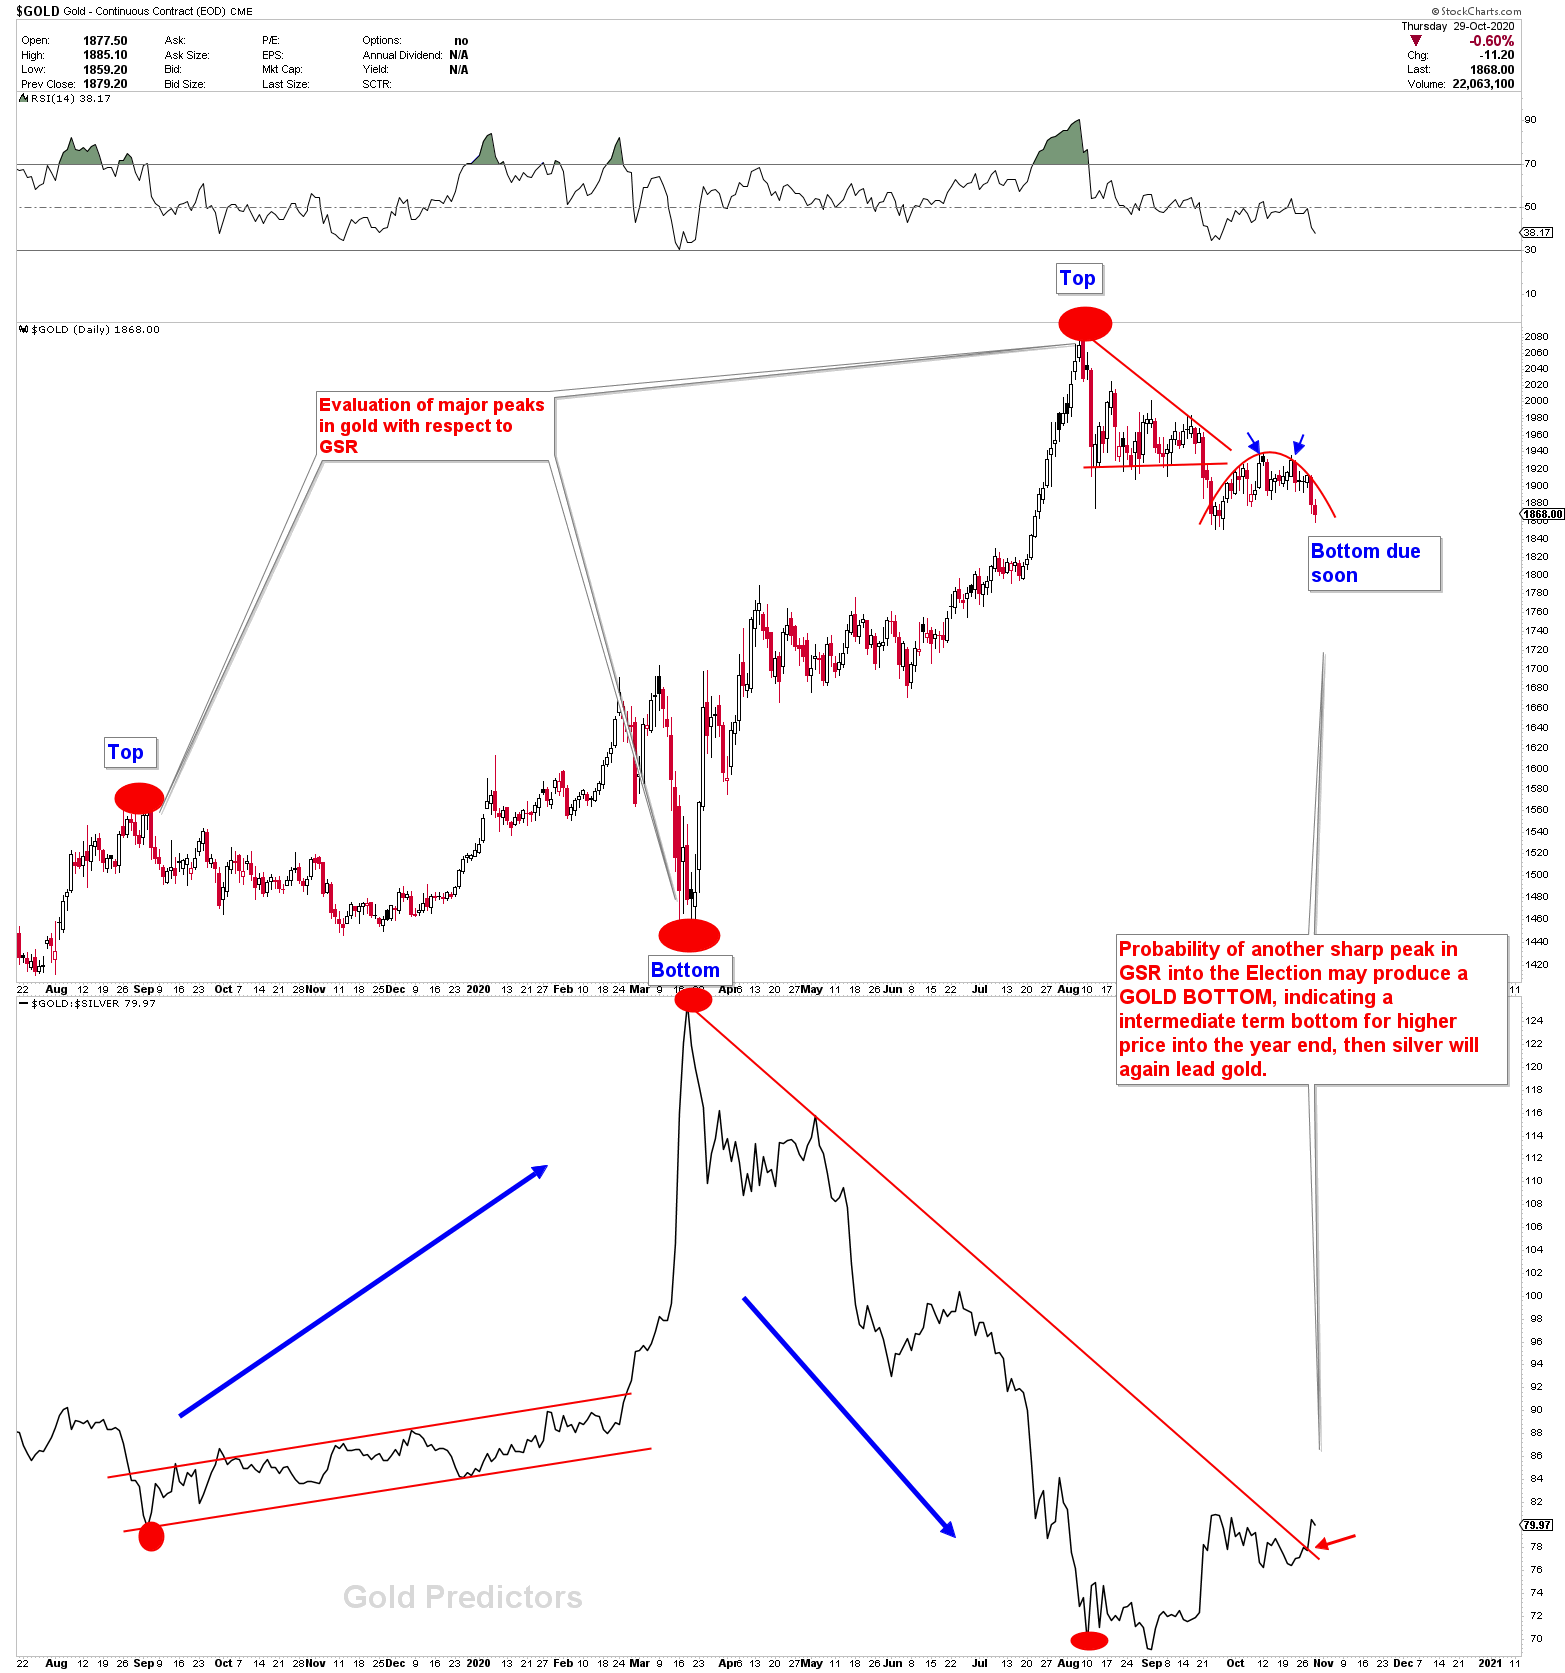
Let’s go through weekly gold charts to look at the intermediate-term cycles to measure them using the GSR ratio. It is clear that prices have not looked back as expected as the eight-year cycle provides a baseline of gold. The intermediate-term period comes every four to six months. The time difference depends on the evaluation of other value drivers, as explained earlier, the gold cycles vary due to the influence of other variables. All intermediate-term cycles are marked with red circle. The red circle(filled) shows that each intermediate term cycle provides a bottom. And Red circle (unfilled) shows that the cycle failed to produce a clear path (or, in other words, the cycle failed). In the past 40 years of gold chart analysis, intermediate-term cycles work perfectly well enough to produce a bottom with probability of 80%, only when gold is in UP phase(or Medium Term Uptrend). As stated in the previous article, gold moved to UP PHASE in early 2019. After that period, the intermediate term cycles are all marked by a red circle (filled). The next intermediate term cycle is due in Oct/Nov 2020 and the above justification suggests that a gold bottom is expected from today and lasts for the next few weeks. That suggest gold can bottom anytime from now. Therefore, there might be a little peak in GSR and then a sharp reversal, which will confirm a gold bottom, Silver will lead after the peak in GSR appear.
Covid19 and Unemployment rate
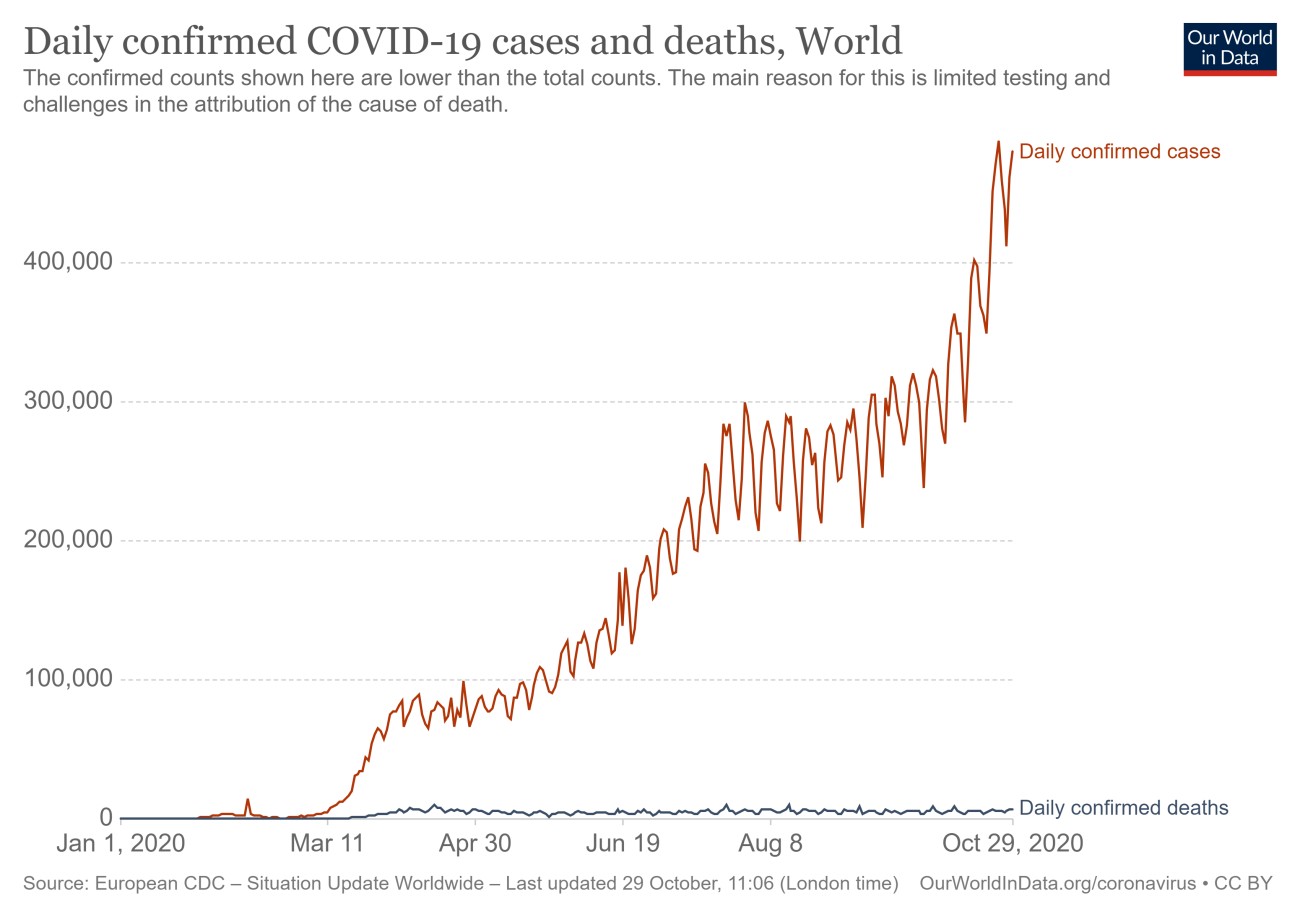
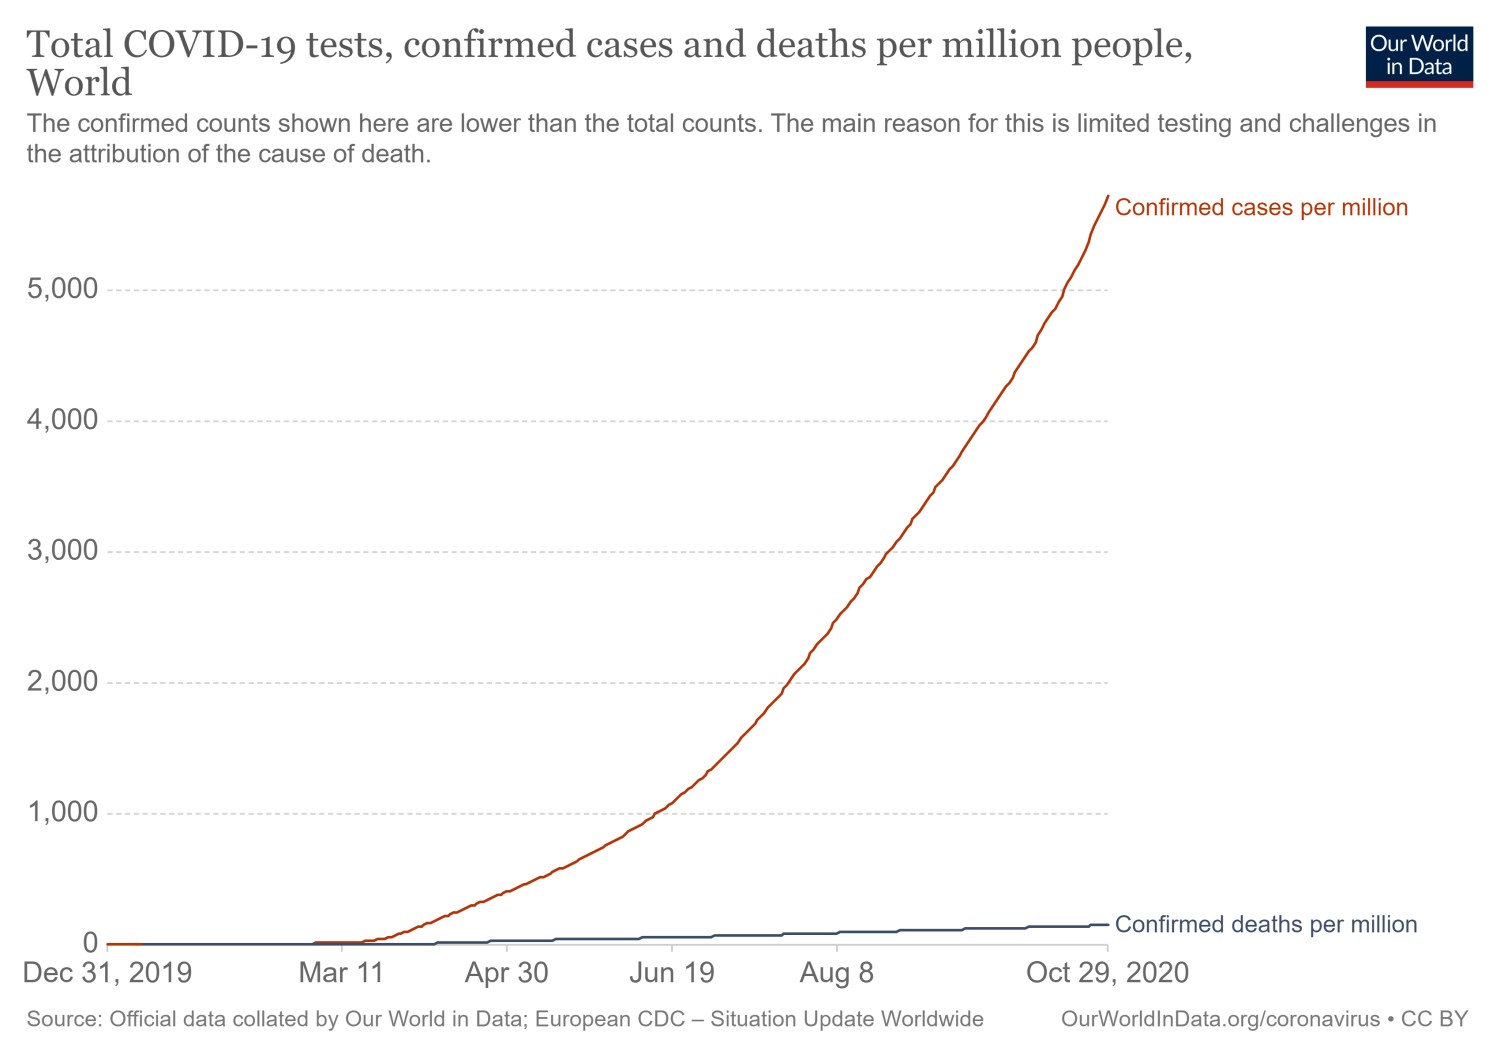
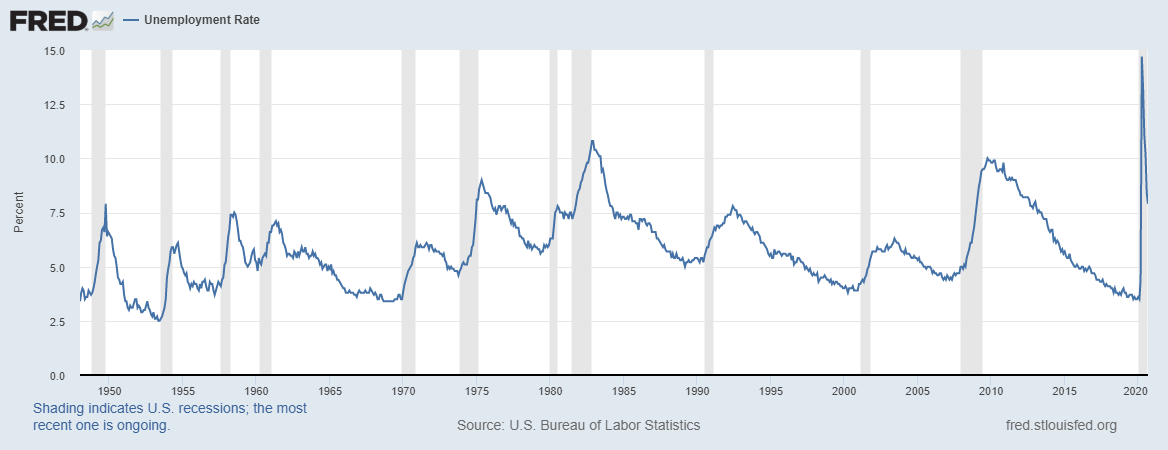
Daily new cases of covid worldwide increase to record highs. And the trend is steadily increasing, as shown in the following figure. There is still no news that the virus will be cured, and even if positive news is available, the situation can not be fixed easily. After the first wave of covid, some governments ended the lock-up and became usual, but as the number of cases and daily deaths suddenly grew, many countries again imposed lockdown and took effective actions. The unemployment rate in May 2020 was 14.7 %, breaking history’s record highs. The rise in the unemployment rate affected many other far-reaching economic factors. And the latest unemployment rate recovery is not enough to say the economic shift is healthier. Record of new cases of COVID-19 and already high unemployment may also make another stimulus, but this is unlikely to change the course of election. Our long-term gold and silver outlook is extremely bullish. In November, or a few days after the elections, we expect to see the gold bottom out, based on the results of the elections. After this, we expect gold to rise dramatically.
Silver need another update. The story of silver is not much different, but we will update silver in another update.
Gold & Silver important levels.
(All numbers are in Spot Prices.)
We picked a bottom for both Gold & Silver but we clearly identified that in order for gold and silver to confirm a bottom at 1848 and 22.90, gold and silver must close above 1931 and 25.55 respectively. Gold did not even close one hour above 1931 spot and Silver reversed from 25.557 (0.007 cent of accuracy in silver). The high in gold was 1933.28. Well, only because of verification from our AI team, this kind of excellence helps us identify such numbers using data mining algorithms and the AI models. We further equate those numbers with our price action and technical analysis. Thanks to AI team.
What’s next?
Instead of breaking above 1931, gold produced an inflection point and a rounding top signaling that last low of 1948 had a high chance of being hit. The pattern also created a bear flag we discussed in recent updates. The bear flag shows gold must fall lower, if broken. Our predictions of 50/50 probability have now changed to 30/70, with 70% probability of a downward move before election. Our thoughts and analysis remain the same after these setbacks, and the support levels remain the same.
Gold’s best support is 1836 (plus minus $20). That’s 1816-1856 region. The last gold bottom was 1848, which was the prime reason for a long at 1851. Note, a daily close below 1836 would indicate that prices go further down. A two-day close below 1836 will confirm this.
The second support level is 1763 (plus minus $20), making support zone of 1743-1783. In simple words, 2 daily closures below 1836 will trigger 1763. Currently, we expect 1836 to be a good support, but we will evaluate the exact numbers as time goes.
Silver supports
We’ve discussed significance of 22.90 level in silver. Silver must close below 22.90 for more weakness. As long as 22.90 holds on a closing basis, a weekly closing below 22.90 will target 20.73, which is a strong buying consideration. We don’t see silver below 18.60 in any kind of jerk. That’s only 0.001% probability. Don’t expect these numbers to be exact, but according to 50 years of historical mining, silver brings the lows and highs with 80% accuracy. There’s the latest example of 25.55, when we mention the resistance of 25.55 and the high was 25.557.
Traders
We dont want to throw our words to you so you just make false decisions. As this is the time to wait and watch. We advice you to be patience and see how things go. We would like to execute trades in Gold and Silver. We will post using pending orders.
Final Words
Growing number of covid cases, high unemployment rate and election during those turmoil put the situation in high uncertainties and therefore elections might be the most crucial election of the generation. Our thought and evaluation for silver and gold remain constant, as we expect gold to rise during or after the election. But due to extreme uncertainty, there could be major jerks and fake moves in either direction before the actual move happens. Traders across the globe will be looking to catch the swings. Gold must bottom at either 1836 or 1763 or in between them with Silver at 20.63 or little higher. We don’t see silver below 18.60 in any case. The only chance for silver to spike below 18.60 is less than 1%. And if it happens then prices will not stay longer and move sharply up. Just keep in mind, we are not distracting from our analysis. Our analysis remains constant. The current low in gold of 1848 is within our first support zone of 1816-1856. As this is the time of High Uncertainty, there is nothing guaranteed. A sharp reversal from 1848-60 and then a move above 1931 would produce a double bottom and would confirm that gold bottom is already IN. The probability for this to happen is becoming low.


