


Gold Trades At Critical Region
The gold price looks to extend its rebound from the support region, while the US dollar index is taking a deep breath after a strong rally. The August Nonfarm Payrolls (NFP) and unemployment rate will be released on September 2, 12:30 GMT. These announcements are likely to trigger severe market volatility. Analysts anticipate that the US economy created 295K new jobs last month. The unemployment rate is anticipated to remain at 3.5%. Investors and traders are particularly focused on wage growth, which is predicted to accelerate from 5.2% YoY to 5.3%. Weak NFP numbers are expected to exert pressure on the USD and strengthen the gold, as investors speculate that the Fed would soon abandon its aggressive stance and begin to ease. On the other hand, strong NFP numbers are anticipated to strengthen the USD and weaken the gold, underlining the labour market’s stability and fueling predictions of another 75-point rate rise in September. It is critical to monitor the adjustment of the prior Nonfarm Payrolls statistics, which stood at 528K. In addition to the most current numbers, this might have a substantial influence on market sentiment. The technical side of the gold market spells out the fundamental view because gold is on the major decision numbers where heavy volatility can cause massive moves.
Understanding the Gold Critical Region
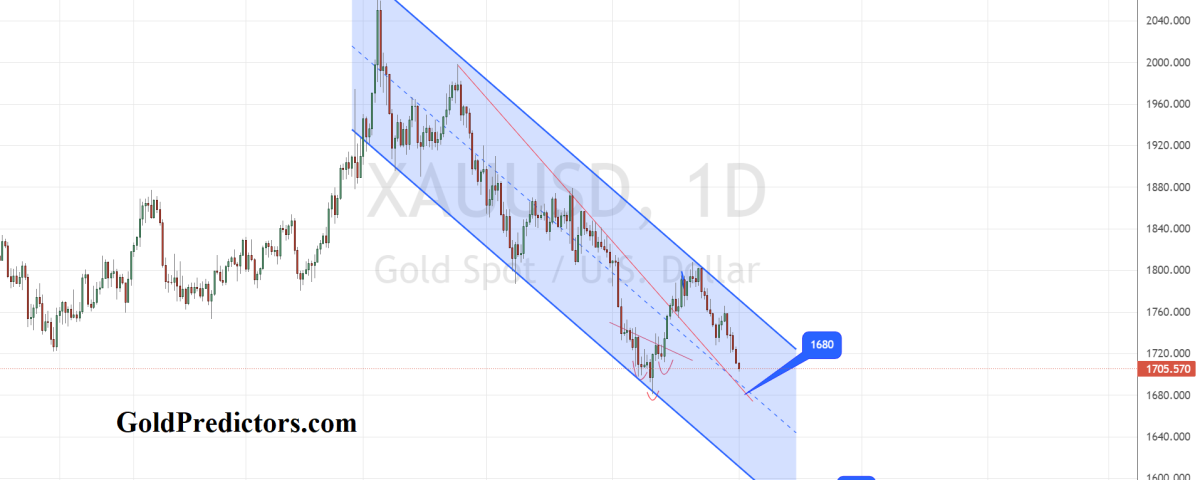
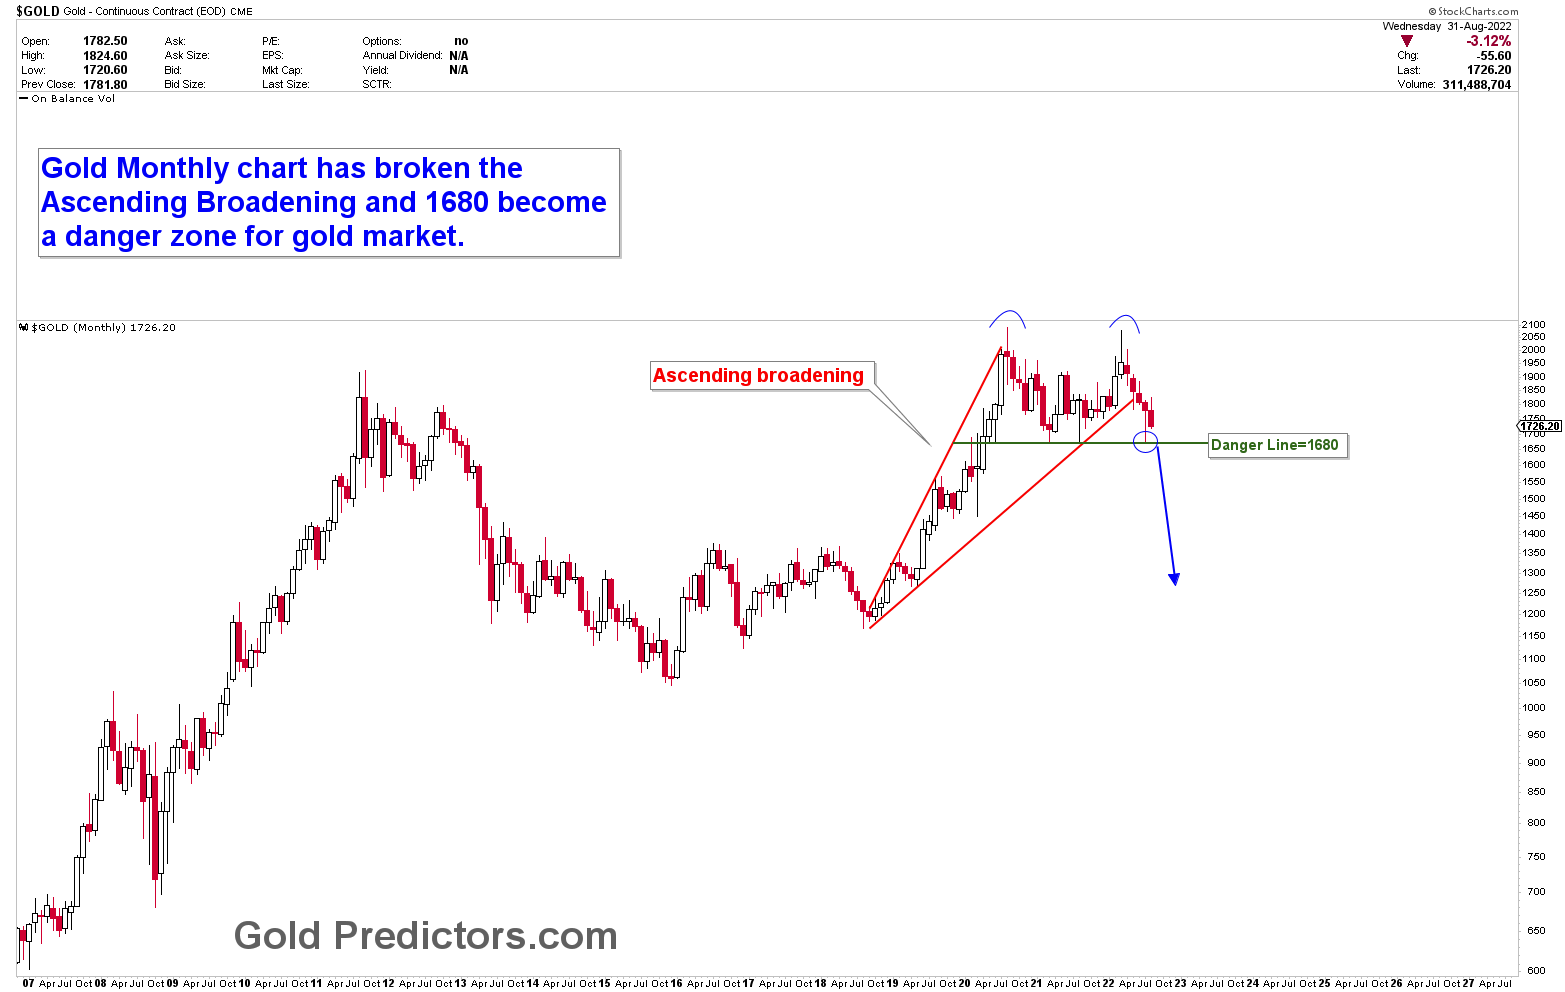
The gold market has reached its target of $1,680 but remains negative. The inflection point of $1,680 was discovered in February 2021. This number is performing exceptionally well, and it produced a bearish top pattern with the development of head and shoulders on weekly charts and a double top on monthly charts after several hits. The ascending broadening patterns were broken, indicating some downside pressure in markets, but this inflection point is also an important support level for bears. We became bearish in gold in April 2022 as a result of the formation of a bearish inverted cup and handles on daily charts, and we set a target of $1,680, which we have now achieved. Gold is approaching a critical level from which a breakout would send prices to multi-year lows. For traders, the main question is whether the double top has been confirmed or whether buyers can still intervene by producing a short-term double bottom at $1,680. This article will discuss the scenarios for bulls and bears at this critical juncture.
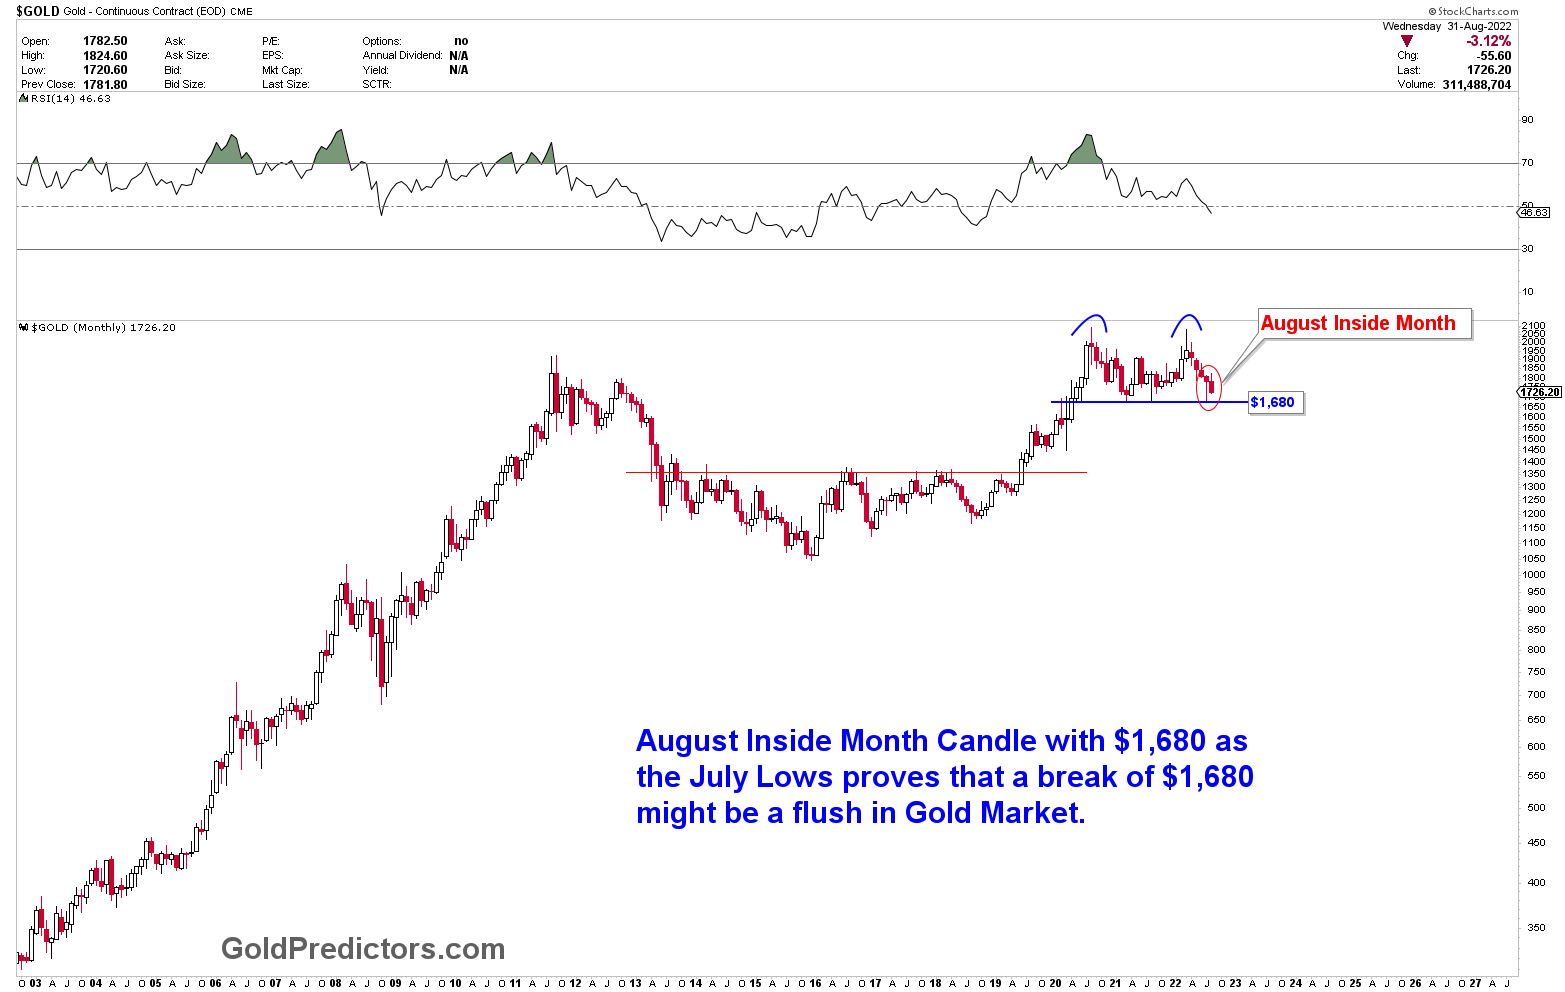
Another chart shows that the month of August was an Inside Bar, indicating that the market was coiling in the month of August. The Inside Bar is above $1,680, and the neckline for this inside candle is also at $1,680. Under normal circumstances, a break of the inside candle represents a significant move in either direction. Since the monthly charts show the development of a double top with a neckline of $1,680, the inside bar demonstrates the importance of this level. Today’s employment data could be the catalyst for the next move.
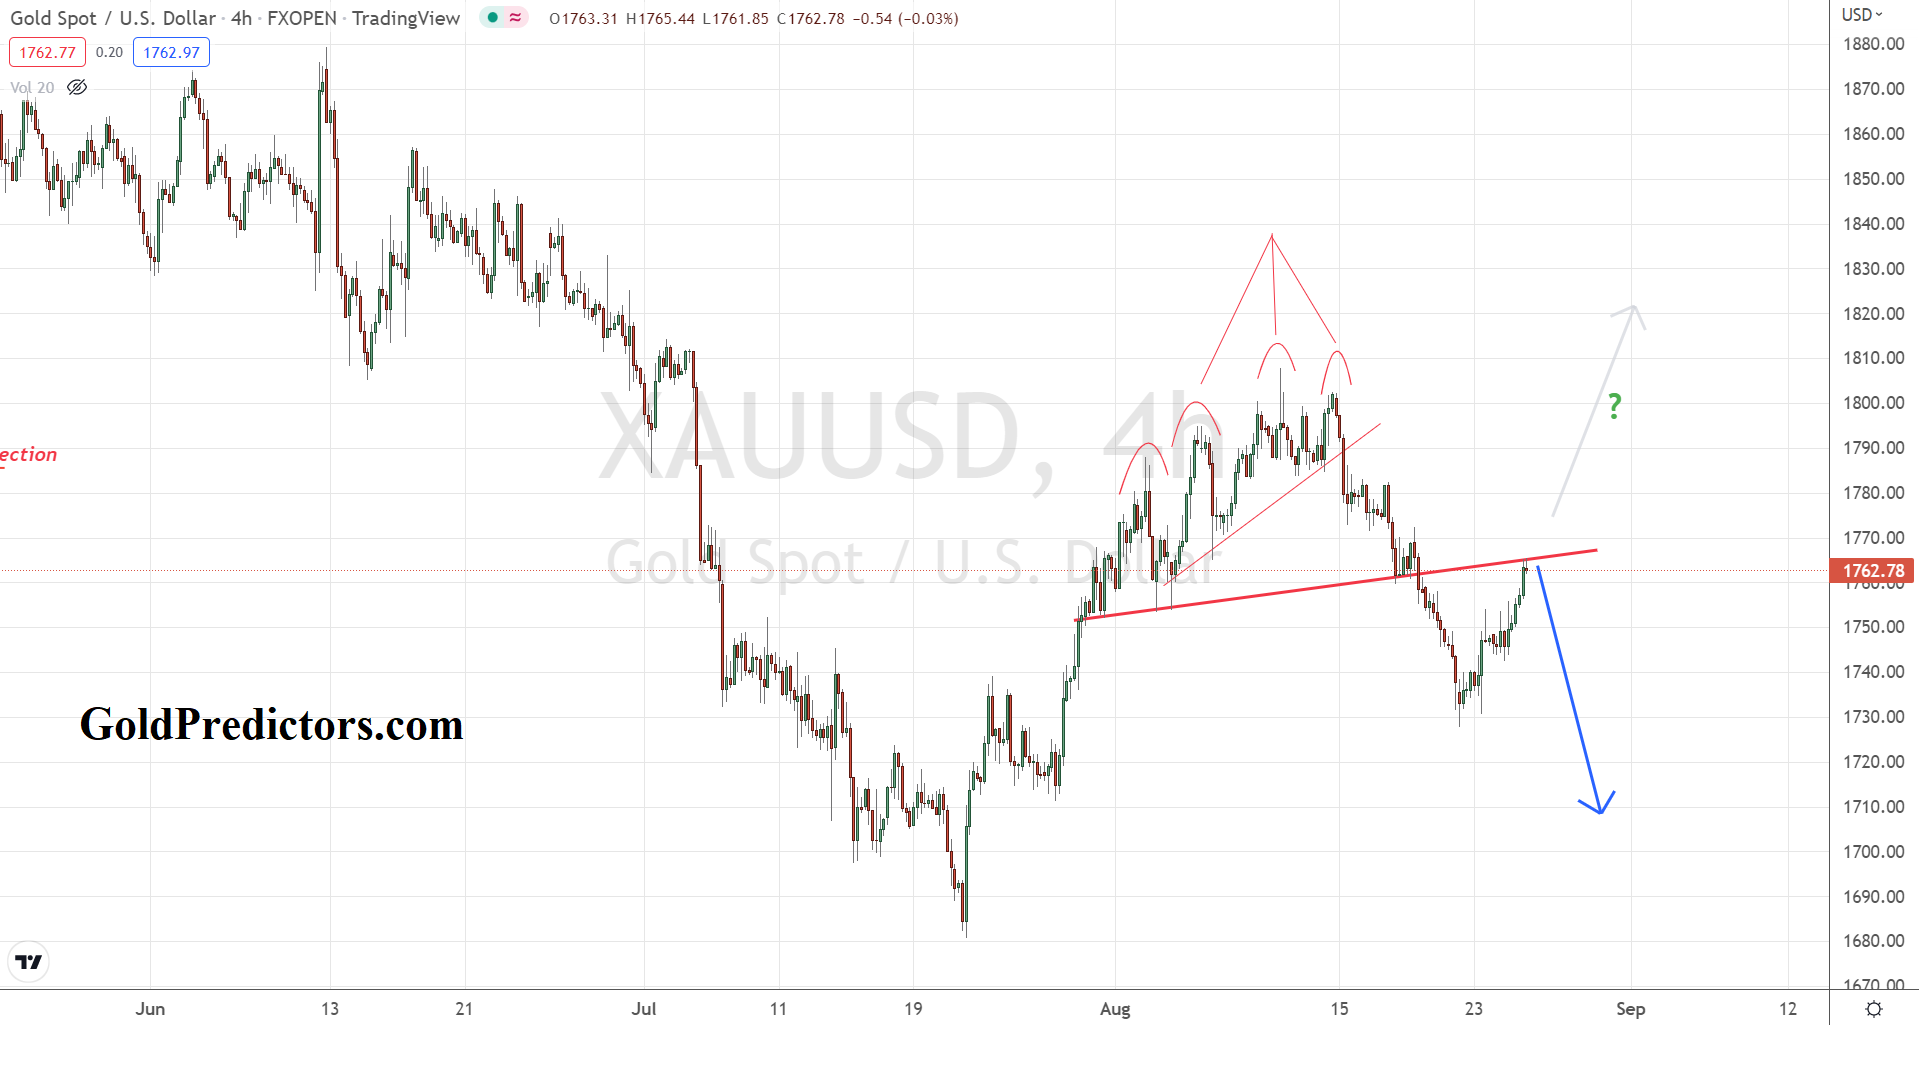
How to Position Gold Trades at Inflection Region
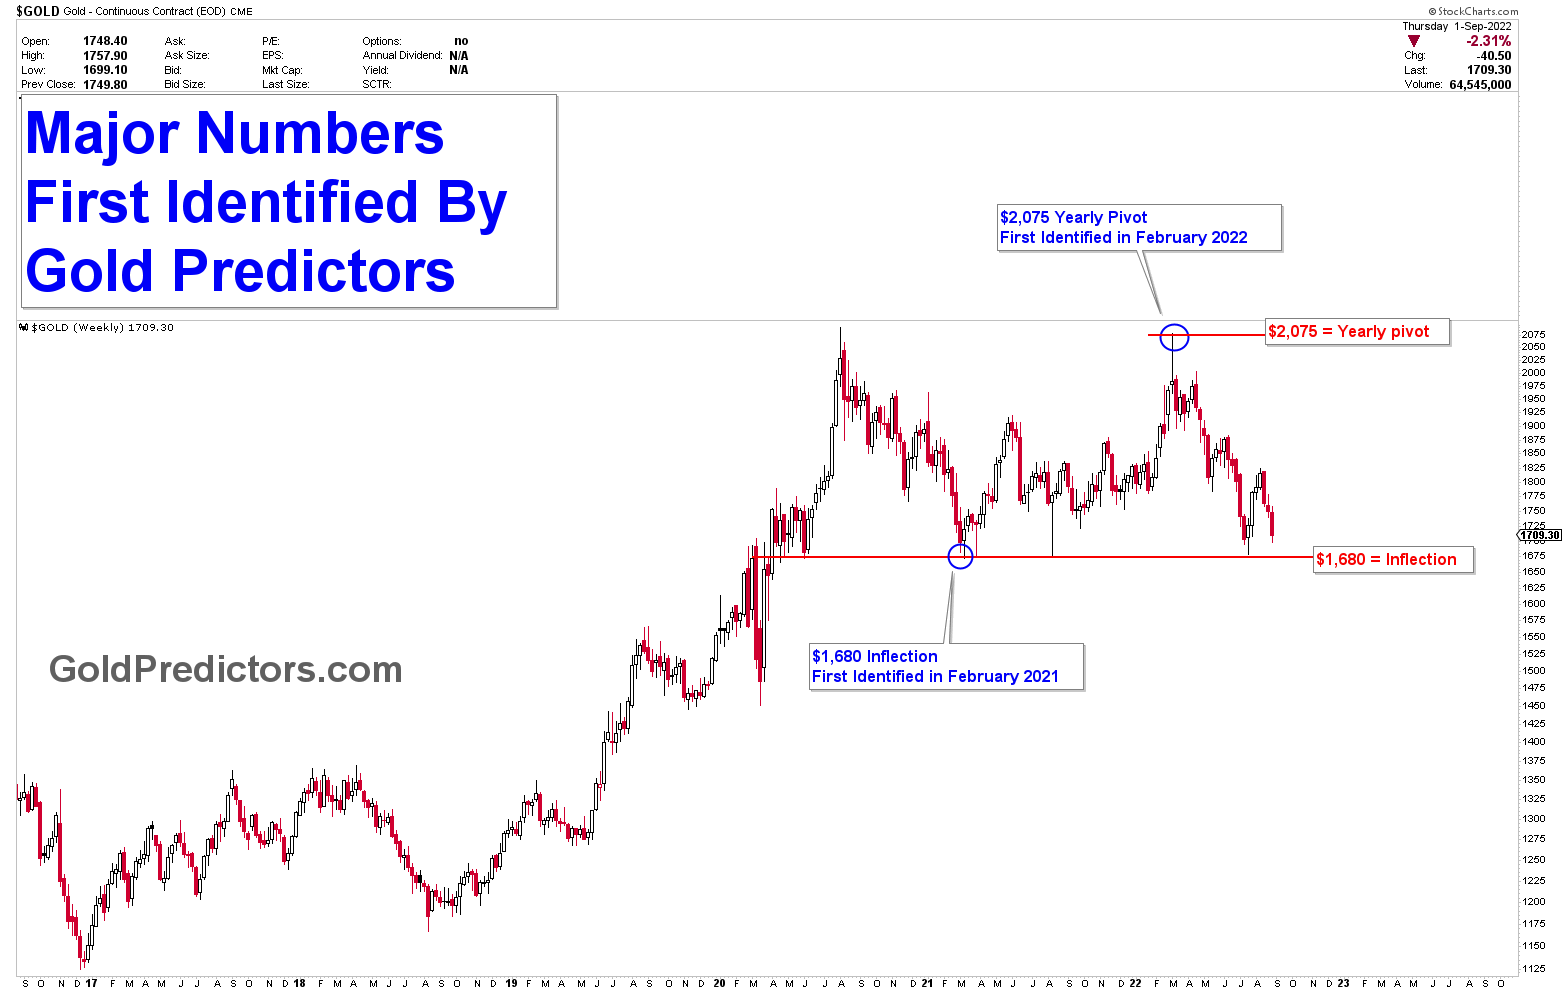
Our prediction model identified the 1680 inflection in February 2021. This number has been tested four times since its identification on the weekly chart, and it is currently being tested for the fifth time. The price action analysis shows some weakness with the fifth touch due to the formation of a double top at the yearly pivot of $2,075. A similar impact major level was identified in February 2022, with the ideal number of $2,075, where a major rally in the gold market was expected. Gold peaks at $2,075 and falls in a bearish formation, producing an inverted cup and handles on daily charts, followed by a slew of bear flags. Today is a high-volatility event, and the gold market usually breaks this type of major inflection on its fifth or seventh touch.
Traders looking to sell at the current level must be cautious, and only a clear breakout should be considered for action. Those looking to buy $1,680 should be cautious as well, as a break of this inflection level has brought significant risk due to the Monthly Inside Bar’s significant coiling energy and the 5th touch of the danger line. The sections will be discussed further in the premium sections.
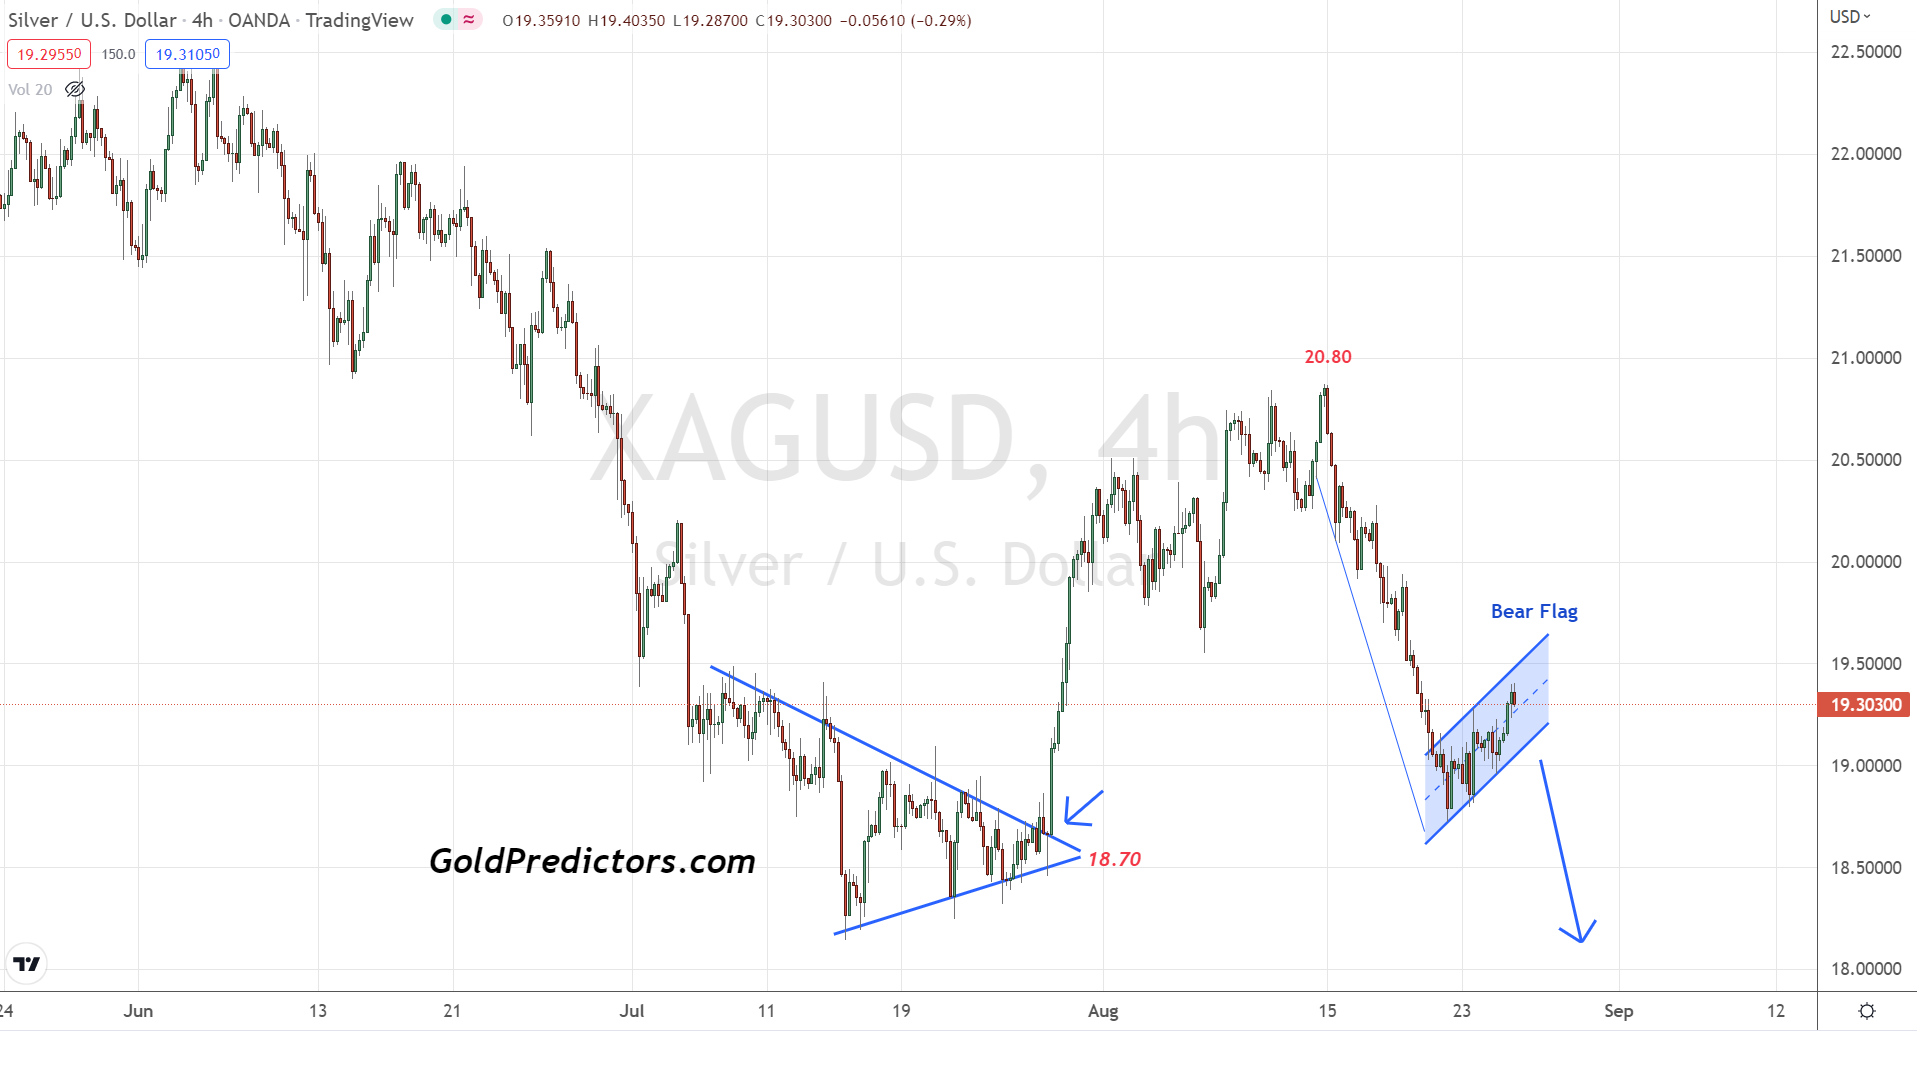
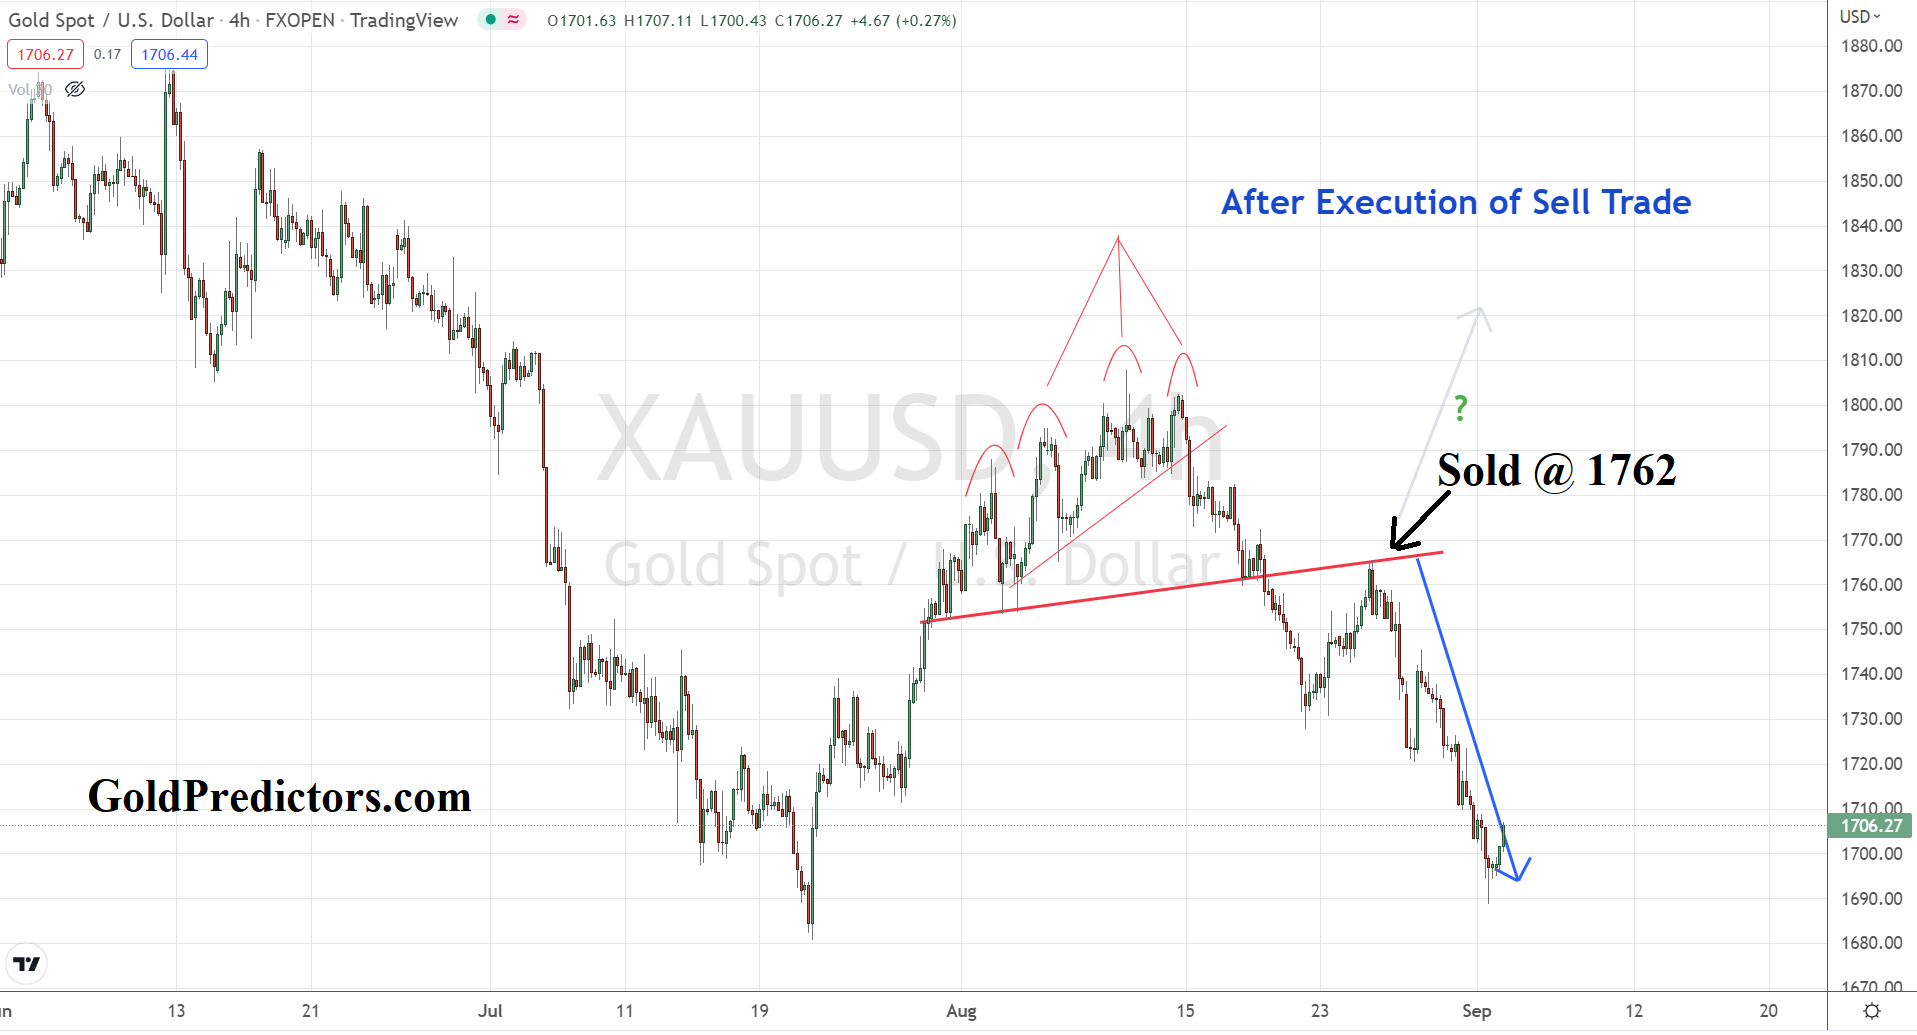
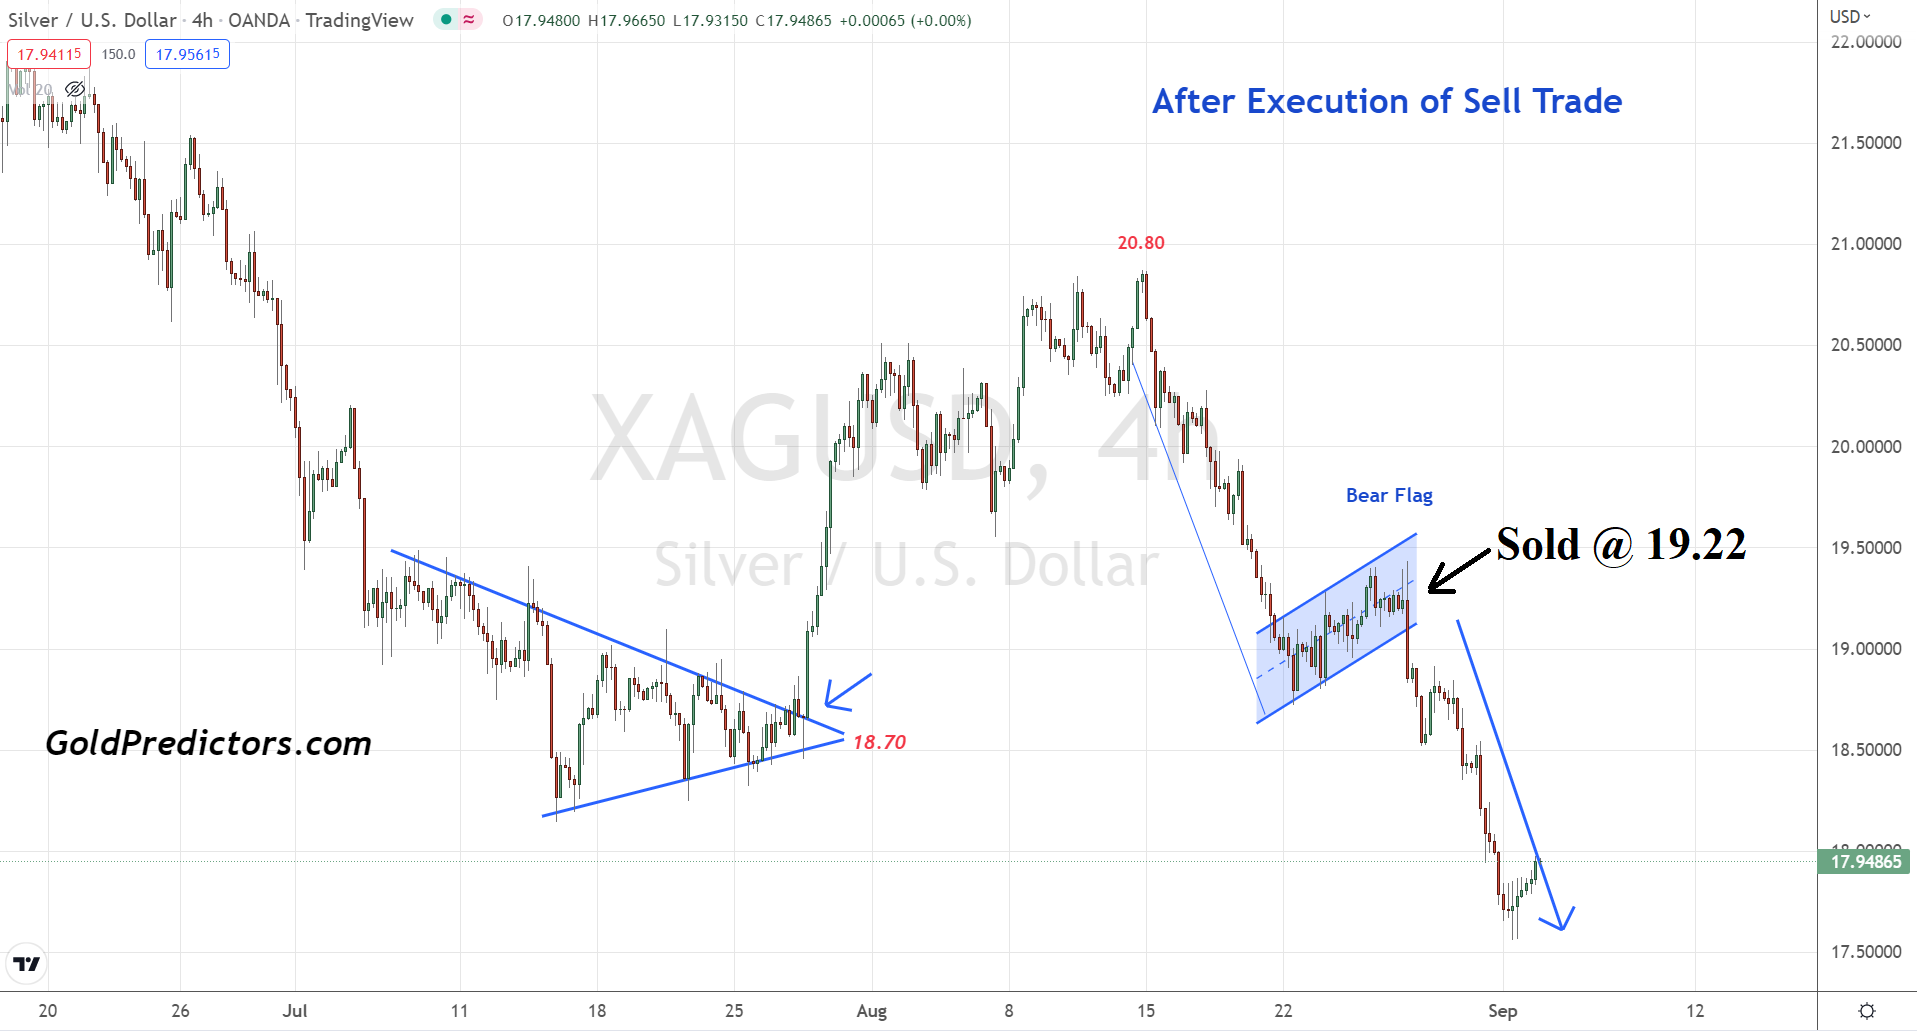
We used WhatsApp to send a sell signal in both the gold and silver markets. We stated unequivocally that the levels to sell both metals are $20.80 in spot silver and $1,772-$1,833 in spot gold. We made a good profit on spot silver at $20.80. We executed a sell trade in gold at $1,762 and a sell trade in spot silver at $19.22, and both metals fell hard and are now approaching significant inflection points.
The charts below depict the short-term price movement following the execution of gold and silver trades. Price is now approaching significant levels, and decision on how to manage these trades will be made.
Please login to read full article!
Please subscribe to the link below to receive free updates.


