


Gold Price Forecast: XAUUSD Strengthens as Gold-to-Dow Ratio Surges
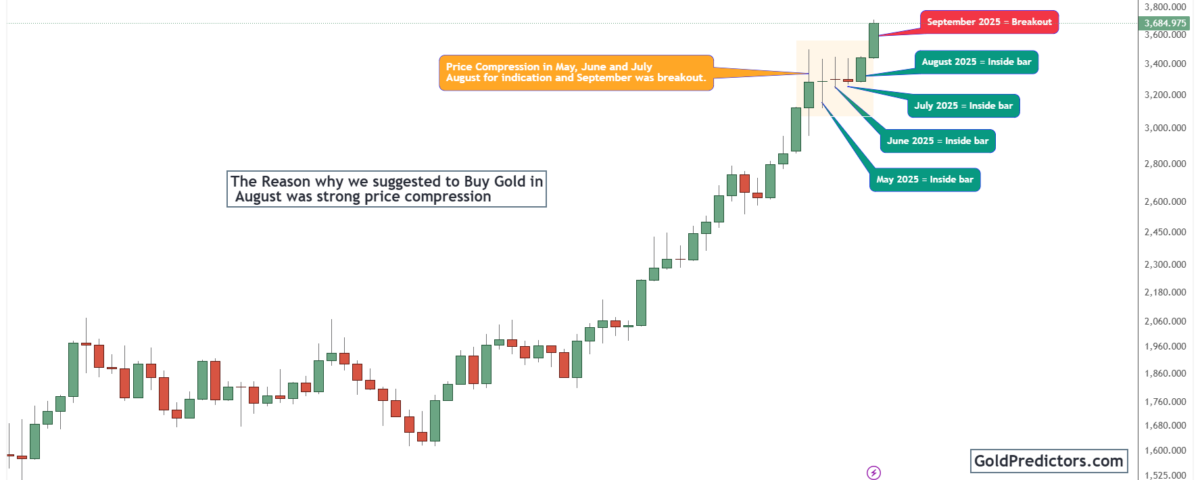
Gold (XAUUSD) is showing renewed strength after months of tight consolidation. From May to August 2025, price action remained inside a narrow range, forming a series of inside bars. This setup reflected compressed volatility and subtle buying pressure. In September 2025, gold broke out decisively, supported by substantial volume and trend alignment.
At the same time, the gold-to-Dow ratio confirmed a structural shift in favor of gold. Together, these developments suggest growing long-term interest and rising demand for safe-haven assets. Technical and intermarket readings indicate the potential for continued upward movement.
Gold Breaks Out of Monthly Compression Zone and Confirms Long-Term Uptrend
The gold chart below shows a clear four-month compression pattern on the monthly timeframe. From May through August 2025, gold formed consecutive inside bars, with each month’s price action staying within the range of the previous candle. This pattern signaled a period of consolidation, marked by low volatility and indecision. Typically, formations like this indicate market accumulation and are known to trigger sharp directional moves.
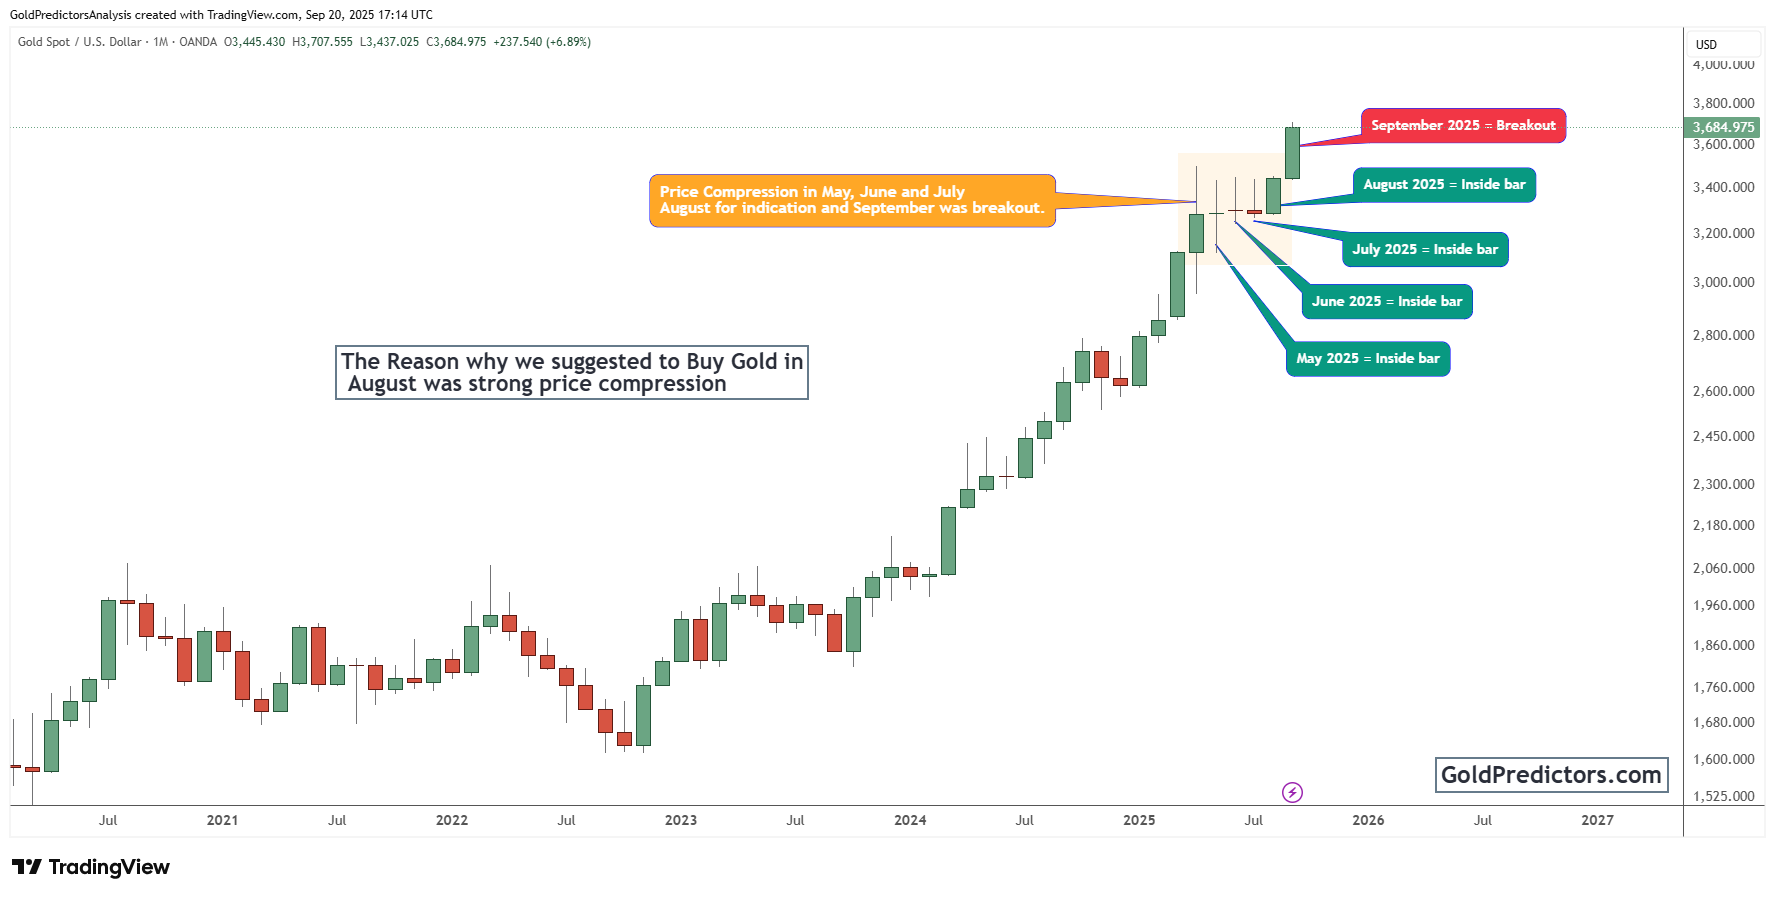
Throughout this period, gold traded within a narrow range between roughly $3,000 and $3,450. This narrowing price action indicated compressed energy and fading volatility, setting the stage for a breakout. Moreover, the structure gained strength with each inside bar, while August quietly signaled buying interest ahead of the breakout.
In September 2025, gold surged out of a multi-month compression zone. As a result, the decisive move led to a strong monthly close, reinforcing the broader uptrend. Moreover, substantial volume added conviction, validating the breakout. This underscores the importance of monitoring inside bar formations on higher timeframes as early signals of directional strength. Such setups can offer high-probability entries when aligned with the prevailing trend.
Gold-to-Dow Ratio Breakout Signals Long-Term Outperformance
The chart below illustrates the gold-to-Dow ratio, highlighting gold’s relative strength compared to the Dow Jones Industrial Average. This long-term ratio, spanning multiple decades, is now indicating a major structural breakout in progress. Following years of compression, it formed a multi-decade triangle with a rounded bottom, after which the ratio began to turn upward. Notably, a key breakout occurred in 2024, and since then, the ratio has been climbing steadily.
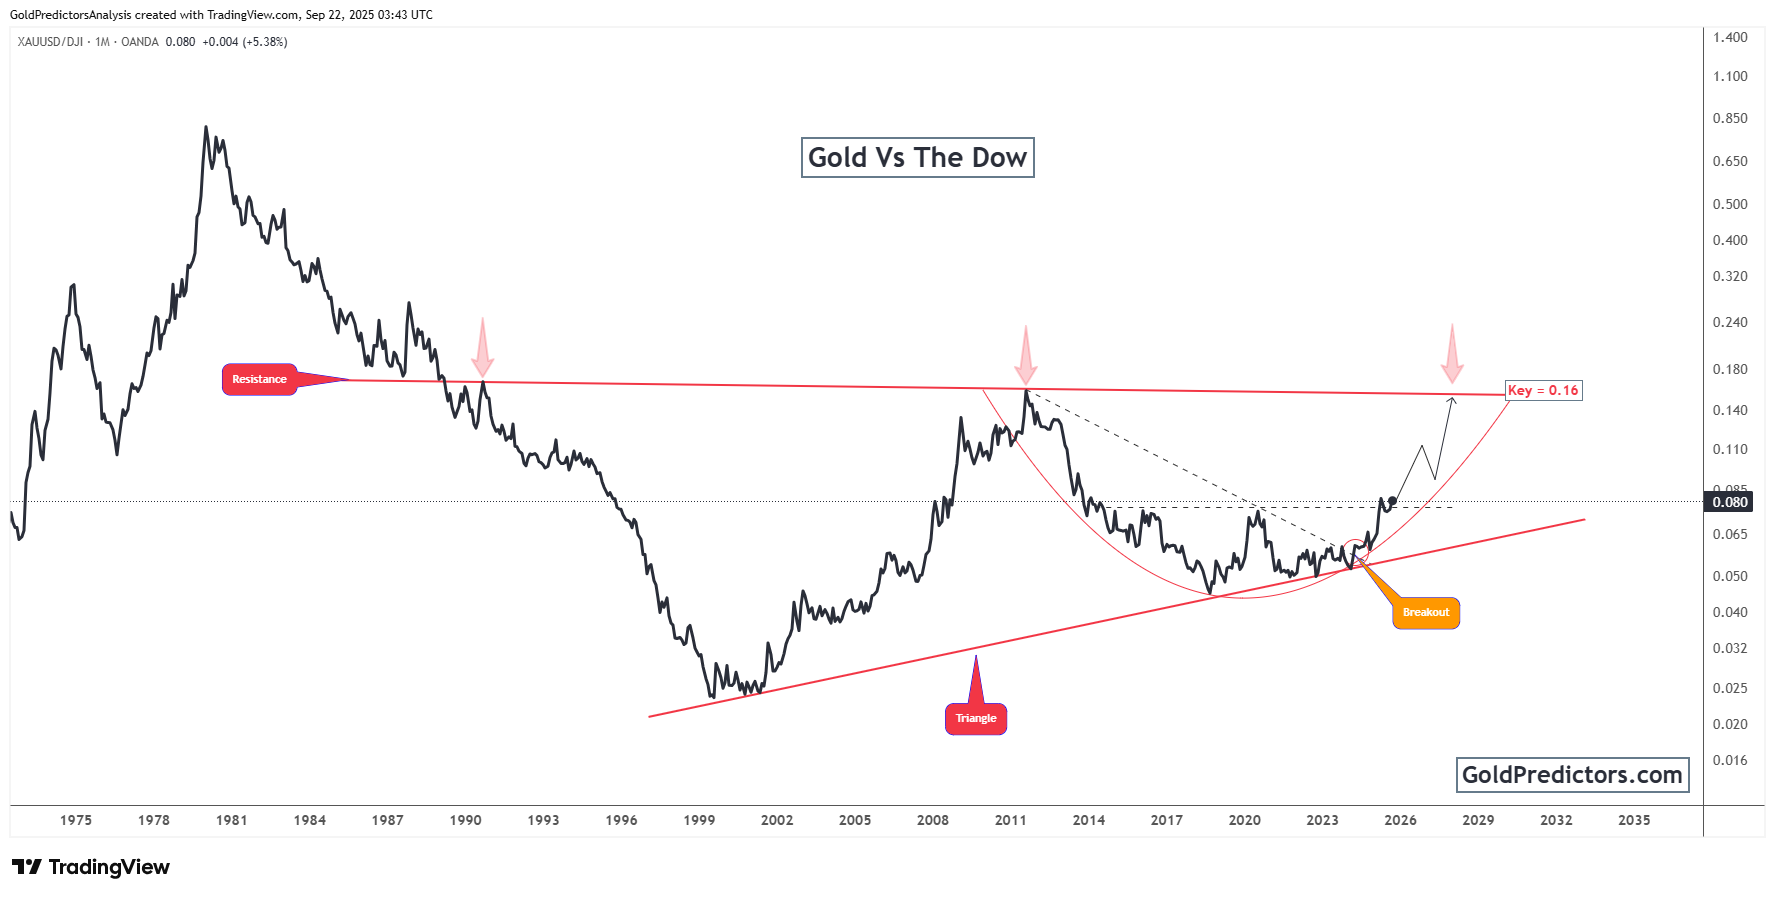
Currently, the ratio is hovering around 0.08, with a projected long-term target of approximately 0.16. Notably, this projected level aligns with major historical resistance zones observed during previous market peaks. In addition, the chart reveals a distinct curved arc, commonly referred to as a rounded base, which is a classic bottoming formation. Furthermore, the breakout above the neckline confirms a significant reversal in the long-term trend, signaling renewed strength in gold relative to equities.
Consequently, such a move offers valuable signals for investors focused on long-term trends. Moreover, gold’s strength compared to stock indices frequently reflects a broader move toward capital preservation and inflation security. These phases often emerge during periods of monetary uncertainty, weakening real yields, or broader geopolitical shifts. With gold rising in both nominal terms and on a relative basis, the current breakout gains further credibility as part of a larger secular shift.
Final Thoughts: Structural Breakout and Macro Tailwinds Support Gold’s Next Leg Higher
Gold has confirmed a decisive breakout after months of price compression. Specifically, the September 2025 move followed a well-defined four-month consolidation, supported by clear inside bar patterns. Additionally, substantial volume reinforced the breakout as price action remained consistent with the prevailing uptrend. These signals indicate a continuation of the upward trend with considerable conviction.
At the same time, gold’s long-term performance relative to the Dow shows a significant structural shift. The gold-to-Dow ratio broke through key neckline resistance, confirming a multi-decade reversal pattern. This suggests that gold is not only rising in nominal terms but also outperforming traditional equities, which is a crucial signal for long-term capital rotation.
Together, these developments confirm that gold is entering a new phase in its secular bull market. Furthermore, the structure of price movements and broader market behavior suggests growing involvement from major market participants and sustained long-term positioning. Given the persistent macroeconomic challenges, gold remains a strong investment option across various time frames.
Gold Predictors Premium Membership
Get exclusive short-term and swing trade ideas with precise entry levels, stop-loss, and target prices, including justification and analysis — all delivered directly via WhatsApp.
Our premium service includes deep technical analysis on gold and silver markets. We cover cycle analysis, price forecasting, and key timing levels.
Members also receive a weekly market letter with detailed analysis, commentary from our Chief Analyst, including actionable insights, trade timing, and direction forecasts for gold and silver.
Stay ahead of the market — join our premium community today.


