


Gold Price Breakout Accelerates as Gold-to-Silver Ratio Breaks Down
Gold (XAUUSD) has entered a powerful new phase after breaking out of a 45-year consolidation pattern. This breakout confirms the end of a decades-long range and signals the start of a long-term bull market. Momentum now favors higher prices as long-term resistance turns into solid support. At the same time, silver is gaining strength as the gold-to-silver ratio breaks down from a major channel. These moves reflect a broader rotation into real assets, driven by rising inflation, currency pressure, and growing macro uncertainty. This combination points to a renewed phase of strength for gold and silver, supported by strong macro trends.
Gold Breaks Out of Multi-Decade Triangle, Confirms Start of Long-Term Bull Market
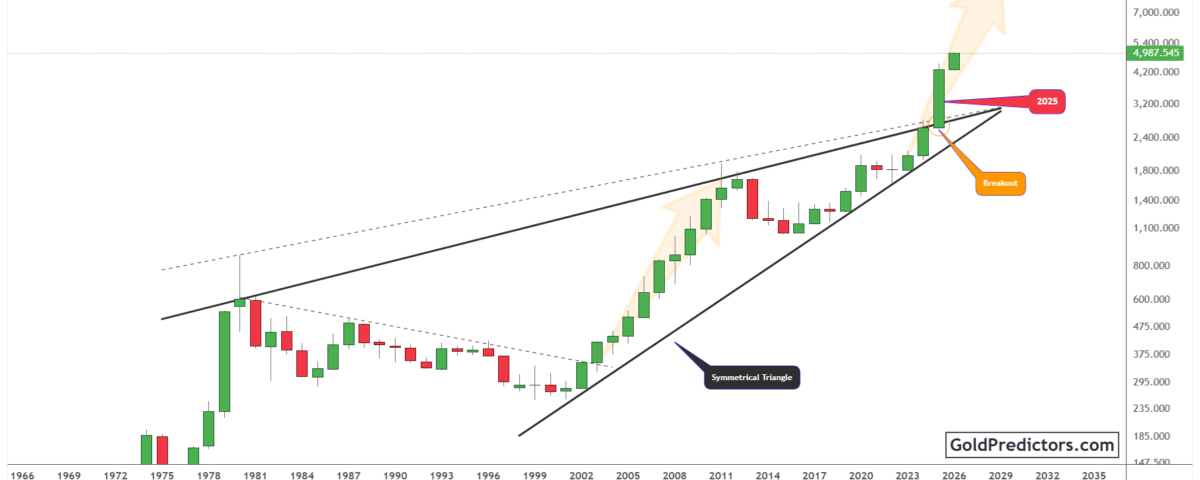
The gold chart below shows a long-term symmetrical triangle that began forming after the 1980 peak. For over four decades, gold moved within converging trendlines, forming a broad consolidation pattern. The structure reflects long-term fluctuations driven by global liquidity cycles, monetary tightening, and major economic realignments. Its extended duration and scale highlight the significance of the recent breakout.
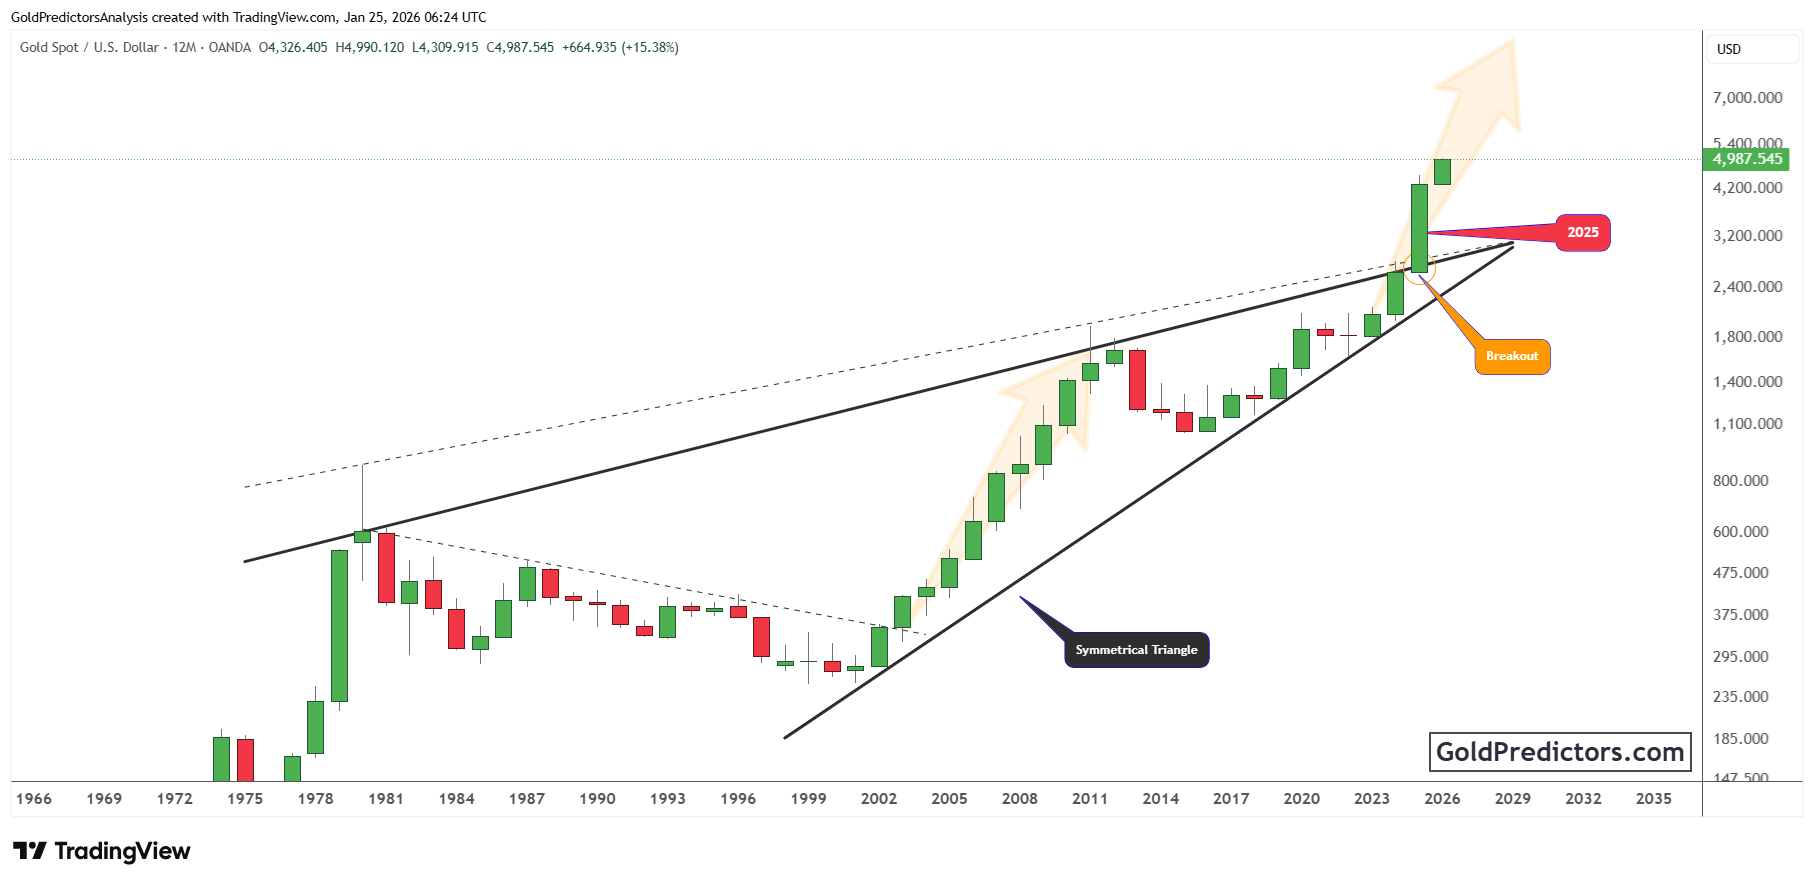
In 2025, gold broke decisively above the triangle’s upper boundary, marking the start of a powerful new bull phase. The breakout gained further credibility as gold ended the year with strong upward momentum. This move signaled the end of a multi-decade consolidation and confirmed gold’s transition into an expansionary trend. Former resistance now serves as solid support, establishing a firm base for further gains.
Technically, the breakout opens the door to substantial long-term upside. With no historical resistance above, gold may enter a steep repricing phase. The move aligns with major macro shifts, including persistent inflation pressures, broad currency weakness, and accelerating central bank gold accumulation. The chart points to a potential advance toward the $6,000–$8,000 range over the coming years.
Silver Gains Momentum as Gold-to-Silver Ratio Breaks Down from Long-Term Channel
The chart below shows a major breakdown in the gold-to-silver ratio. After rising steadily within a long-term ascending channel for over a decade, the ratio has now breached the lower boundary. This breakdown marks a decisive shift in relative strength, with silver beginning to outperform gold. Historically, sharp declines in this ratio have marked the beginning of strong silver outperformance.
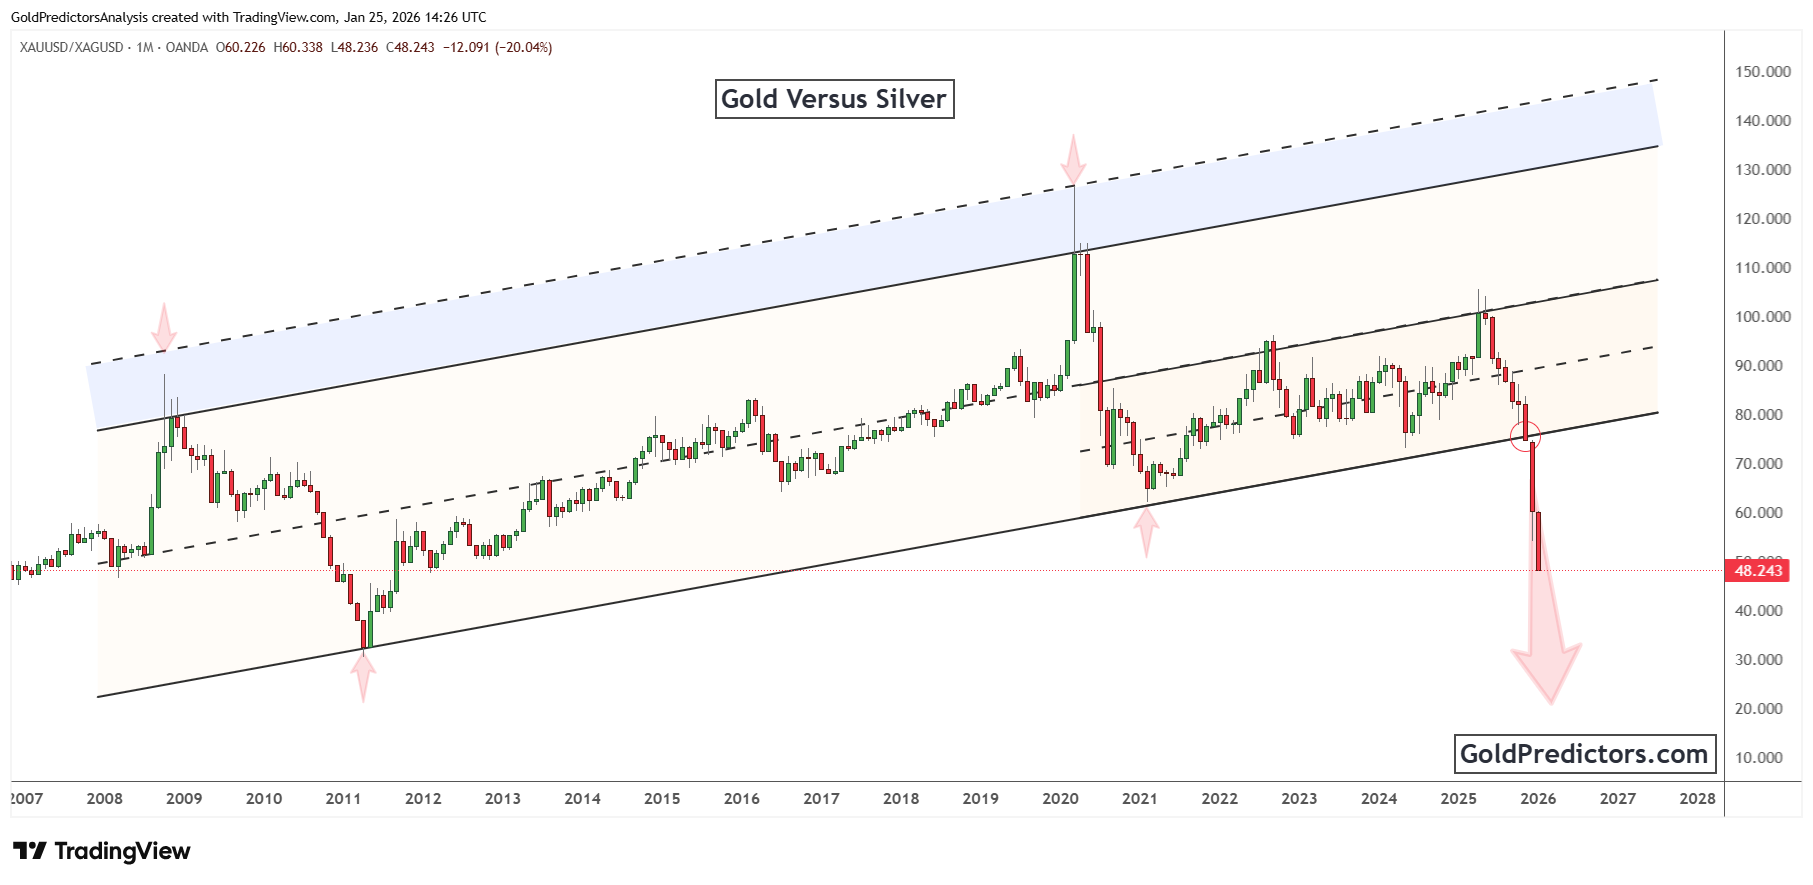
Over the years, the ratio has repeatedly failed to break above the 125 level, reversing each time from the upper boundary of its long-term channel. Meanwhile, support around the 65–70 zone held firm on multiple occasions, but that floor has now given way. The latest monthly close near 50 confirms a major technical breakdown. The sharp decline signals renewed strength in silver, driven by rising demand, tight supply conditions, and its dual role as both an industrial metal and inflation hedge.
Moreover, the ratio’s breakdown comes alongside silver’s breakout from a prolonged consolidation. As the ratio declines, it signals growing momentum in silver relative to gold. While silver stands to benefit from this rotation, the trend may also pressure gold’s relative performance in the short term. However, both metals could still rise together if global liquidity expands or if inflation expectations continue to climb. The combination of a structural breakdown in the ratio and aligned macro drivers sets the stage for silver to outperform while maintaining a favorable environment for gold.
Conclusion: Breakouts and Ratio Reversal Set Stage for Strong Bull Phase in Metals
Gold has confirmed a powerful breakout from a 45-year triangle, signaling the start of a new long-term bull phase. The move reflects rising demand for hard assets in an environment shaped by inflation, currency stress, and growing macro instability. With former resistance now acting as support, gold appears well-positioned to advance toward higher long-term targets.
At the same time, the gold-to-silver ratio has broken down from a long-standing channel. This shift highlights growing momentum in silver relative to gold and signals a broader rotation within the precious metals space. The sharp move points to silver’s potential to lead the next leg of the bull market, supported by strong industrial demand and tight supply. This evolving dynamic strengthens the bullish outlook for silver and marks the beginning of a new phase of relative outperformance.
These developments mark a decisive turning point in the precious metals cycle. Structural breakouts in both gold and silver suggest that capital is moving steadily into real assets. The shift in relative strength between the two metals adds further confirmation of this transition. With macro catalysts aligned and technical barriers cleared, the precious metals complex appears poised for accelerated gains in the years ahead.
Gold Predictors Premium Membership
Get exclusive short-term and swing trade ideas with precise entry levels, stop-loss, and target prices, including justification and analysis — all delivered directly via WhatsApp.
Our premium service includes deep technical analysis on gold and silver markets. We cover cycle analysis, price forecasting, and key timing levels.
Members also receive a weekly market letter with detailed analysis, commentary from our Chief Analyst, including actionable insights, trade timing, and direction forecasts for gold and silver.
Stay ahead of the market — join our premium community today.


