Gold Hits Initial Target of 1835 from 1750, What's Next? | Gold Predictors - Forecasting Gold Prices

New York

London

Sydney

Tokyo

Log In

  • Register
  • Lost your password?
gold predictorsgold predictorsgold predictorsgold predictors
  • HOME
  • ABOUT US
    • About Us
    • Social Networks
    • Industry Links
    • Testimonials
  • RESEARCH
    • Scientific Trade Strategies
    • Gold Hub
    • Gold Importance
    • Silver Importance
  • GOLD HUB
  • GOLD ANALYSIS
    • Gold Analysis
    • Technical Analysis
      • Trend Identification
      • Phase Identification
      • Important Levels
      • Volatility Measurement
    • Gold Cycle
      • Short Term Cycles
      • Medium Term Cycles
      • Long Term Cycles
    • Price Action Analysis
      • Phase Identification
      • Historical Pattern Identification
      • Candlestick Pattern Identification
    • Fundamental Analysis of Gold
    • Gold Related Markets Analysis
    • Gold Seasonal
  • TRADING METHODOLOGY
    • Gold Analysis
      • Technical Analysis
      • Gold Cycle
      • Price Action Strategy
      • Fundamental Analysis
      • Gold Related Markets Analysis
      • Gold Seasonal
    • Measure Signal Strength
      • Weak Signal
      • Strong Signal
      • Confirmed Signal
    • Trading Decision
    • Trading Rules
      • Basic Trading Rules
      • Gold Predictors Trading Rules
    • Trade Examples
    • Performance
  • LIVE CHARTS
  • MEMBERSHIPS
    • Free Membership
    • Premium Membership
    • SignUp
  • MEMBERS AREA
    • Free Article
    • Premium Article
    • Trading Signals
    • Long Term Signals
    • Forex Reports
    • Crypto Reports
  • FOREX REPORTS
  • HELP
    • FAQ
    • Contact Us
Login / Register

Gold Hits Initial Target of 1835 from 1750, What’s Next?

0
Published by admin at July 20, 2021
Categories
  • Premium Articles
Tags

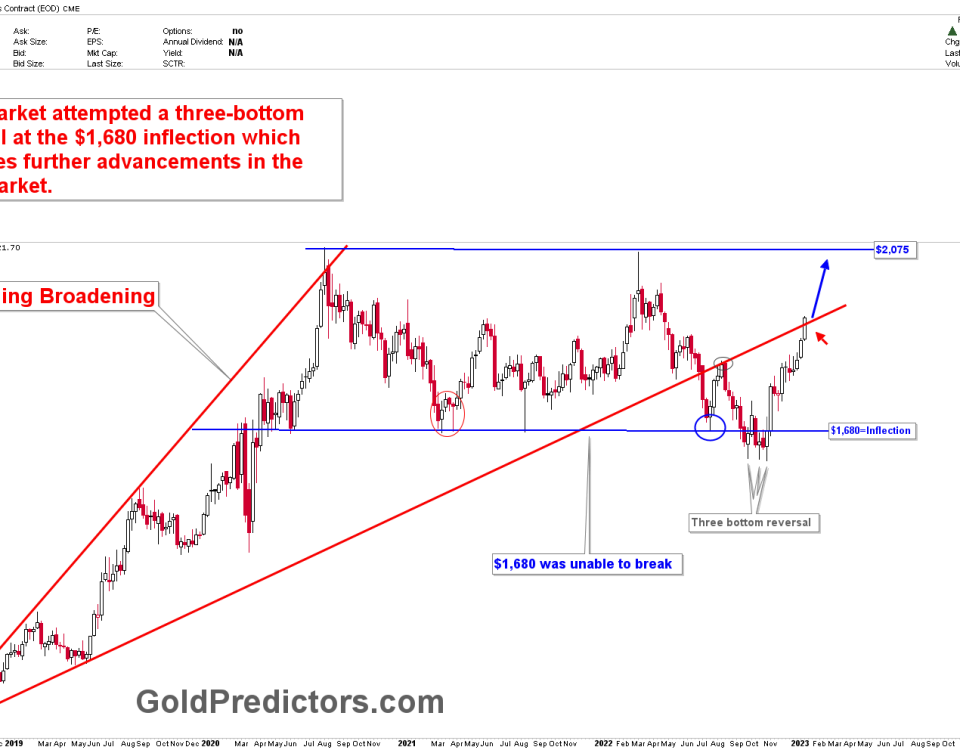
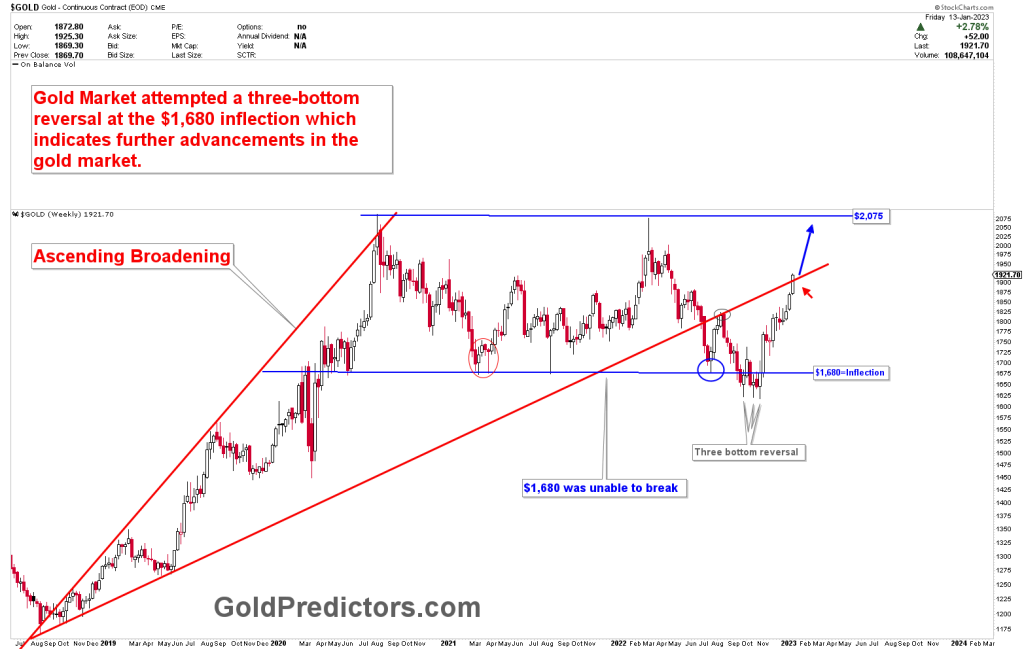
We discussed the strong resistance of 1825-1835 with an absolute number in the 1830 region last week. The support was mentioned as 1792. In spot gold, the week’s low was 1791.45 and the high was 1834.20. As the strong resistance was hit, gold prices were toying with the above-mentioned figures. The first arrow pointing from the 1765-1750 support was hit in 1835. This arrow has completed its journey, and the next gold path will be determined after the transition week. The transition week is the one when prices come to a halt for a few days. The next move in precious metals is determined by the development of short and medium-term historical patterns. However, the correlated markets also play a role in anticipating the next move.

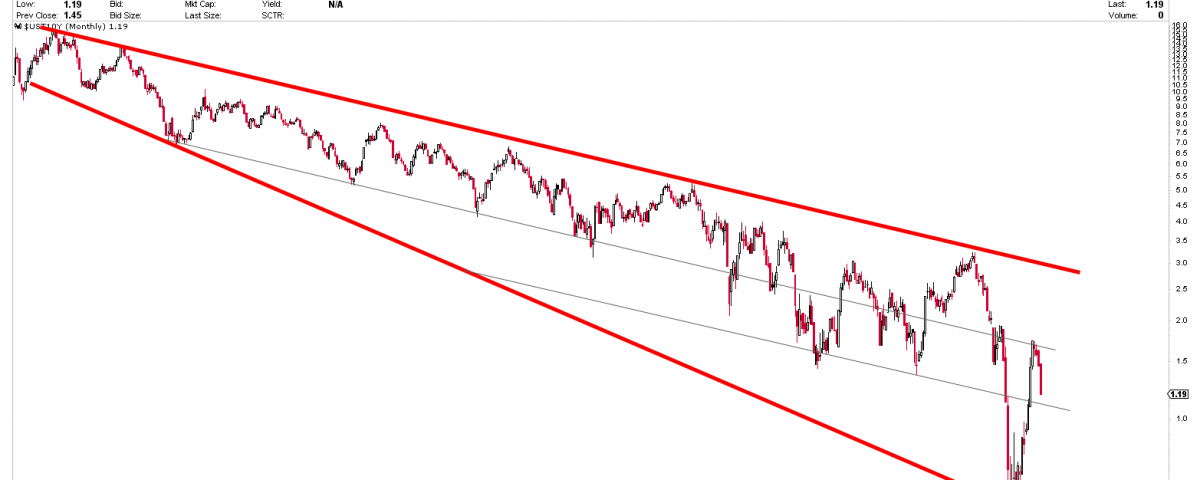
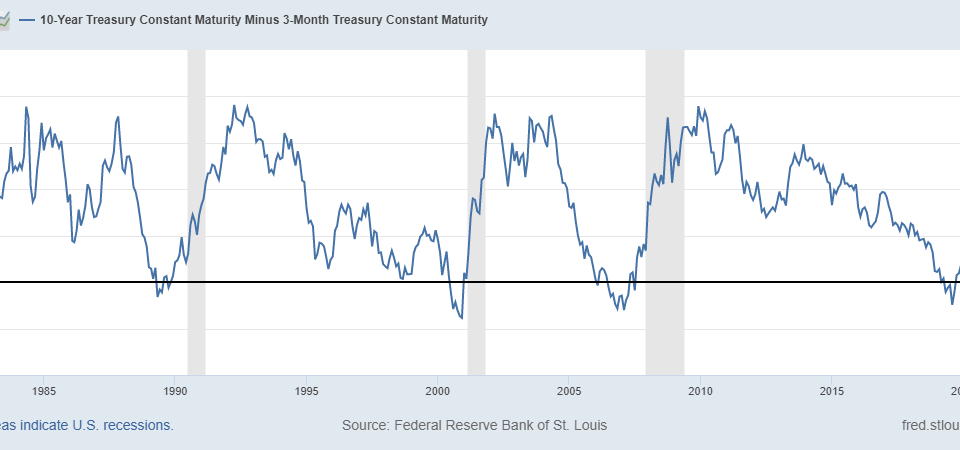
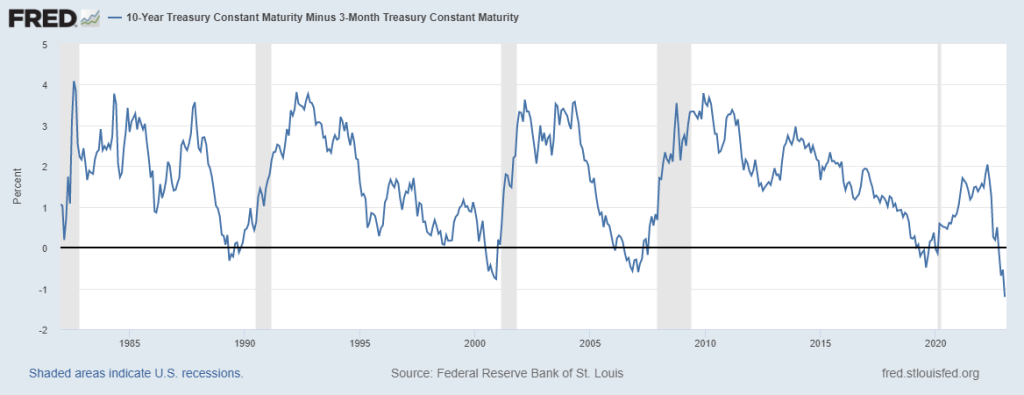
Treasury yields, as discussed in the long-term trends in 10-year Treasury yields, are pointing lower. According to the most recent newsletter, the USD index is attacking the resistance line. The USD attacks and the bond markets implies a short-term risk in the major forex and commodities markets. In today’s report, we’ll discuss the Treasury yield, the impact of the US dollar on gold, and the transition week, as well as how to use it in trading.

To receive free updates, please register as free member.

Free Membership

This content is locked

Login To Unlock The Content!

Username:
Password:

Related posts

January 29, 2023

Premium Updates Are Mostly Delivered Using Emails


Read more
recession
January 28, 2023

Gold – A Recession Warning


Read more
gold ascending broadening
January 15, 2023

Gold: Bullish Short-Term Structure


Read more

Comments are closed.

ABOUT US

  • About Us
  • Social Networks
  • Industry Links
  • Testimonials
  • Terms & Conditions

TECHNICAL ANALYSIS

  • Technical Analysis
  • Trend Identification
  • Phase Identification
  • Important Levels
  • Volatility Measurement

CYCLE ANALYSIS

  • Gold Cycle
  • Short Term Cycles
  • Medium Term Cycles
  • Long Term Cycles

PRICE ACTION ANALYSIS

  • Price Action Analysis
  • Phase Identification
  • Historical Pattern Identification
  • Candlestick Pattern Identification
© 2017 Gold Predictors. All Rights Reserved.
  • Remember Me
    Lost your password?
    Dont have an account?Sign Up