


Gold Hits $3,500 High – Can the Rally Continue or Is a Correction Coming?
Gold prices have surged over the past year, breaking multiple key resistance levels and reaching new all-time highs in April 2025. This strong rally has drawn investor attention, with many watching for signs of continued momentum or a possible shift in direction. As prices increase, bullish signals and cautionary patterns are emerging. This article discusses the recent gold price movements after the price correction from the record level of $3,500 by reviewing key technical patterns and formations. The article highlights bullish indicators and potential reversal signals that may influence short-term market trends.
Gold Price Rally Backed by Bullish Chart Patterns Since 2018
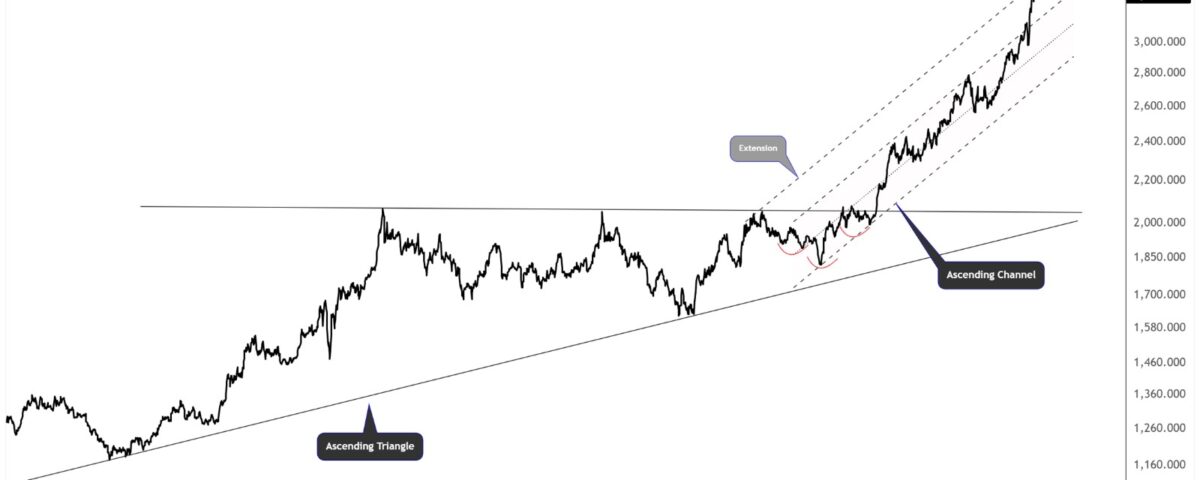
The daily chart for gold shows that the metal has formed several bullish technical structures since 2018, laying the foundation for its recent rally. The first major pattern visible on the long-term chart is an Ascending Triangle, which began forming in 2018 and broke out in 2023. This breakout marked the end of a consolidation phase and the beginning of a powerful upward move.
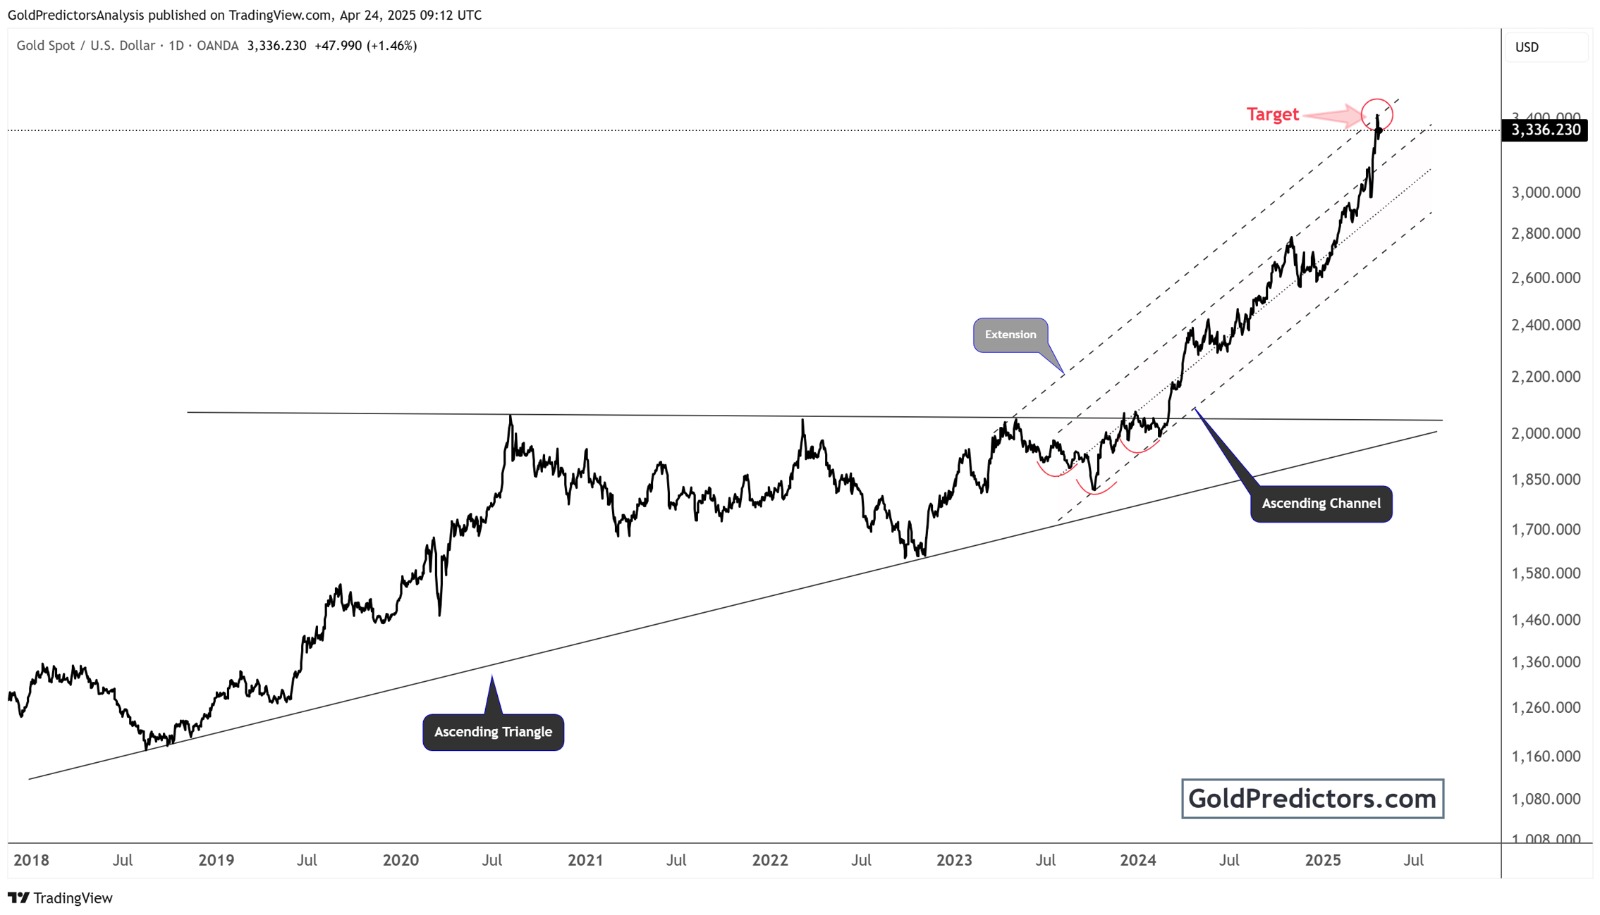
After the breakout from the ascending triangle, gold prices entered an Ascending Channel. This channel clearly outlines a structured upward path, guiding the price with support and resistance levels. As prices continue to increase, an Extension Pattern emerged, pushing the price above the regular trend lines and creating a parabolic move. The extension helped gold target and hit the upper levels of the technical projection, resulting in the record high of $3,500.
This rally was also supported by a Cup and Handle formation in 2023, a classic bullish continuation pattern that further validated the strength of the upward trend. The target set by this structure has now been achieved, indicating that the technical price projection has been met.
Bearish Wedge and Resistance at $3,500 Signal Short-Term Correction
The daily chart below shows that the gold price action in 2024 and 2025 reveals the formation of an Ascending Broadening Wedge. This is a bearish pattern that typically forms in the later stages of an uptrend and signals potential volatility and exhaustion.
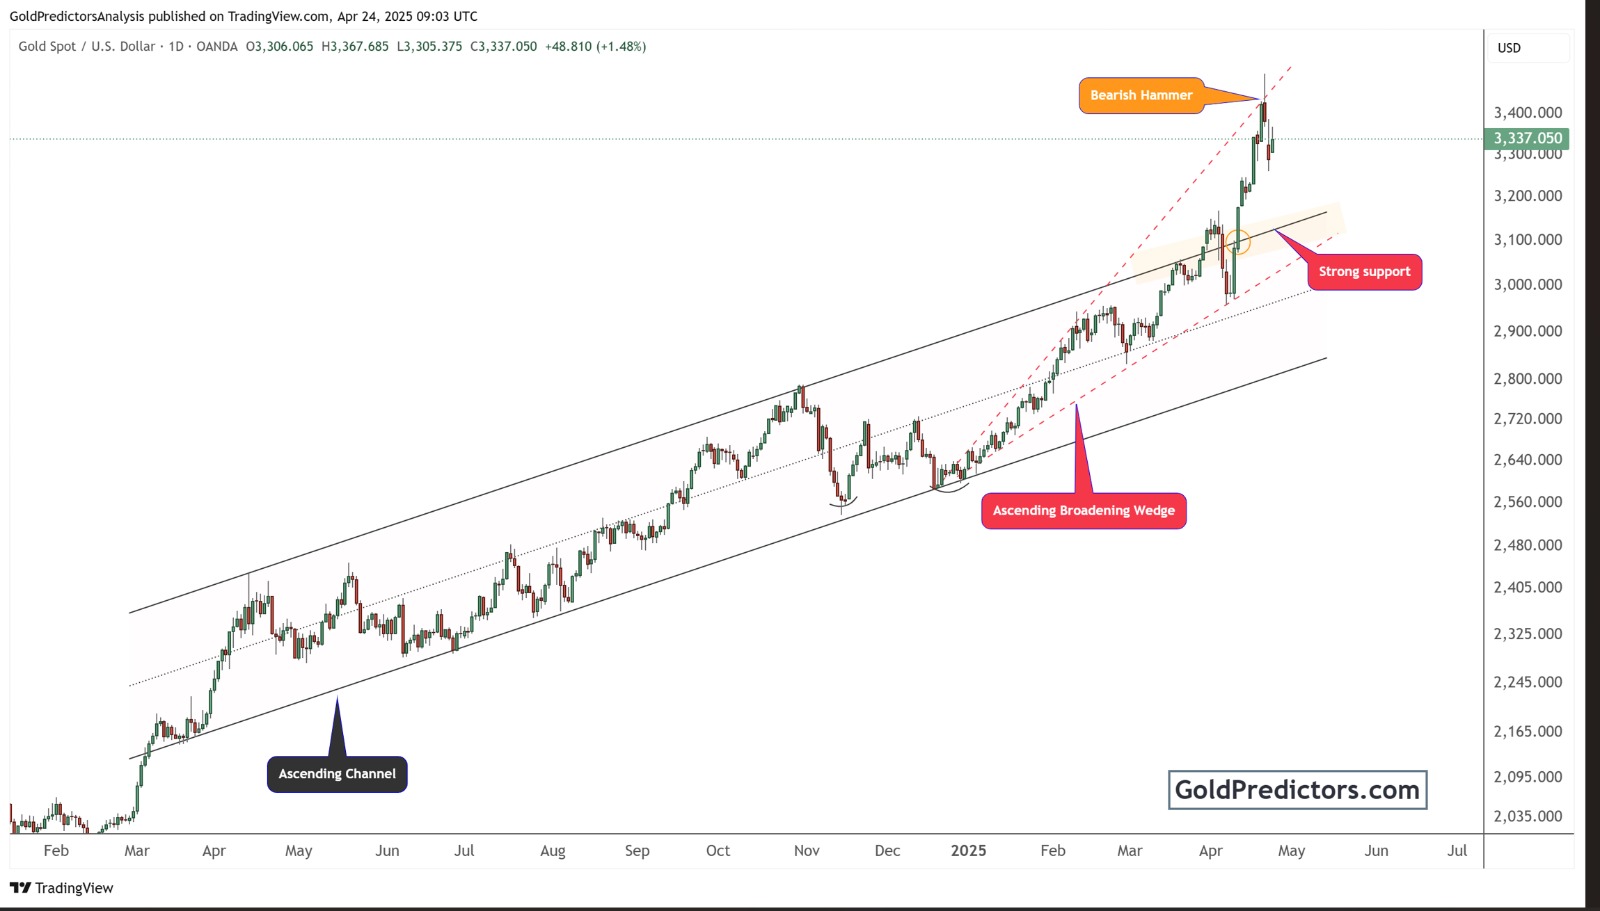
Moreover, a prominent Bearish Hammer candlestick appeared at the long-term resistance of $3,500. This pattern often signals a potential reversal when found at the top of an uptrend. The long wick indicates that sellers quickly pushed the price down, stopping it from going higher and possibly starting a short-term drop.
However, the ongoing global uncertainty after President Trump’s new tariffs is impacting the safe-haven demand for gold. The chart highlights a strong support zone within the $3,100-$3200. This zone aligns with previous consolidation and may provide a safety net for any short-term retracements. If prices fall back into the original ascending channel, they might find stability before attempting a new leg higher.
The price has also respected the boundaries of its broader Ascending Channel, which began forming in early 2024. Unless this channel breaks decisively to the downside, the long-term trend technically remains bullish.
Conclusion: Can Gold Resume the Uptrend?
Gold continues to show strong momentum in April 2025. Multiple bullish patterns support the rally, including the Ascending Triangle, Ascending Channel, and Cup and Handle. These structures have played a major role in pushing gold to new highs.
At the same time, warning signs are starting to appear. The Ascending Broadening Wedge and Bearish Hammer suggest possible short-term weakness. These signals indicate that traders should stay cautious as the market may face increased volatility. However, a break above $3,500 would open the door for $4,000.
Despite these risks, the long-term outlook remains positive as long as gold holds above the key support zone near $3,100. If prices stay within the broader ascending channel, the uptrend could continue. The recent economic uncertainties due to the tariff war suggest that the recent correction in the gold market could be a good buying opportunity.
Gold Predictors Premium Membership
Get exclusive short-term and swing trade ideas with precise entry levels, stop-loss, and target prices, including justification and analysis — all delivered directly via WhatsApp.
Our premium service includes deep technical analysis on gold and silver markets. We cover cycle analysis, price forecasting, and key timing levels.
Members also receive a weekly market letter with detailed analysis, commentary from our Chief Analyst, including actionable insights, trade timing, and direction forecasts for gold and silver.
Stay ahead of the market — join our premium community today.


