


Gold Extends Rally above Long-Term Resistance as Platinum-to-Gold Ratio Signals Divergence
Gold (XAUUSD) is gaining renewed momentum after breaking out from a long-term rounded base formation. After years of compression and sideways movement, the breakout confirms a structural shift as the price cleared major resistance and opened the way for further upside. While a brief pullback emerged after the initial surge, the broader setup remains strong. At the same time, the platinum-to-gold ratio continues to trade within a persistent downtrend, highlighting gold’s sustained leadership within the precious metals complex. These developments reflect a strong technical and macroeconomic backdrop that favors further outperformance in gold.
Gold Confirms Structural Breakout from Multi-Year Rounded Base
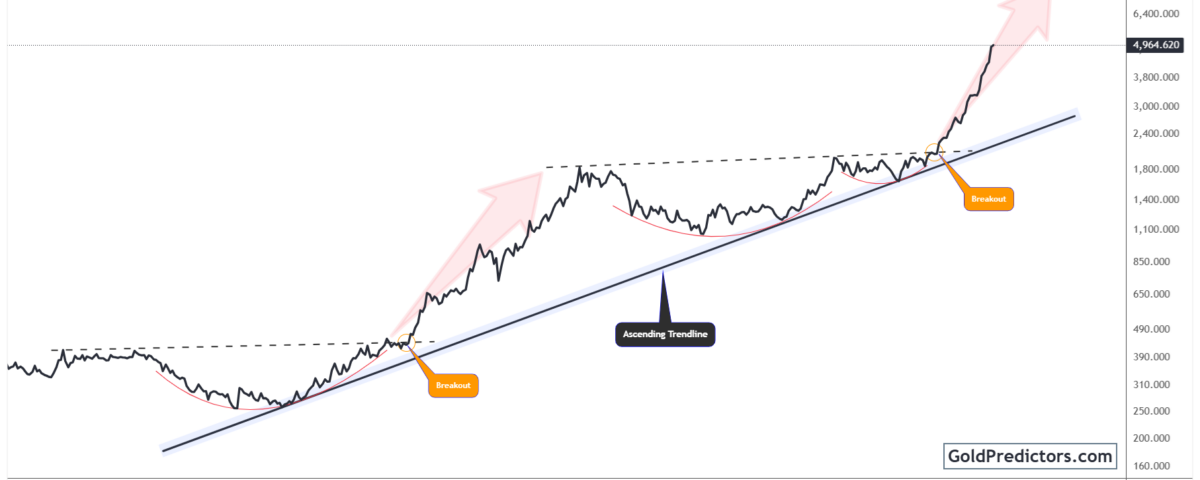
The gold chart below shows a clear long-term structure marked by distinct phases of consolidation and breakout. After forming a rounded bottom during a prolonged base-building period between 1996 and 2005, gold initiated a powerful rally that lifted the price toward the $2,070 region. That move eventually stalled, leading to another extended consolidation. Between 2011 and 2024, gold carved out a strong base, repeatedly challenging horizontal resistance before finally breaking higher.
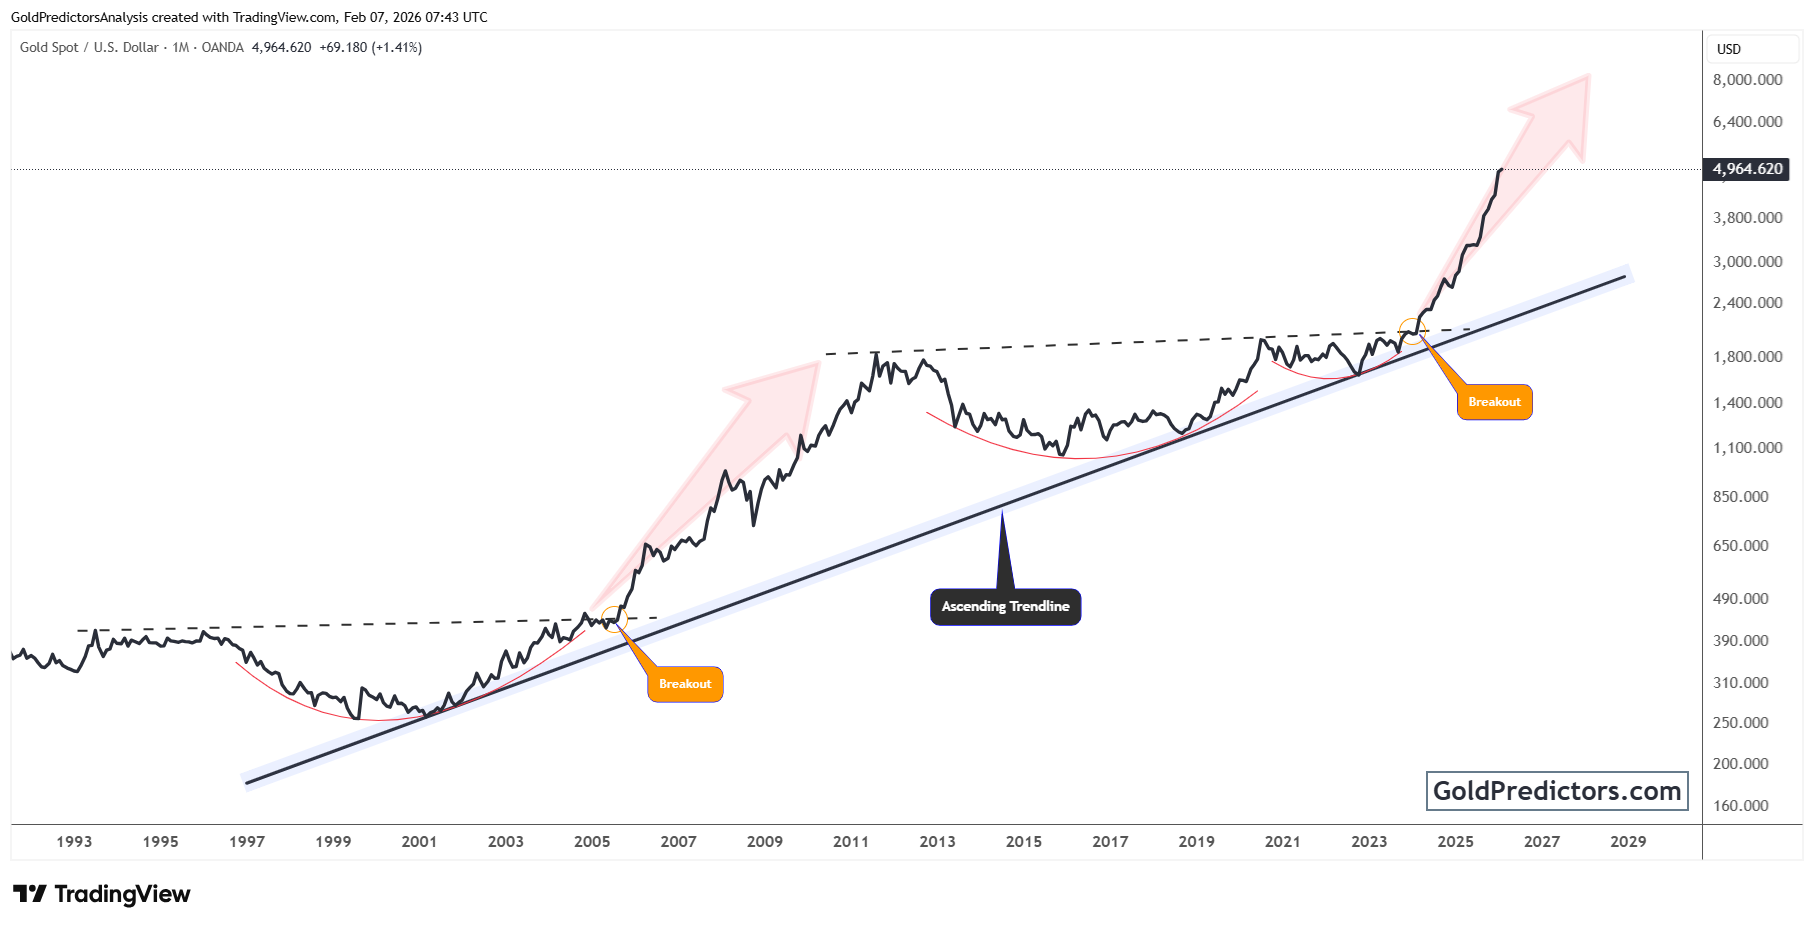
A decisive breakout occurred in 2024, initiating a strong rally that carried gold toward the $5,000 level. This move reflects a pattern similar to the breakout that unfolded in 2005, which also led to a sustained rally. Current price action suggests gold may be entering a renewed phase of strong upward momentum. While price has recently retreated, the broader structure remains intact and continues to support a constructive long-term outlook.
Gold’s latest breakout is supported by a powerful combination of macro and technical factors. Geopolitical tensions, robust central bank gold demand, and growing expectations for Fed rate cuts continue to drive interest in hard assets. Capital is shifting away from fiat-denominated assets and flowing into real stores of value, strengthening gold’s role as a monetary hedge. These fundamental forces complement the technical breakout, creating a strong base for continued upside.
Gold Continues to Outperform as Platinum Lags Below Key Resistance
The chart below shows the platinum-to-gold ratio trading within a steady downtrend, confined by a descending channel that began in 2008. After reaching a major peak in 2008, the ratio entered a prolonged decline, consistently respecting the boundaries of the descending channel. Each bounce failed to generate lasting momentum, highlighting platinum’s persistent underperformance relative to gold over the past decade.
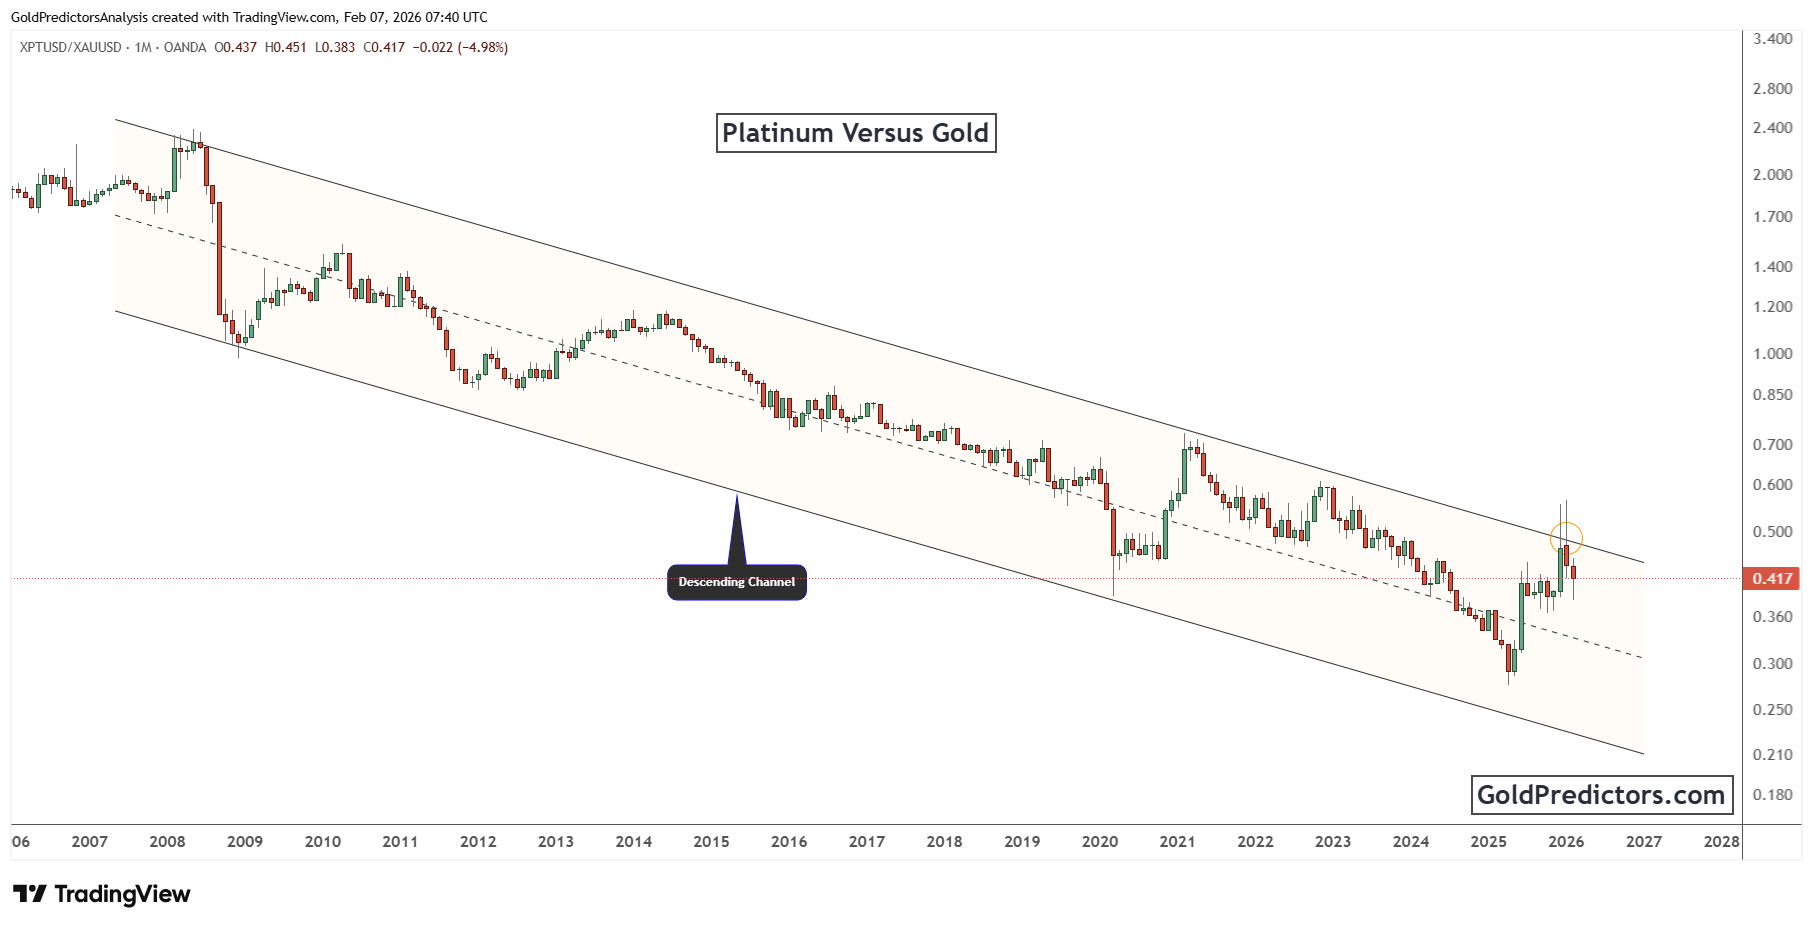
In 2025, the ratio rebounded from the channel’s lower boundary and advanced sharply toward the upper resistance line, marking a key shift in relative strength. This sharp recovery suggested a potential shift in relative strength, possibly driven by expectations of industrial metal outperformance or tightening platinum supply. However, the rally lost steam at the top of the channel, where resistance held firm and halted further upside.
Currently, the platinum-to-gold ratio has pulled back to around 0.417 after failing to break above the descending channel. This rejection highlights continued relative strength in gold. The downtrend will persist unless the ratio establishes a decisive breakout above resistance. The channel’s midpoint now serves as a potential support zone in the near term.
Conclusion: Gold Sustains Structural Strength While Platinum Remains in Downtrend
Gold has entered a strong bullish phase after breaking out from long-term resistance. The move above this key level was confirmed by a well-defined rounded base and a steady ascending trendline, both of which validate the structural strength of the breakout. This setup resembles the mid-2000s advance, where a similar pattern preceded a multi-year rally. With price now holding above previous resistance, the pattern suggests further upside potential if macro conditions remain favorable.
Meanwhile, the platinum to gold ratio briefly bounced off the lower boundary in 2025, it failed to clear key resistance, highlighting continued gold outperformance. Unless platinum breaks above the upper channel, the broader setup continues to favor gold from both a fundamental and technical perspective.
These developments highlight a growing divergence within the precious metals complex. Gold has firmly established long-term leadership, supported by structural breakout patterns and macro demand for monetary assets. Meanwhile, platinum remains technically capped and lacks the momentum to reclaim relative strength. As capital rotates toward assets offering stability and structural strength, gold maintains its leadership in the current repricing cycle.
Gold Predictors Premium Membership
Get exclusive short-term and swing trade ideas with precise entry levels, stop-loss, and target prices, including justification and analysis — all delivered directly via WhatsApp.
Our premium service includes deep technical analysis on gold and silver markets. We cover cycle analysis, price forecasting, and key timing levels.
Members also receive a weekly market letter with detailed analysis, commentary from our Chief Analyst, including actionable insights, trade timing, and direction forecasts for gold and silver.
Stay ahead of the market — join our premium community today.


