


Gold Compression at Key Inflection Points
Gold is approaching at Key Inflection point by producing some compression. We will evaluate the next direction of gold by studying the market dynamics.
Understanding the Key Inflection Points
Let’s start with the basics to understand the key inflection points in gold.
What exactly is an inflection point?
An inflection point is a significant occurrence that alters the course of a process or situation in the economy or civilization. Inflection points are more significant than the small incremental progress that most people make on a daily basis, and the effects of the change are frequently well-known and widespread.
Please see our articles on the 30th of November 2020 and the 13th of January 2021 for more information on the gold and silver pullback expectations. The links of these articles are mentioned as below.
From evaluation of the above articles, it is clear that we were only looking for two numbers in gold during this pullback. One was in the 1765 region, while the other was in the 1710 region. We got a nice bounce from the 1765 region, but prices couldn’t break through the 1931 inflection on a weekly or monthly basis, so all time new highs were paused. That number, however, remains the tipping point for higher gold prices.
When gold prices fell this year, the duration of the drop was extended, implying that gold will produce a CUP handle that is much deeper on monthly charts. The depth of that candle starts at 1650-1680. Our expected number 1710 appeared with some deviations this march, after prices missed the opportunity of the 1710 region last year. This level of 1710 was broken down into the following categories, based on recent developments . The first support number was in 1725, the second in 1687, the third in 1675, and the fourth in 1650 (not confirmed yet). Let’s leave this topic here and we will continue it at the end of this article after discussing some charts. To begin, recognize the inflection points in gold using charts.
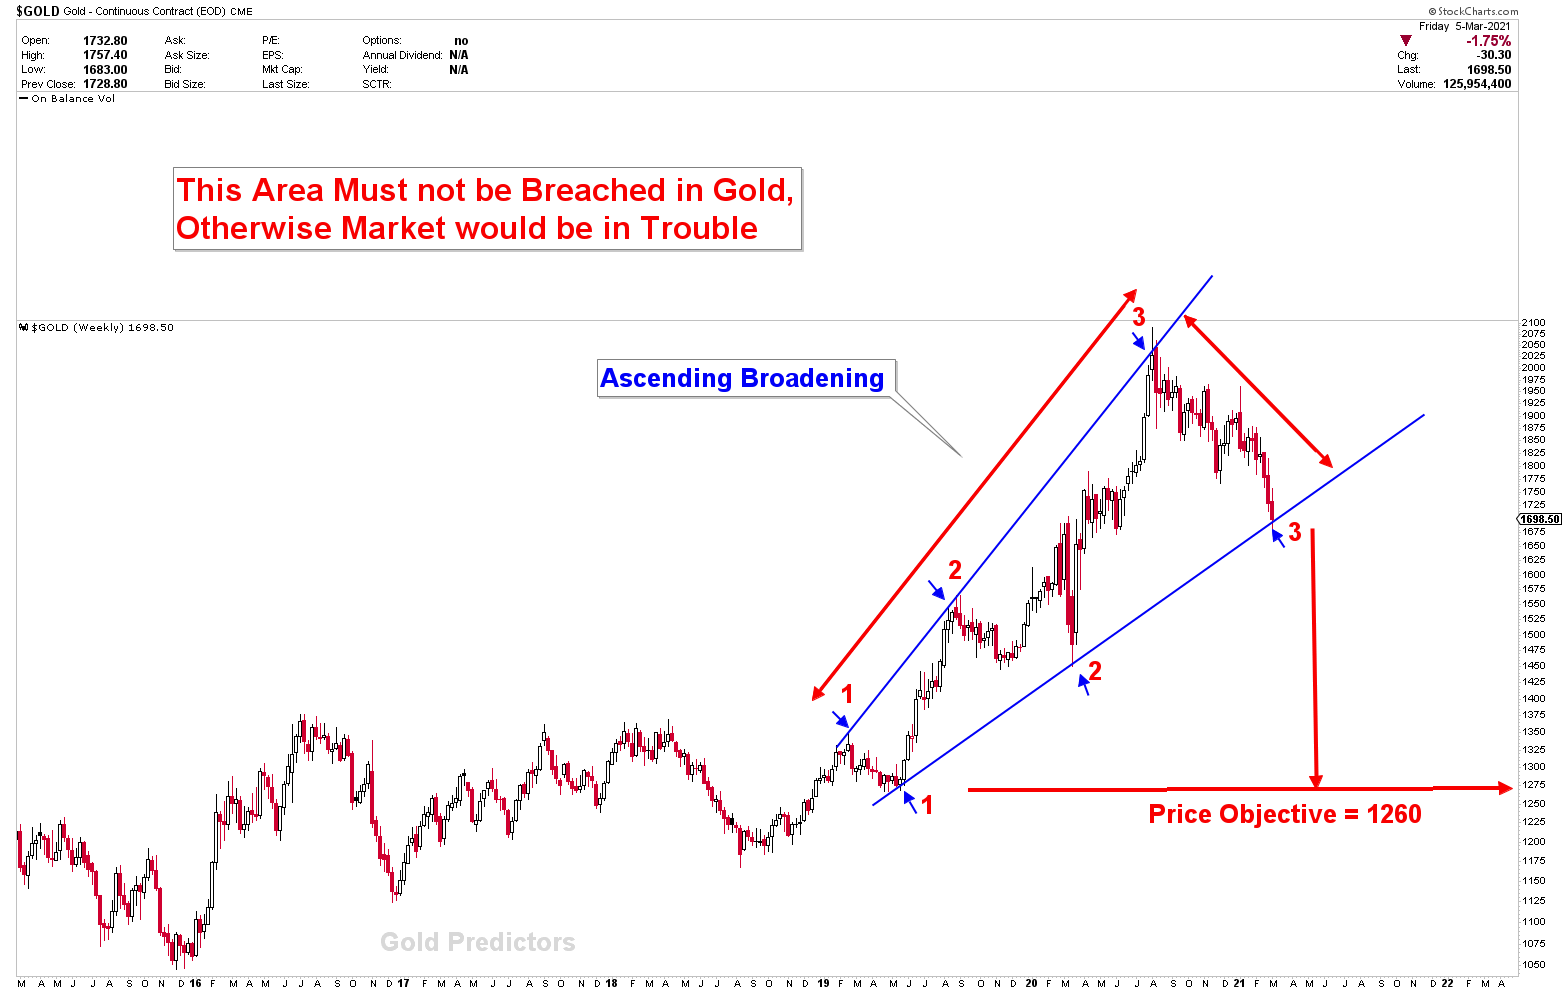
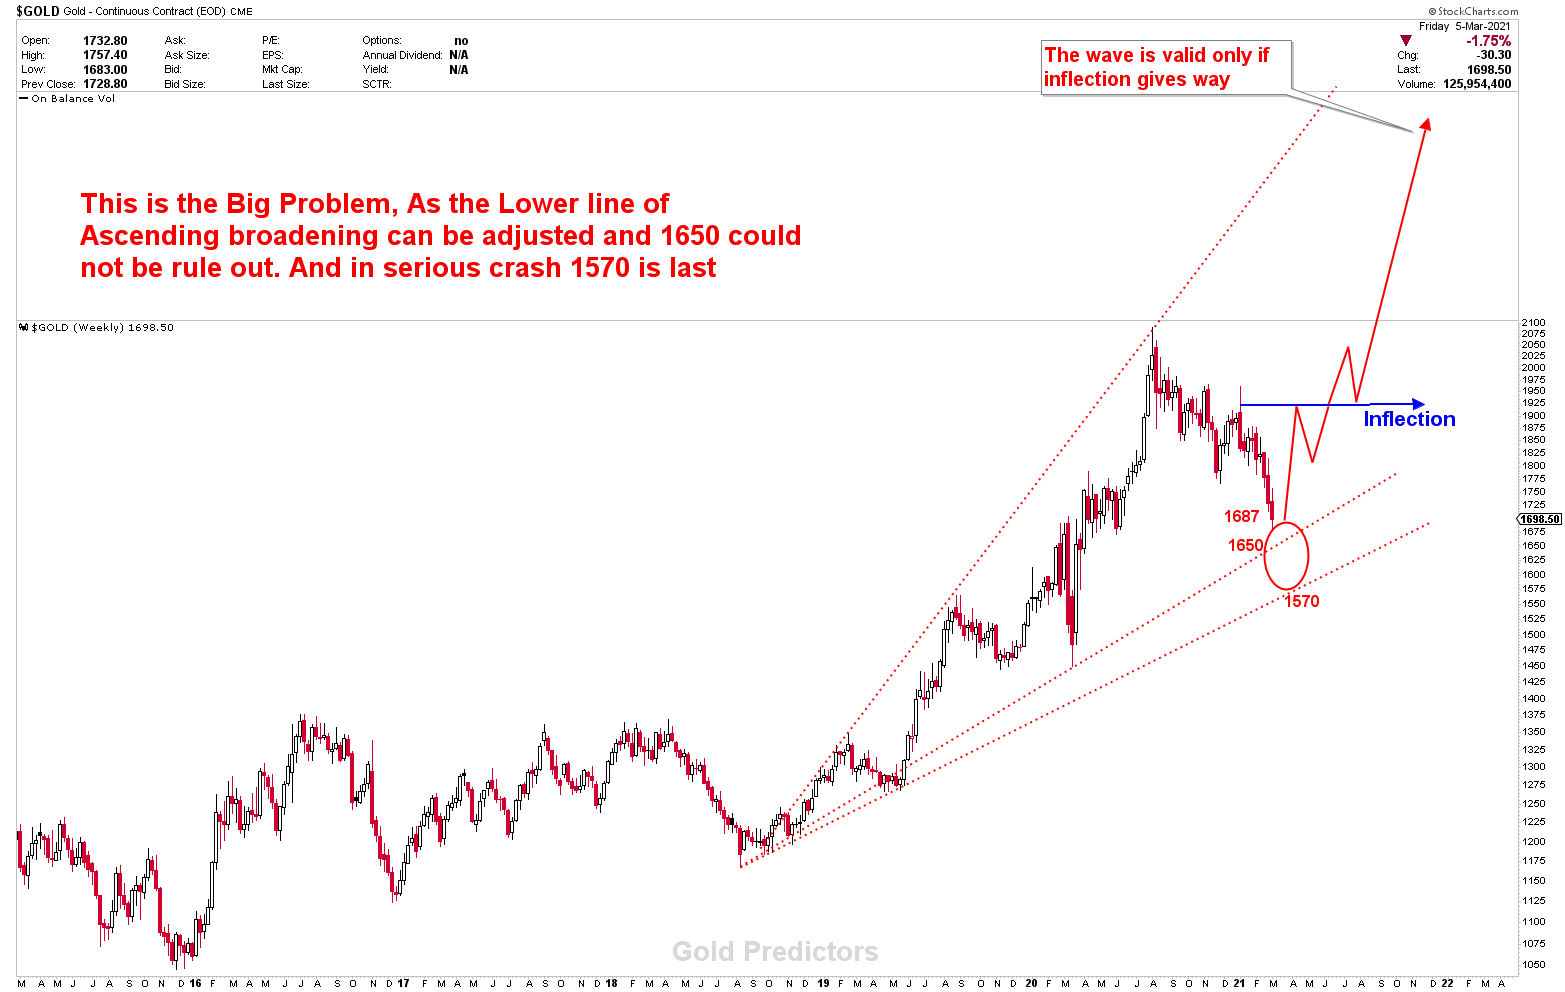
This weekly chart of the gold continuous contract clearly shows how gold closed above the lower blue trend line last Friday, which we have been discussing since September 2020 and is known as Ascending broadening. At the moment, the price reaction to this line is negligible. Last Friday, gold smashed through the line and reversed, closing back above it, but reversal was very weak. This is the third time this line has been touched, and gold does not want to close below this level in any case, as a drop below this level would scare the globe.
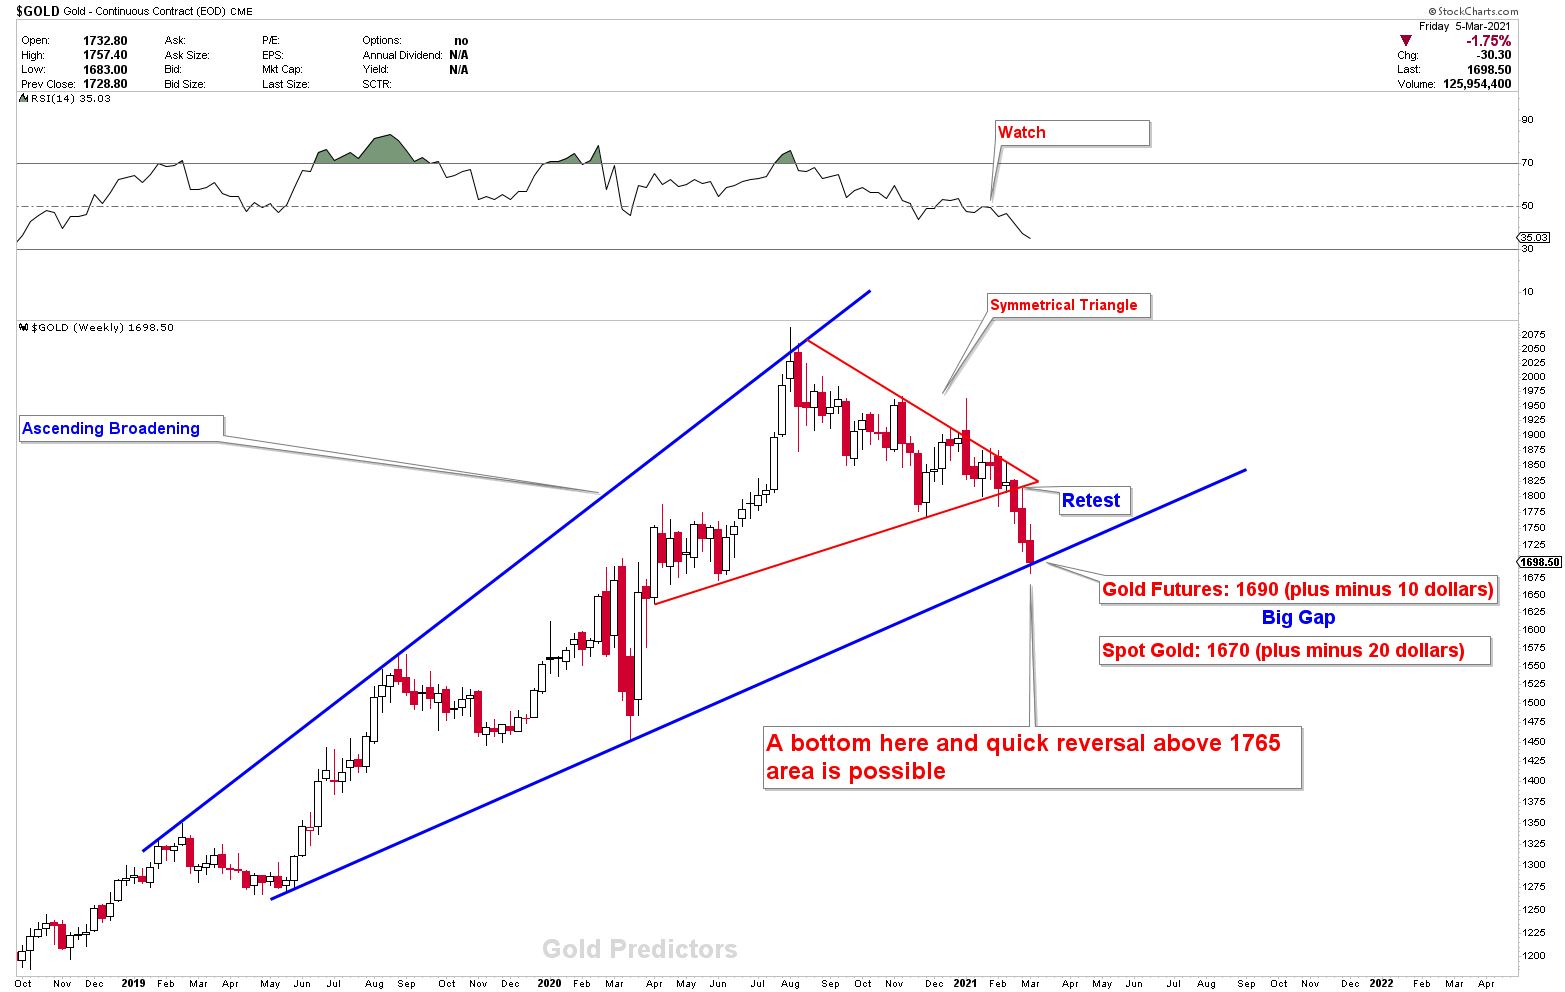
Let’s magnify this chart and examine it more closely. There was no reaction when gold touched the line, and the pressure was still on. The commodities are still being pushed down the earth by dollar strength. This line was touched last week on the Gold continous contracts chart, but it was touched again on Monday on the Spot gold chart at 1675-80, with some significant deviations.
After this pullback, our primary target is depicted in the chart below. However, in order for that to remain active, this is the final area to keep an eye on for gold. If the inflection point is breached, gold will accelerate much lower, causing everyone’s expectations to be shattered. If the inflection of 1931 is breached, the target of 2300-2500 remains valid. All of these figures will be discussed once current levels are confirmed with some reactions.
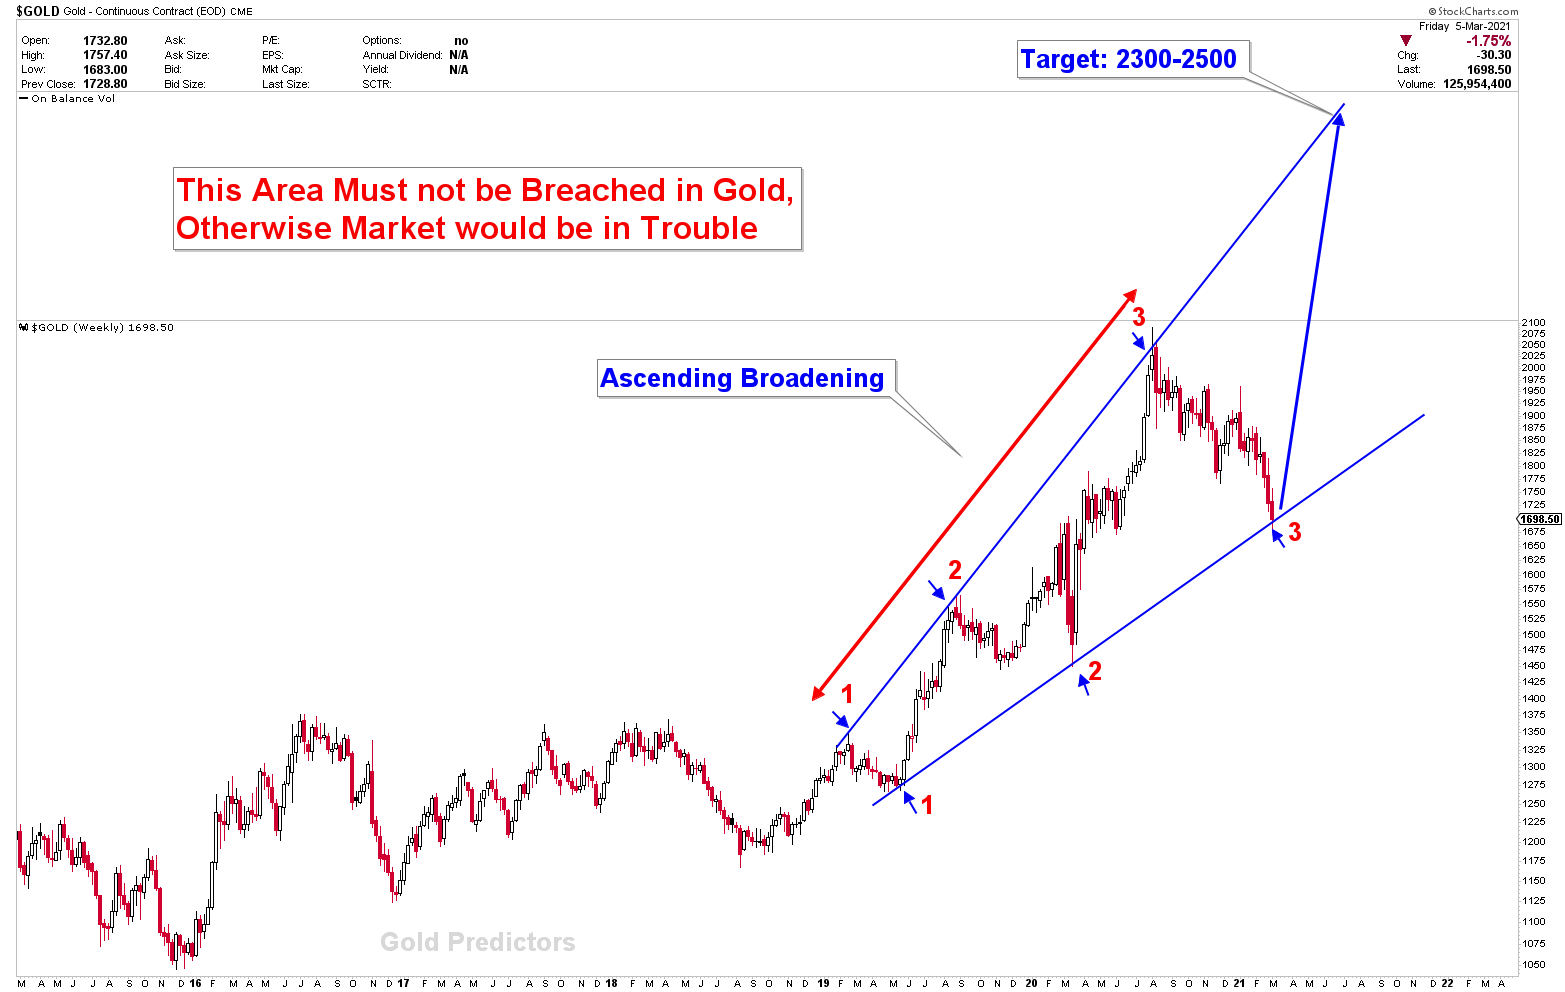
Don’t Forget ASCENDING BROADENING are bearish chart patterns with 80% of probability, But we expect higher prices first before a big correction.
Another chart from the previous article shows that gold has some extended support because, if ascending broadening is considered from the bottom of the current 8-year cycle lows, gold’s price can easily flush out to the 1650-60 region.
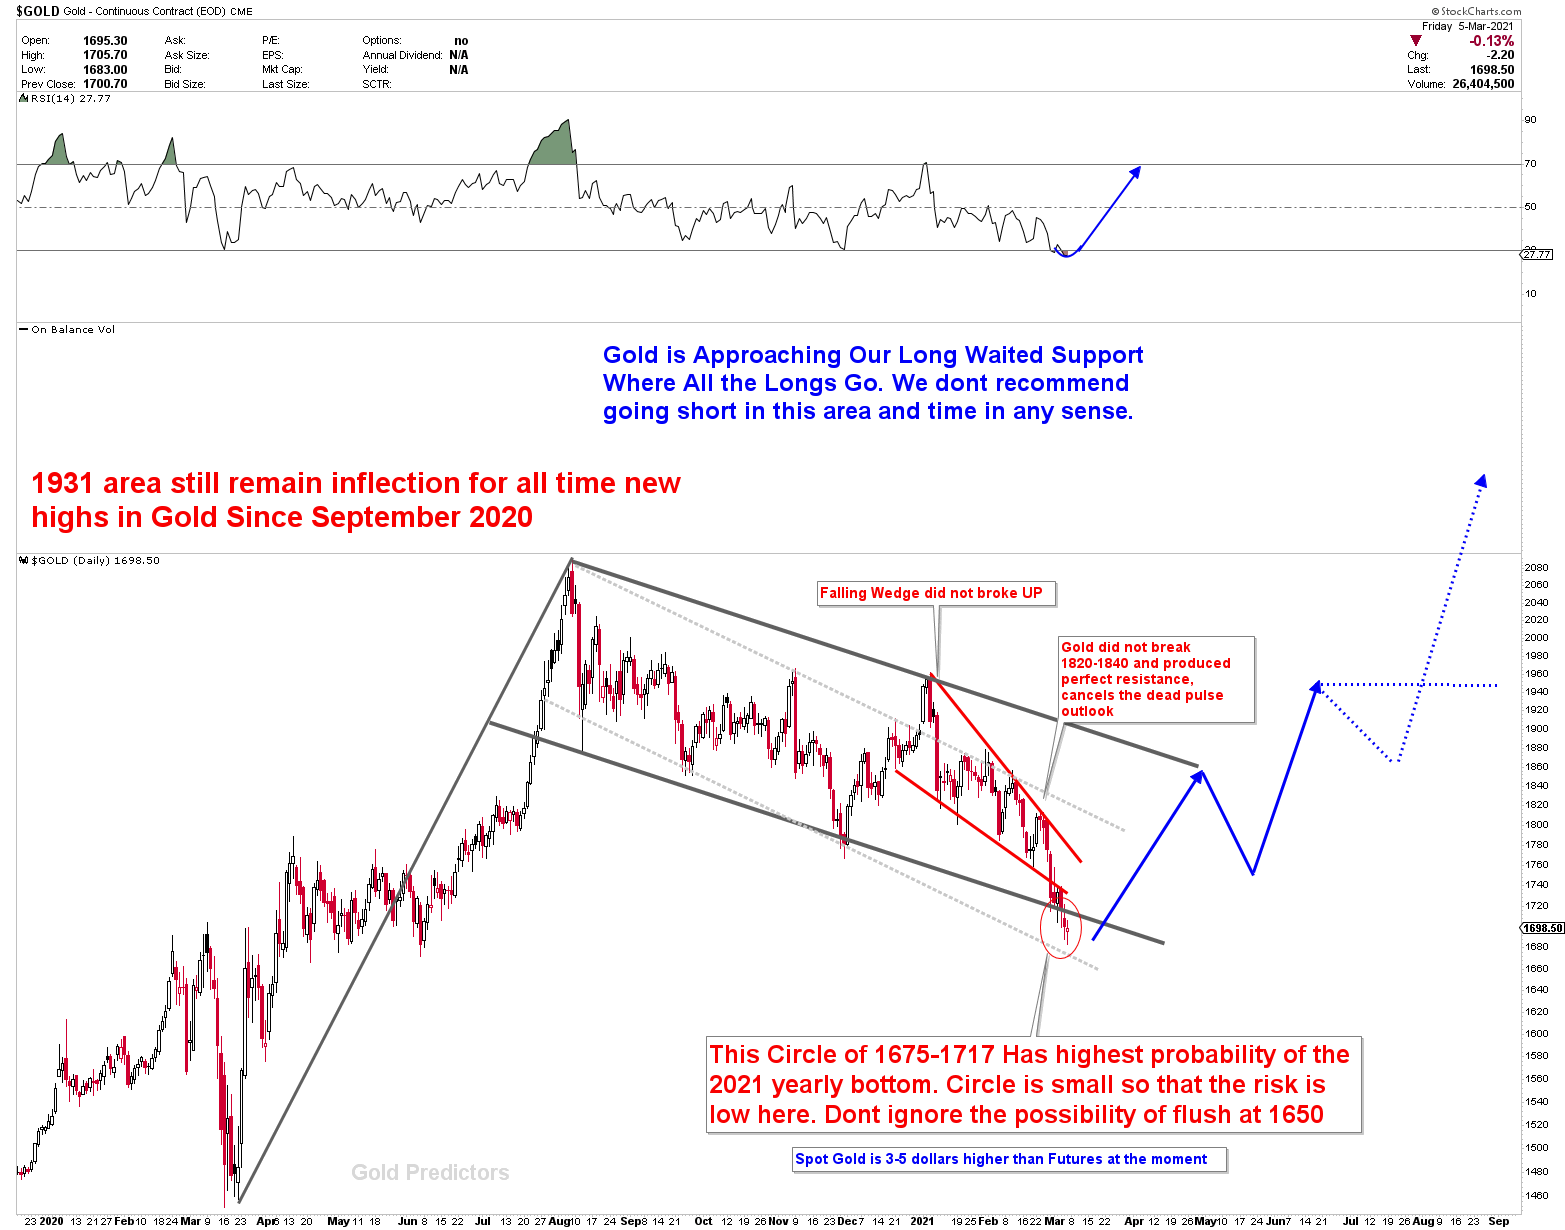
Returning to the gold daily chart, realized the price movement and compression in the circle region. Gold is still unable to react due to the strength of the dollar and is simply pushing lower. Once pressure is relieved, Gold can make it as a bottom. The area of support is BIG
Gold Compression at Inflection
While we have studied the support region, let’s look at how gold prices are compressing. In most cases, compression leads to expansion. Let’s take a look at the short term charts.
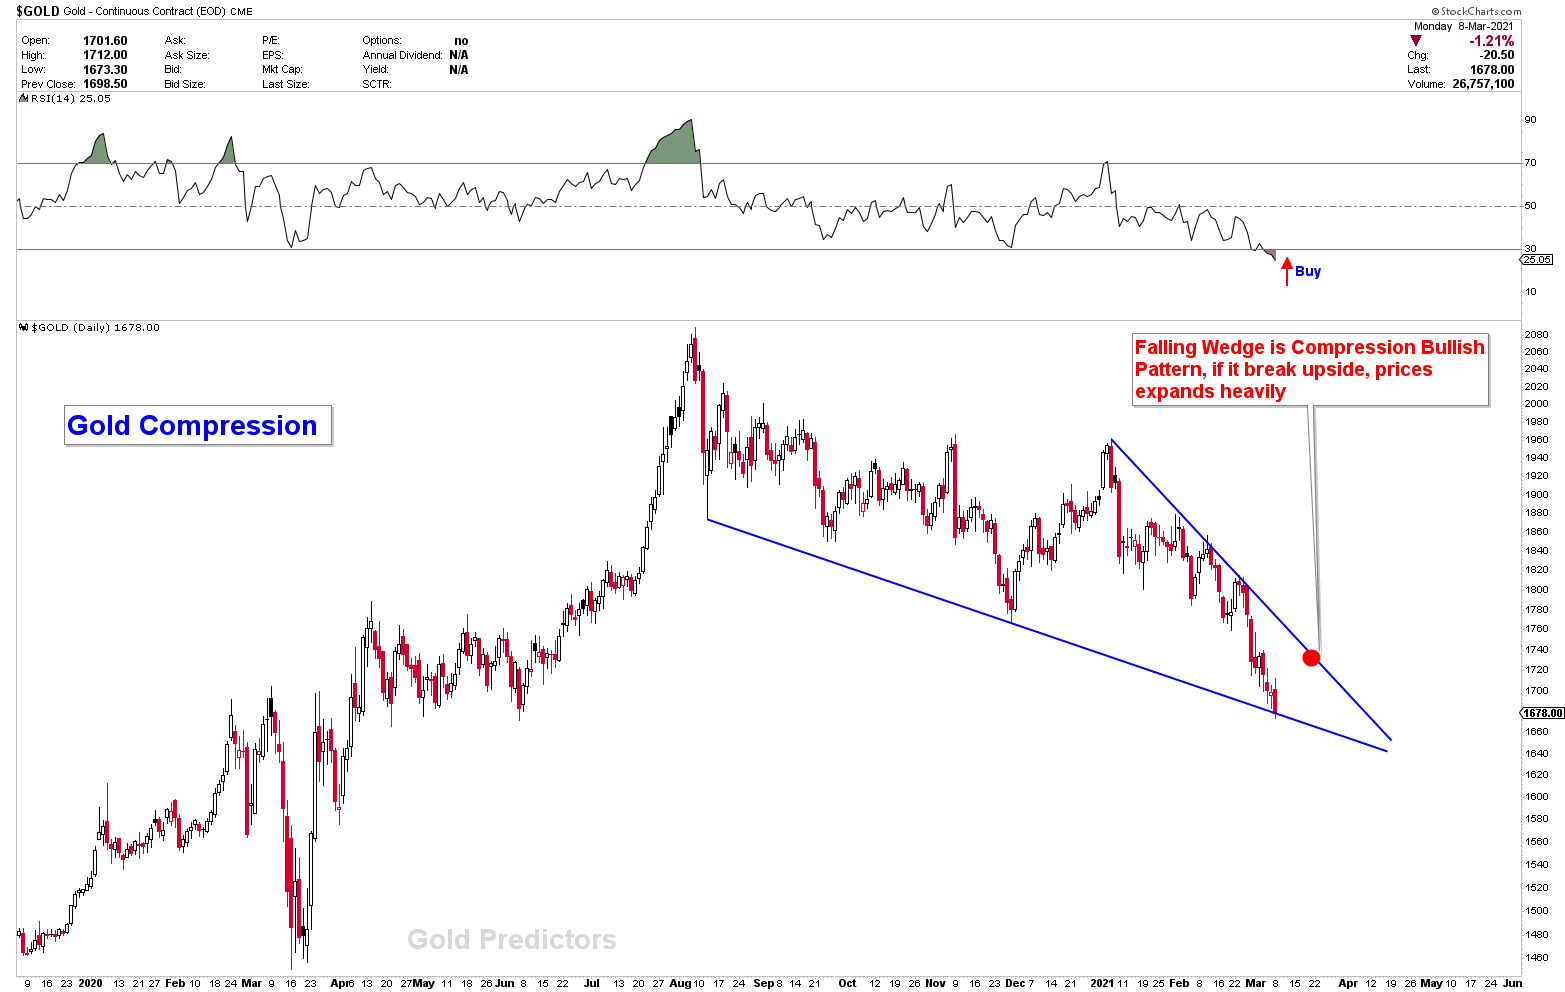
Prices have formed a falling wedge on the daily gold chart below. If the falling wedge breaks upside, it is a very bullish signal. The lower line, which gold tested at 1675 yesterday, is already an inflection point, indicating a strong bounce. However, due to the strong recovery in the US dollar, gold and other commodities are still under pressure. Falling wedges are compression patterns in which prices compresses to the end tip of triangle.
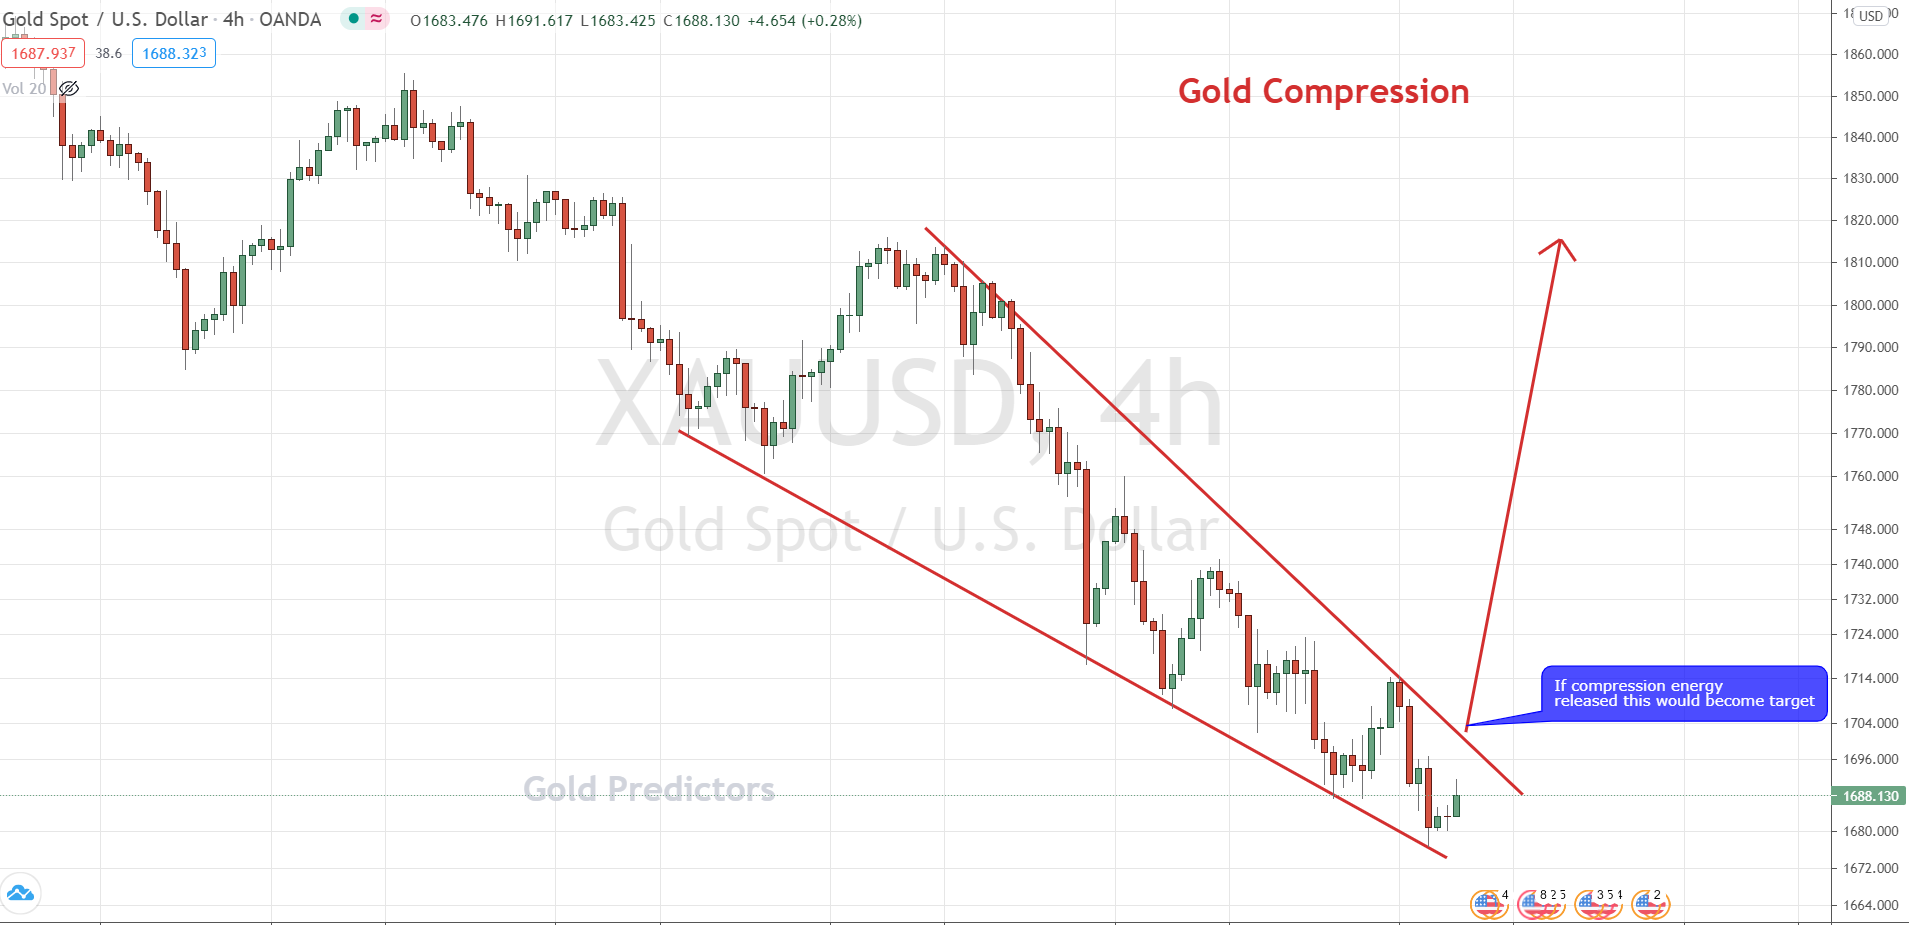
Gold, on the other hand, did the same compression on 4 hour charts, where the price hit 1675 yesterday, near the falling wedge’s lows. This type of behavior is similar to that of a building energy. However, due to cyclical and technical studies, there will be plenty of room for higher prices if this energy is released to the upside.
Few Correlated Markets
Let’s look at a few correlated markets. USDJPY is currently bearish in the long term. The development of perfect men’s heads and shoulders, followed by years of price oscillation in the triangle, is constructing something significant in this instrument. USDJPY has taken advantage of the dollar’s strength and is set to touch the triangle this week.
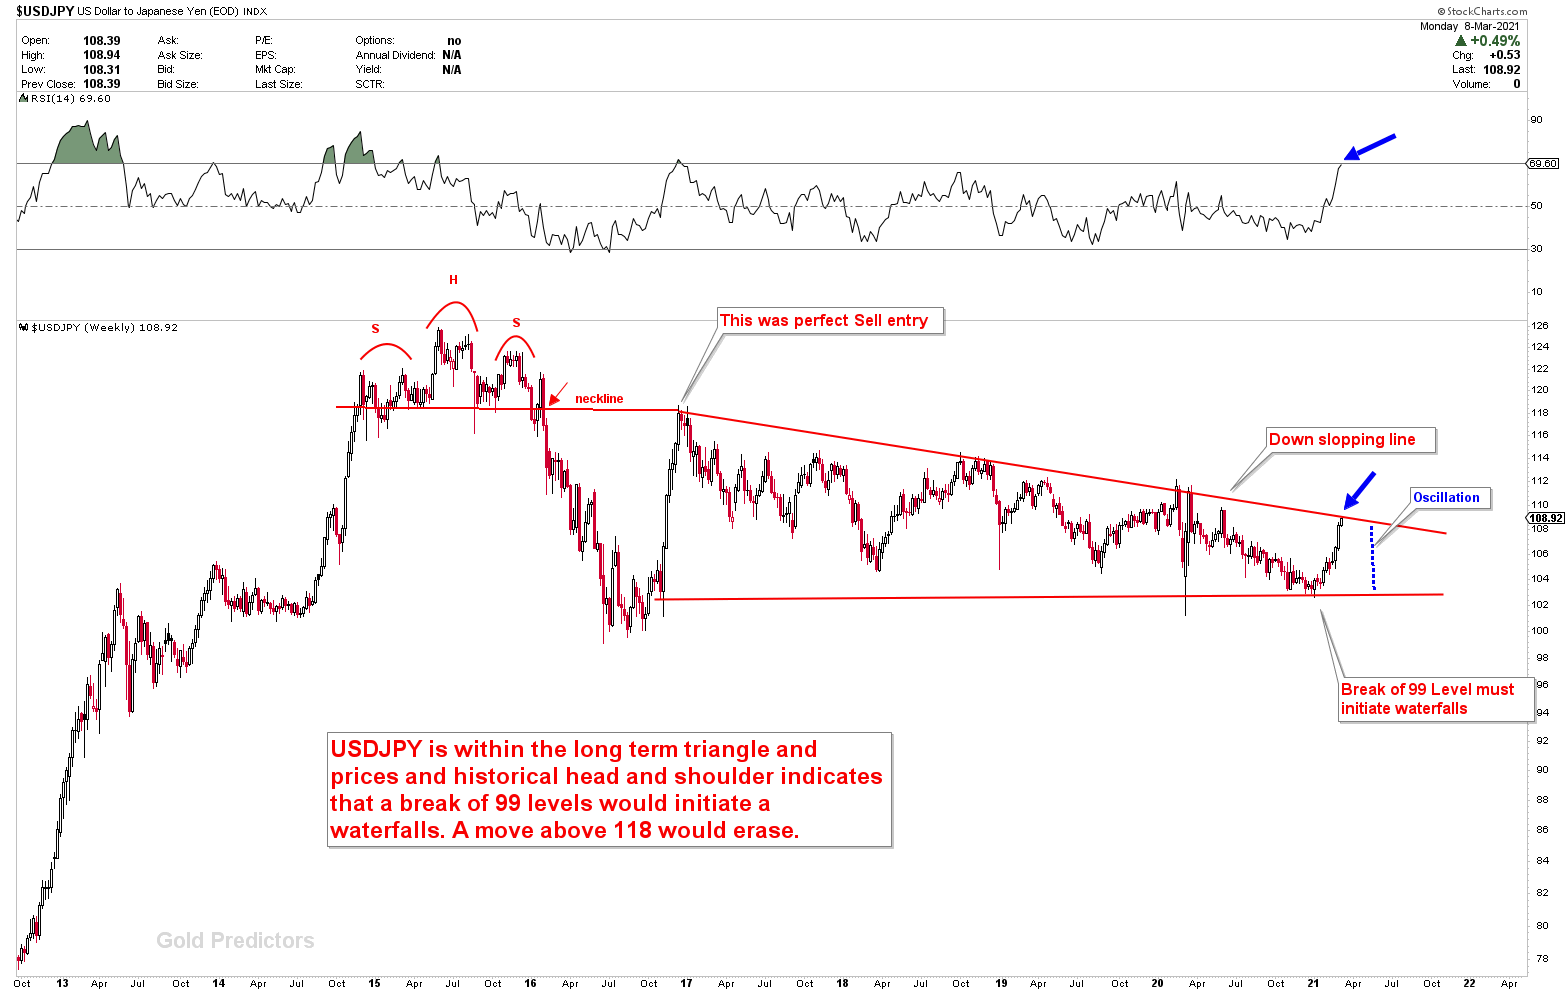
When the USDJPY reaches the triangle, gold signals a long-term bottom, as shown on the chart. This week, the USDJPY is hitting the triangle again; if this happens once more, gold will form a bottom. This scenario adds potential for gold bottom this month.
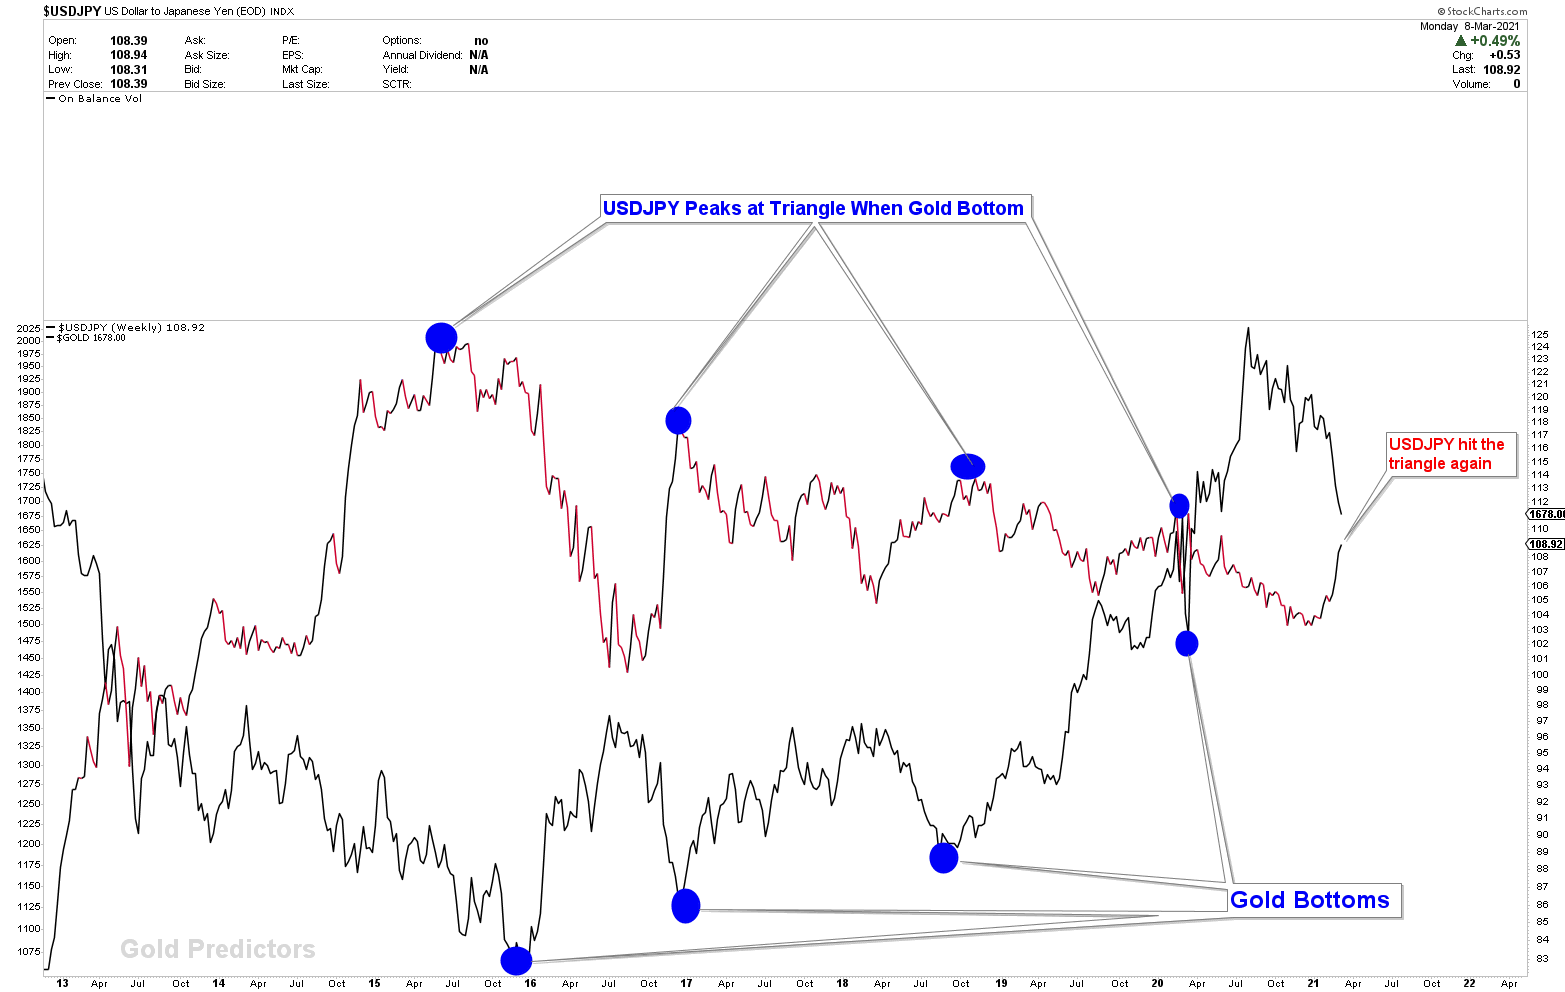
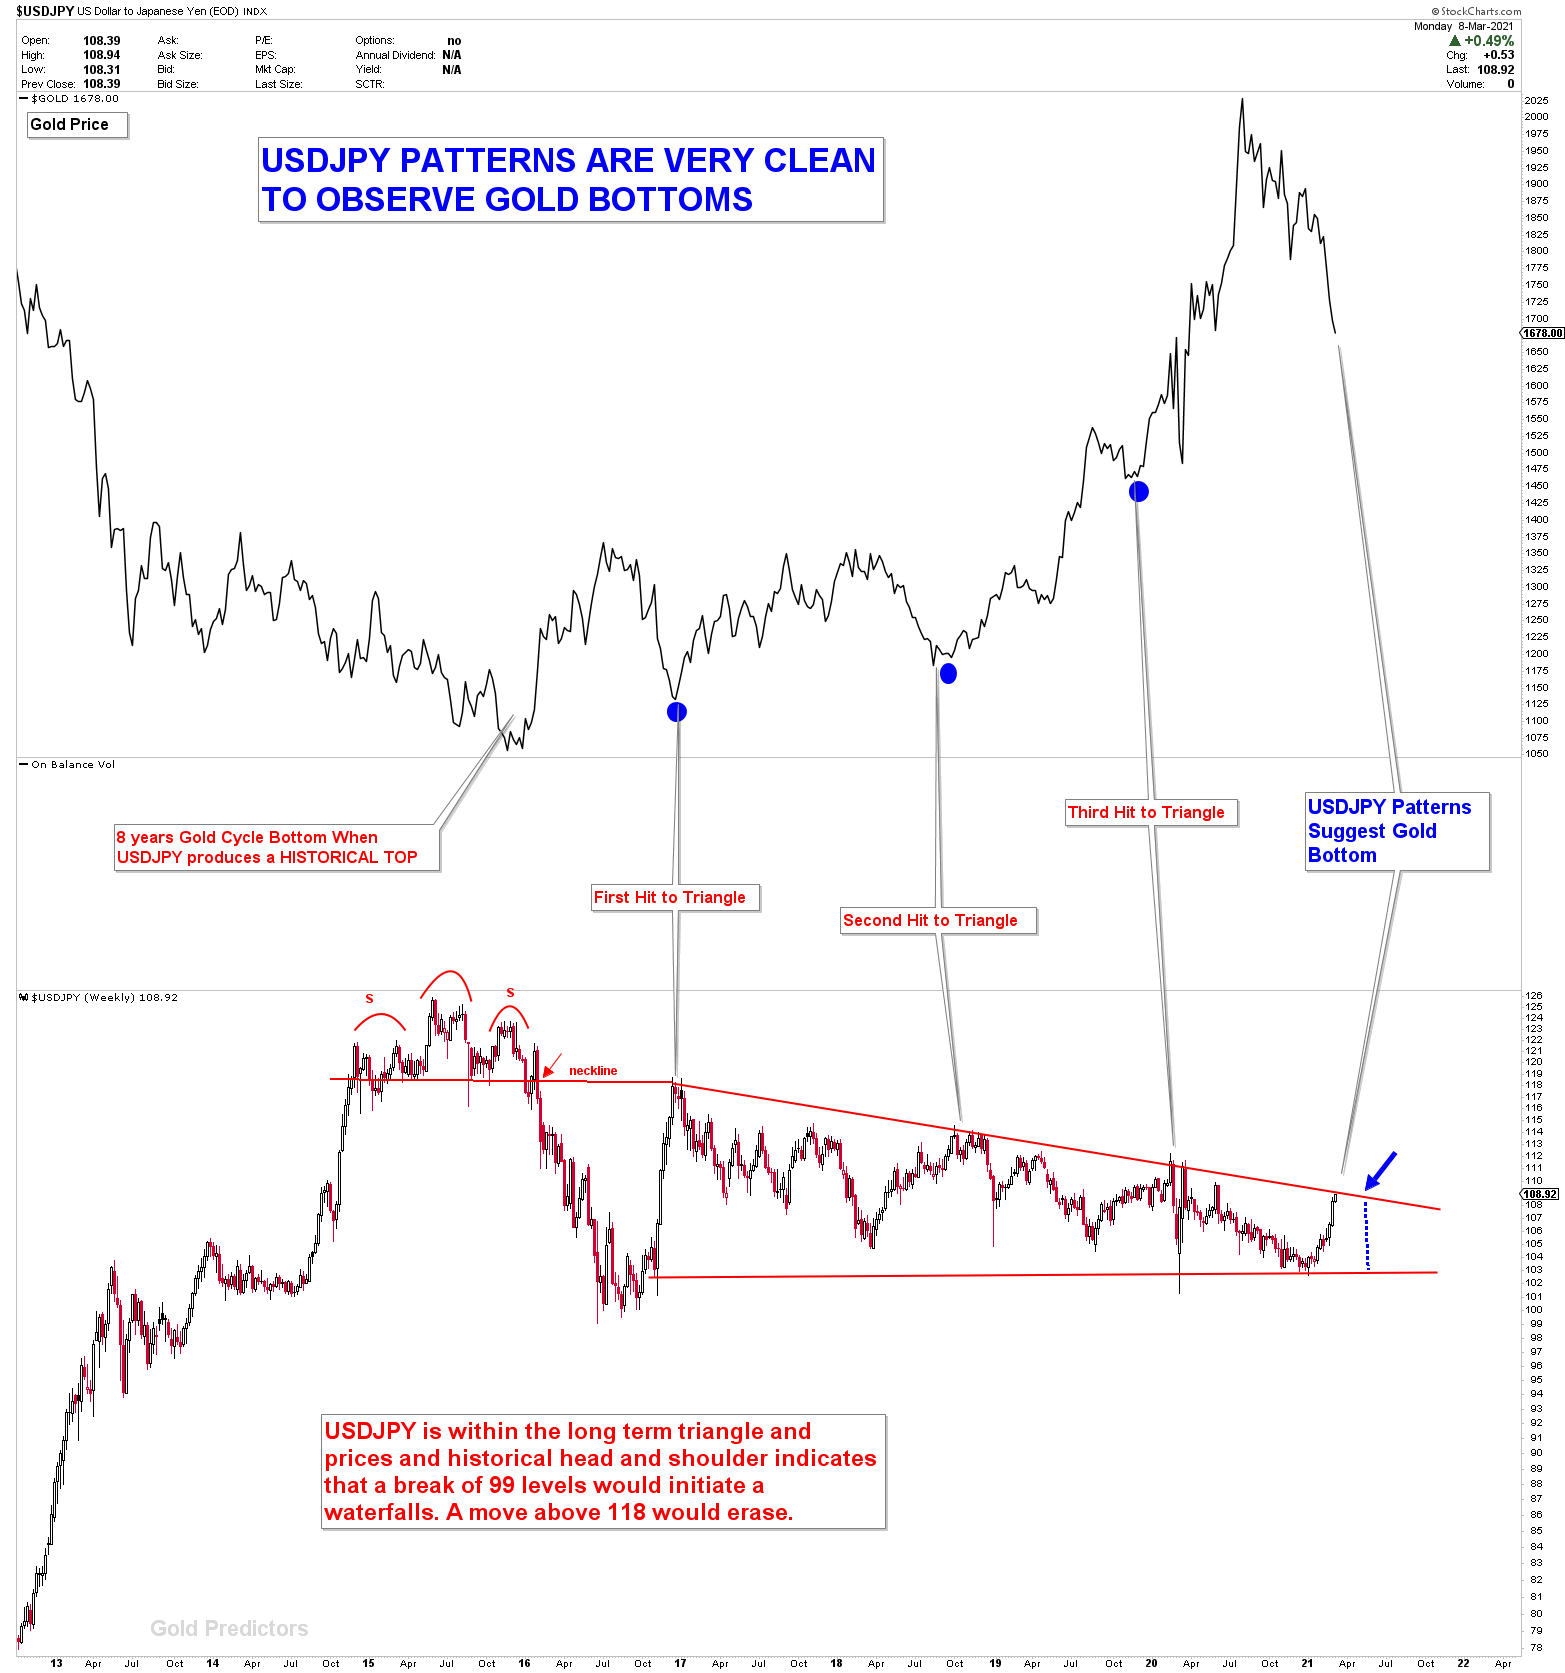
The development of patterns in USDJPY are very clean to observe the gold bottoms. This phenomena is very clear in the chart below. If USDJPY break above the triangle, that would be an indication that gold would fail.
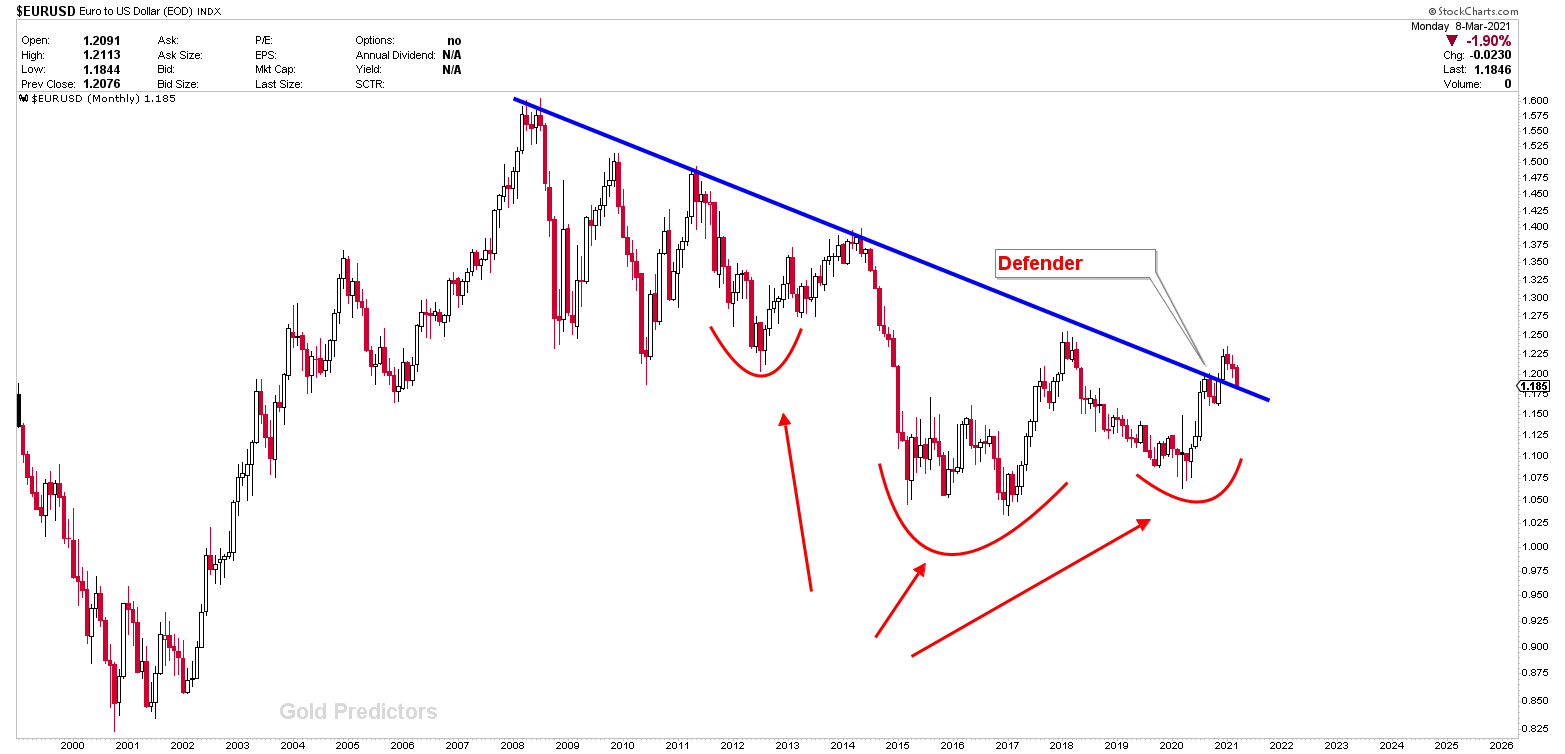
EURUSD, on the other hand, is approaching the monthly defender. If these charts play out, the dollar will soon resist and follow the downtrend, which could help gold bottom formations.
Realizing the Key Inflection Points
The inflection number started in 1725, when we executed a trade. 1725 has been proved to be a big number based on historical mining from our engineers. When gold hit 1725 for the first time, it immediately rebounded to 1760. The second number was 1687, which gold reached, and as we TWEET after the NFP on Friday, gold should not fall below 1687 on Friday. The jump from 1687 to 1715 was much thinner. The third point was touched yesterday between 1675 and 1680, and the bounce suggest that gold should touch 1697 and 1700 on Tuesday at the falling wedge line. The bounces are declining and lower numbers are being tested, indicating that the instrument is under extreme pressure, and that it requires one Hammer to come out from this pressure. While the gold price was approaching the critical inflection points, the first daily hammer occurred on March 2nd, when it rose from lows of 1707 to close above 1725, indicating a strong bullish signal. The signal was erased. The second hammer, which occurred on Friday, was from 1687 and was also erased due to the US economy’s boom (which I don’t call a boom but speculation). Now the third inflection was hit yesterday at 1680-1675 which is a long term strong buyer. But this number did not come up with any HAMMER.
Spot gold at 1680 has 38.2 percent retracement from the 8-year cycle lows to all-time highs. As per the statistics of last 50 years of gold bull markets, Gold bull market is healthy when it experience 38.2 percent correction and at the moment it lies at 1680.
These numbers are based on chart mining analysis by our engineers, but they meet the criteria set forth by normal technical analysts, which are listed below.
- 1687 is a 61.8% retracement of the year 2020. (lows of 2020 to highs of 2020)
- 1680 represents a 38.2% retracement of the 8-year cycle bottom to all-time highs.
- 1675 is Support for the lower channel Flag line.
- 1675 is Support of a falling wedge lower line.
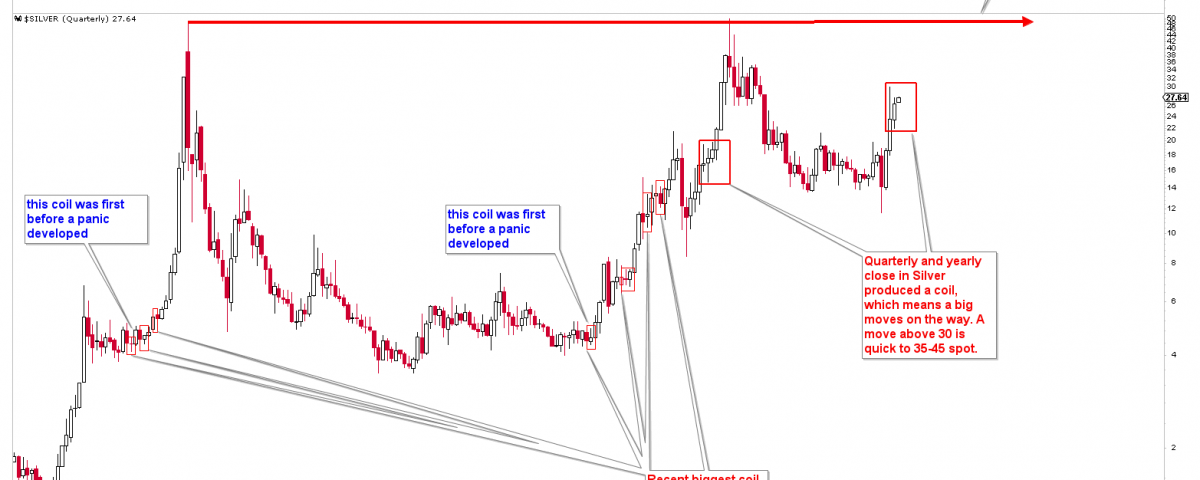
- Quarterly charts indicate that the market will bottom in March and then a quick reversal to close the quarter with a WICK (HAMMER).
Based on Above Analysis 1725-1680 remains the KEY INFLECTION POINT by our engineers, by normal technical analysts and by cyclical analyst, in all senses.
Gold is special instrument which has special analysis. It breaks all analyst’s expectation before following the expected path. Therefore, a quick FLUSH to 1650 can not be ignored yet.
Regardless of these facts, the market always prevails. Do what the markets want you to do. There are no obsoletes in markets. Who knows what the future holds. We don’t like a lot of correlation, but it can be beneficial at some times. For those who like correlated markets: Gold and Dollar both pullback together during current correction
Important Number
All support numbers are mentioned as above. 1675-1680 was so strong number. The first resistance would be 1697-1700 on Tuesday. Expect a shoot higher any time or otherwise a much downside moves. If prices go down that would be the last move to BUY GOLD> Last week gold close below 1725 broke our quick reversal outlook. 1725 and 1760-65 remains strong resistances at the moment. Weekly close above 1765 would BACKUP gold. Based on the new patterns we will update again. Markets are changing very rapidly nowadays.
There is Some Big Divergence on 10th March 2021. If Gold bottom, that might be the Day.
FINAL WORDS
The gold market is currently trading at a critical junction where all cycles collide. Gold has very strong support in the 1650-1725 regions, and if gold bottoms with some strong attitude, gold could make a 2021 bottom here. 1687 and 1680 are very powerful single numbers to keep an eye on. On the other hand, if this juncture is broken, gold will return to the grounds where the long-term cycles began. That is why it is referred to as a KEY INFLECTION POINT. And Gold Compression at these levels indicate something BIG
To receive the free trading alerts, signals and articles please subscribe as a Free member to the link below.
Note: The subject highlights the ideas and thoughts of the writer for educational support that can be used to enable the reader to become an independent thinker and decision maker.


