Gold Bullish Outlook Amid Global Financial Uncertainty | Gold Predictors - Forecasting Gold Prices

New York

London

Sydney

Tokyo

Log In

  • Register
  • Lost your password?
gold predictorsgold predictorsgold predictorsgold predictors
  • HOME
  • ABOUT US
    • About Us
    • Social Networks
    • Industry Links
    • Testimonials
  • RESEARCH
    • Scientific Trade Strategies
    • Gold Hub
    • Gold Importance
    • Silver Importance
  • GOLD HUB
  • GOLD ANALYSIS
    • Gold Analysis
    • Technical Analysis
      • Trend Identification
      • Phase Identification
      • Important Levels
      • Volatility Measurement
    • Gold Cycle
      • Short Term Cycles
      • Medium Term Cycles
      • Long Term Cycles
    • Price Action Analysis
      • Phase Identification
      • Historical Pattern Identification
      • Candlestick Pattern Identification
    • Fundamental Analysis of Gold
    • Gold Related Markets Analysis
    • Gold Seasonal
  • TRADING METHODOLOGY
    • Gold Analysis
      • Technical Analysis
      • Gold Cycle
      • Price Action Strategy
      • Fundamental Analysis
      • Gold Related Markets Analysis
      • Gold Seasonal
    • Measure Signal Strength
      • Weak Signal
      • Strong Signal
      • Confirmed Signal
    • Trading Decision
    • Trading Rules
      • Basic Trading Rules
      • Gold Predictors Trading Rules
    • Trade Examples
    • Performance
  • LIVE CHARTS
  • MEMBERSHIPS
    • Free Membership
    • Premium Membership
    • SignUp
  • MEMBERS AREA
    • Free Article
    • Premium Article
    • Trading Signals
    • Long Term Signals
    • Forex Reports
    • Crypto Reports
  • FOREX REPORTS
  • HELP
    • FAQ
    • Contact Us
Login / Register

Gold Bullish Outlook Amid Global Financial Uncertainty

0
Published by admin at May 1, 2023
Categories
  • Free Articles
Tags
gold bullish

Gold Daily Chart

The gold market has recently experienced a rebound from a strong long-term support level and continues to trade higher. This bullish outlook in the gold market can be traced back to the 10th of March 2023, when the collapse of Silicon Valley Bank initiated a global financial crisis. The potential recession in 2023 is expected to further accelerate gold demand, potentially breaking key levels observed over the past few months.

Technical Analysis of the Gold Market

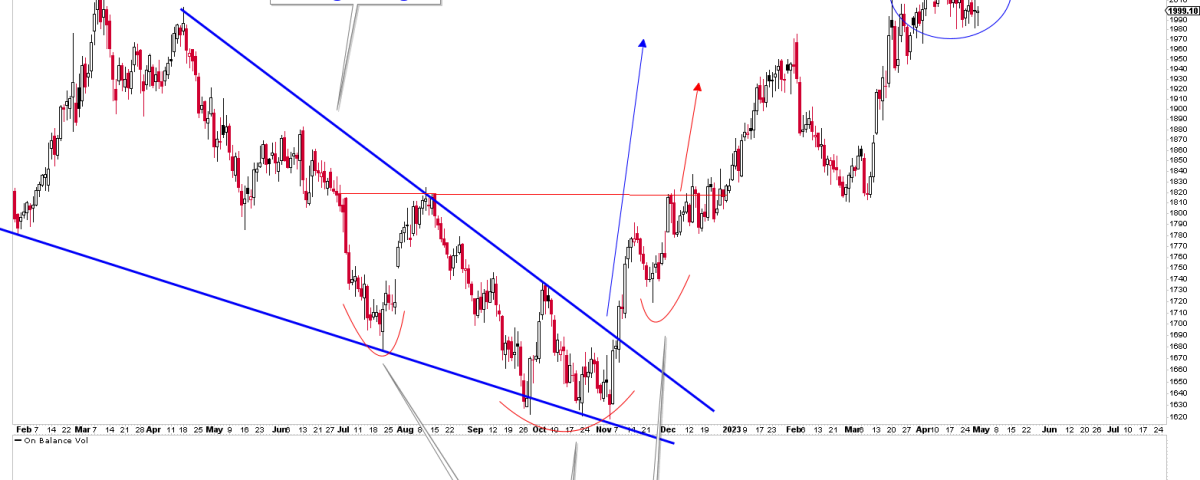
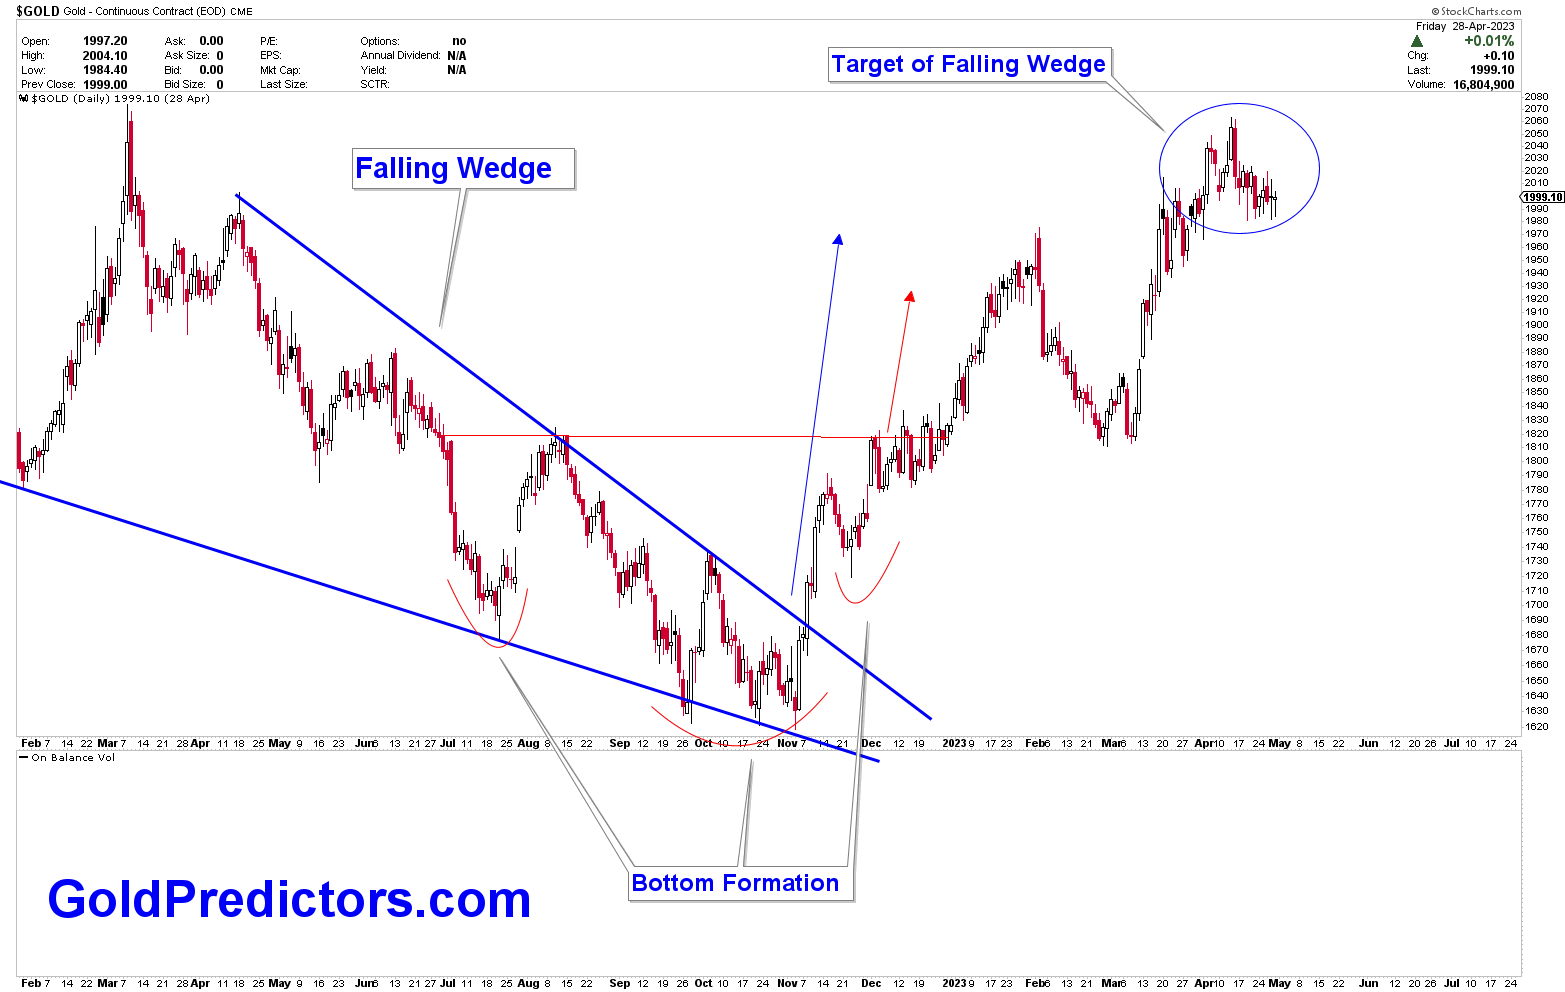
A falling wedge pattern was previously identified in the gold market, which signaled a bullish outlook and a target price range of $1,975 to $2,075. The emergence of an inverted head and shoulders pattern further supported the bullish trend, targeting the same price range. As anticipated, the price broke higher and reached the target, as demonstrated in the chart below.

gold bullish
Gold Daily Chart

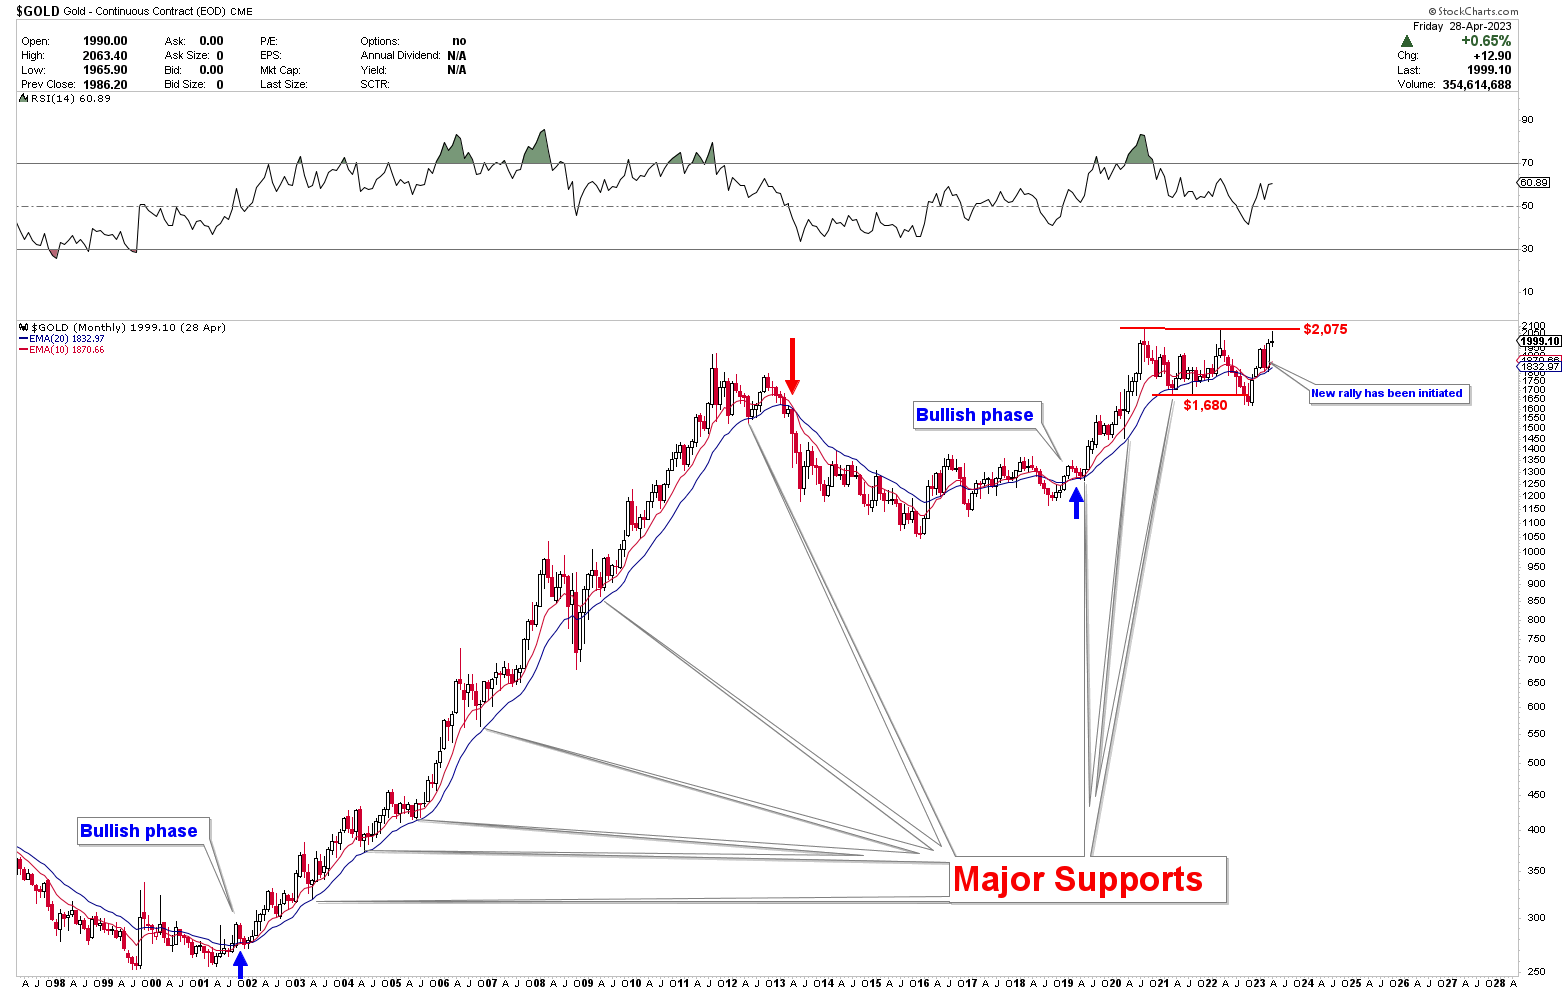
The chart also highlights the 10 and 20-month moving averages, indicating a bullish trend in the market as the price trades above both moving averages. With the Relative Strength Index (RSI) above 50 and the price above the 10 and 20-month averages, the gold market remains strongly bullish. The key level of $2,075 has been discussed repeatedly, and it is likely that the price will break through this level in the near future.

Gold bullish outlook
Gold Monthly Chart

Key Actions for Traders

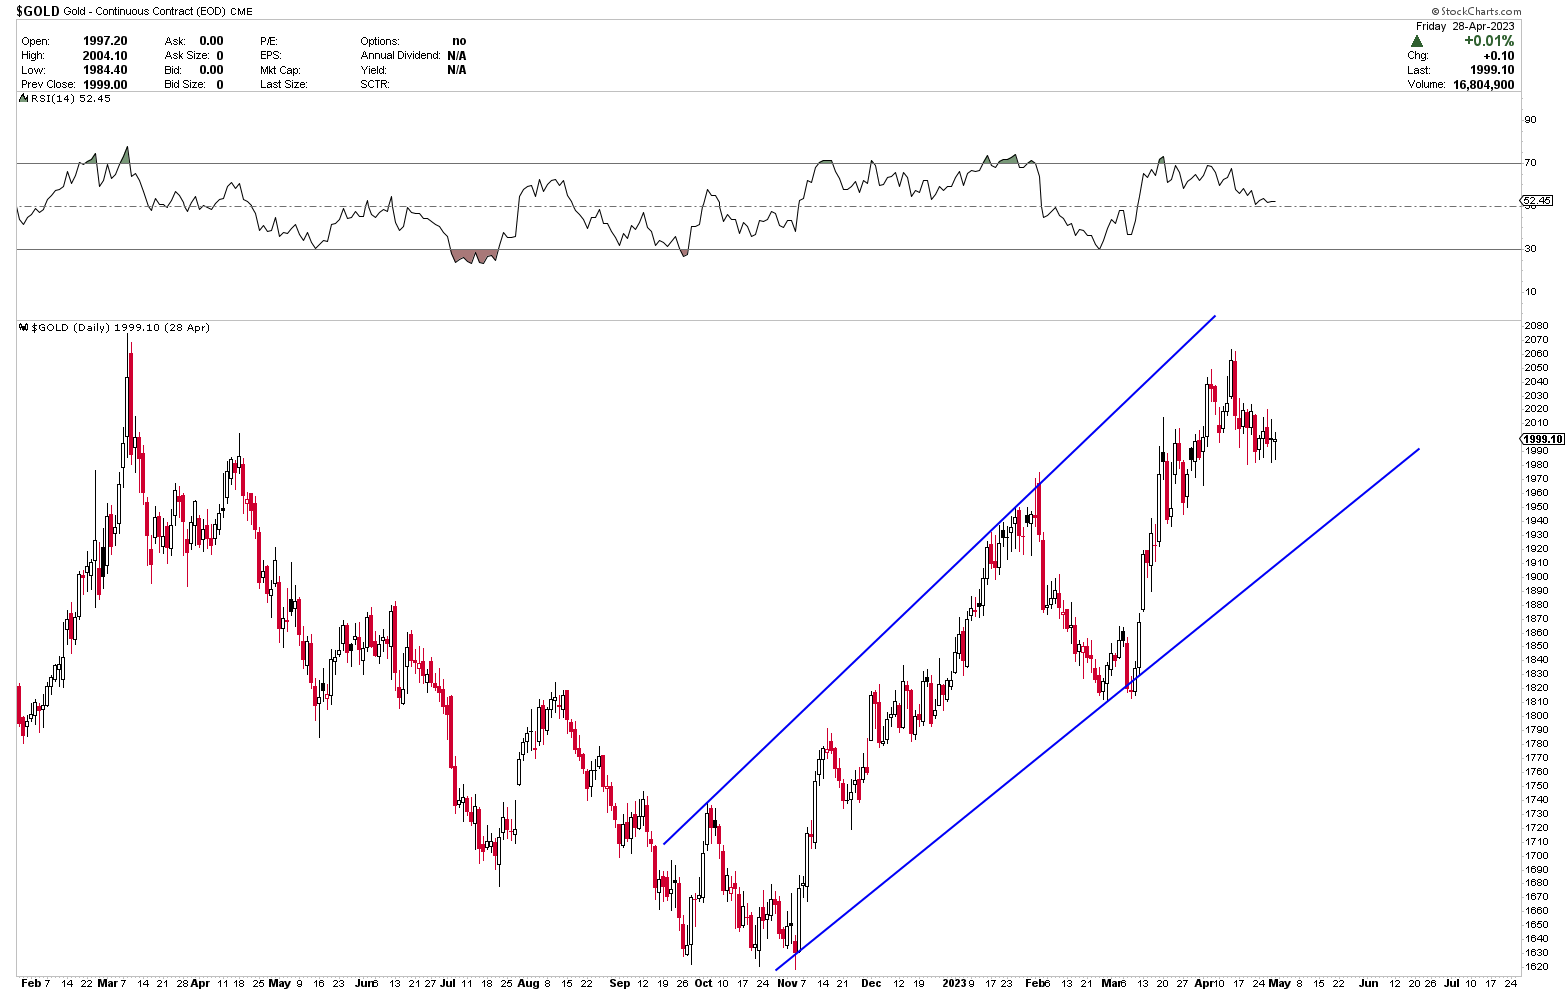
As the gold price has hit the key level of $2,075, a correction to lower levels is expected before breaking higher. Traders can take advantage of this potential correction by entering long positions in the gold market. Strong support exists around the $1,900 region, where traders can execute long positions targeting higher levels. The chart below illustrates the channel within which the price is moving. Any correction may also reach the lower support line of this channel at the $1,890 to $1,920 levels, providing a strong support base in the gold market. If the price breaks through the $2,075 level, the gold market will generate a strong buy signal targeting significantly higher levels.

Gold uncertainty
Gold Daily Chart

Bottom Line

The gold market has shown resilience and bullish momentum in light of the recent global financial crisis. The technical analysis reveals a positive outlook for gold, with key levels and support zones identified for traders to consider. As the possibility of a recession in 2023 looms, gold demand is expected to grow, further bolstering the bullish trend. By closely monitoring the market and acting on the key levels and support zones identified, traders can capitalize on the opportunities presented in the gold market amid global financial uncertainty.

Related posts

silver pattern
May 13, 2025

Silver Bullish Structure Points to Explosive Move Amid Gold Ratio Breakout


Read more
silver pattern
May 9, 2025

Silver Bullish Patterns Signal Move Toward $50


Read more
gold pattern
May 8, 2025

Gold Breaks Multi-Decade Resistance as Gold/Silver Ratio Nears Historic Turning Point


Read more

Comments are closed.

ABOUT US

  • About Us
  • Social Networks
  • Industry Links
  • Testimonials
  • Terms & Conditions

TECHNICAL ANALYSIS

  • Technical Analysis
  • Trend Identification
  • Phase Identification
  • Important Levels
  • Volatility Measurement

CYCLE ANALYSIS

  • Gold Cycle
  • Short Term Cycles
  • Medium Term Cycles
  • Long Term Cycles

PRICE ACTION ANALYSIS

  • Price Action Analysis
  • Phase Identification
  • Historical Pattern Identification
  • Candlestick Pattern Identification
© 2017 Gold Predictors. All Rights Reserved.
  • Remember Me
    Lost your password?
    Dont have an account?Sign Up