


Gold Breaks Out of Multi-Decade Triangle as Industrials Lose Ground
Gold (XAUUSD) has broken out of a multi-decade triangle, signaling the start of a long-term bullish cycle. The breakout above $3,000 ended a prolonged consolidation and triggered a powerful upward move. Price accelerated toward $5,600 before pulling back, but remains above key structural levels. This breakout confirms a large base formation, often seen before major revaluation phases. At the same time, the XLI/Gold ratio has broken down from a multi-decade triangle, highlighting weakening relative strength in industrials. These developments point to a structural shift in market leadership that continues to favor gold.
Gold Exits Multi-Decade Triangle and Enters New Long-Term Upside Phase
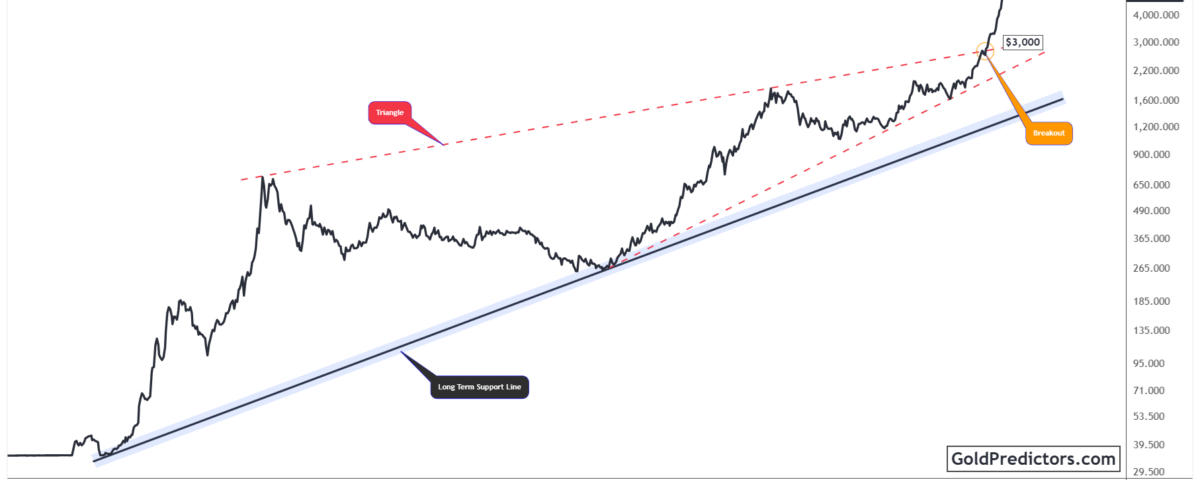
The gold chart below shows a breakout from a multi-decade triangle pattern, signaling a significant structural shift in the long-term trend. The formation developed over several decades, with progressively lower highs from the early 1980s and firm support along a rising trendline. Price remained compressed within this structure until gold broke decisively above the $3,000 level. This breakout marked the end of a prolonged consolidation phase and the beginning of a new bullish cycle.
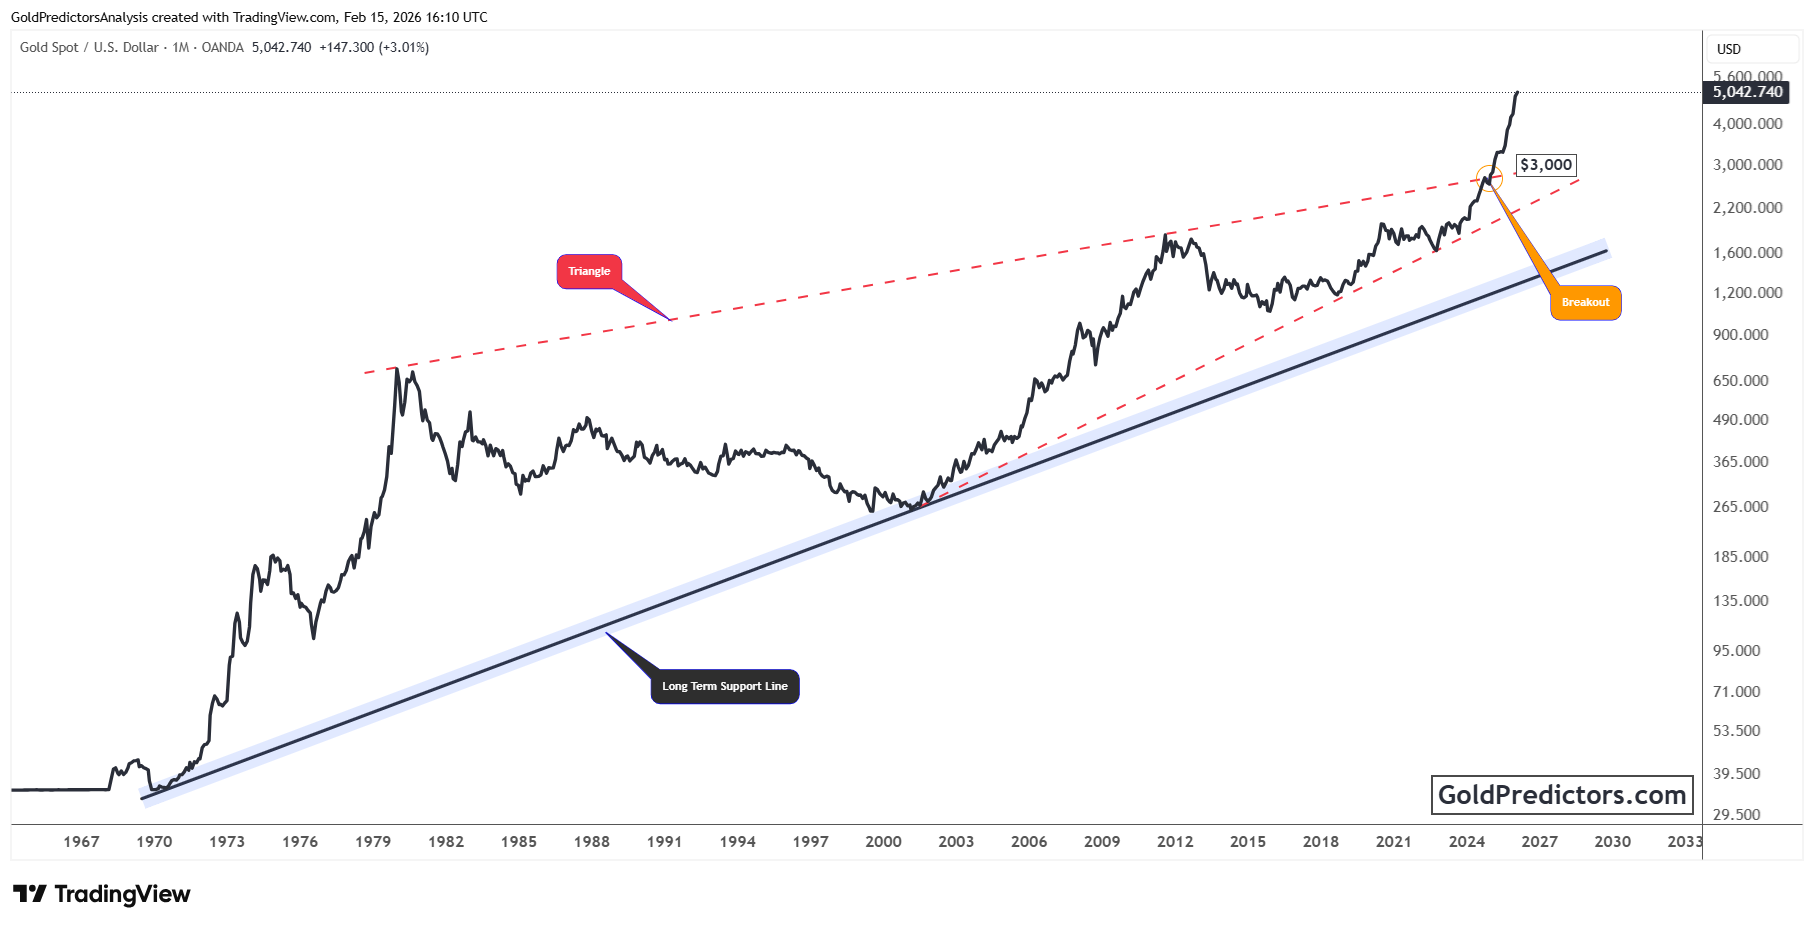
The breakout came with strong upward momentum, as gold surged past the triangle’s upper boundary and accelerated toward $5,600. After reaching that peak, the price pulled back but remained above key structural levels. This move reflects a notable shift in market dynamics, driven by growing demand for hard assets. Price stability above former resistance points to consolidation rather than trend failure.
Additionally, the chart shows a long-term support line that has guided the price since the 1970s and continues to act as the foundation of this structure. The breakout has shifted focus toward higher price targets, well above current levels. While gold may face short-term pullbacks, the broader setup favors further upside as long as the price holds above the former resistance zone.
Gold Regains Strength as XLI Ratio Breaks Down from Multi-Decade Triangle
The chart below shows the XLI/Gold ratio breaking down from a multi-decade symmetrical triangle. This structure reflected long-term shifts in relative strength between industrial equities and gold. From 2013 to 2021, the ratio moved higher, reflecting a period where industrials outperformed gold. However, the recent breakdown below the triangle’s support signals a reversal in that trend. It suggests gold is now regaining strength relative to industrials, with the ratio entering a new downtrend phase.
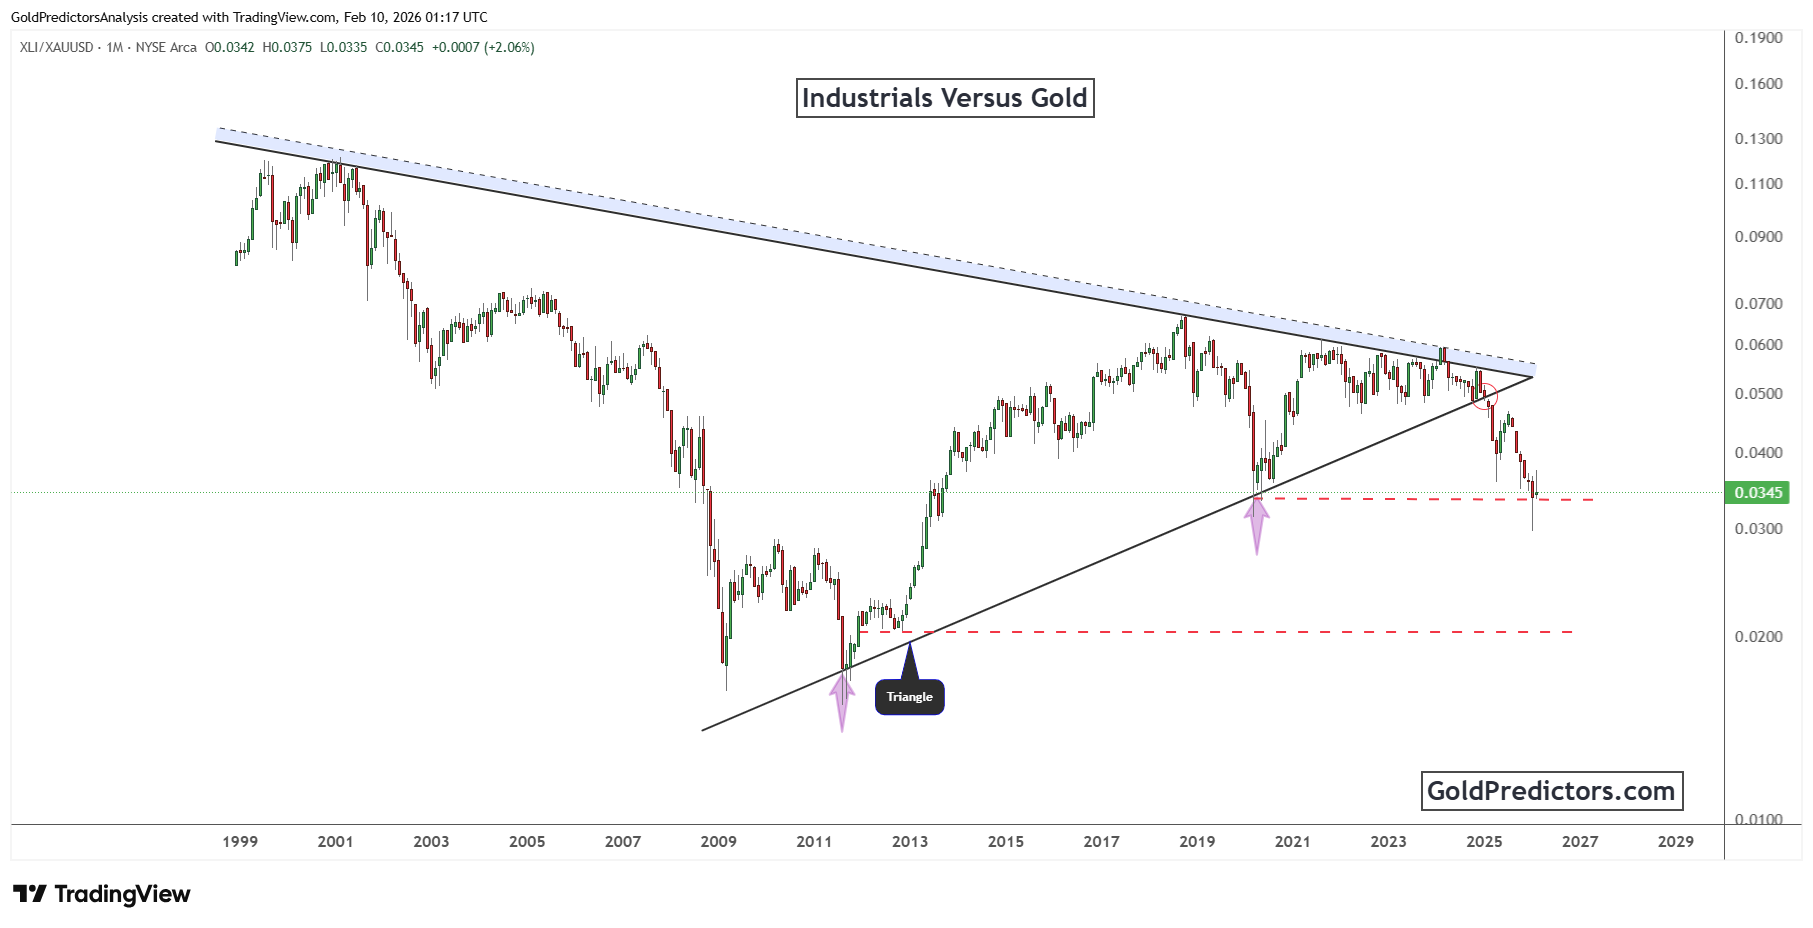
Following that breakdown, the ratio is now testing a horizontal level near 0.034, an area that served as a pivotal turning point in past cycles. This test follows the breach of a long-standing ascending trendline that had supported the ratio for more than a decade. The current setup points to continued relative strength in gold as capital shifts toward hard assets under evolving macro conditions.
The next major support zone lies closer to the 0.020 area. A decisive move below this zone would confirm a broader regime shift and could mark the start of a deeper outperformance cycle in favor of gold. This evolving breakdown from the long-term triangle structure highlights weakening relative strength in industrial equities and suggests that capital is beginning to rotate toward hard assets.
Gold Outlook: Structural Breakout and Capital Rotation Support Further Upside
Gold has moved beyond a multi-decade triangle, signaling a decisive shift in long-term direction. The break above $3,000 ended a prolonged consolidation phase and initiated a new advance. Price has since established a firm base above this level, confirming acceptance of higher ranges. As long as gold remains above former resistance, the broader setup continues to favor sustained upside.
At the same time, the XLI-to-Gold ratio has broken down from a multi-decade triangle, revealing weakening relative strength in industrial equities. The ratio failed to hold its trendline and is now testing a critical level near 0.034. The breakdown signals declining leadership in cyclical assets as capital favors gold and other real assets. Unless the ratio reverses meaningfully, gold is likely to retain its relative leadership across asset classes.
These developments point to a larger revaluation cycle favoring gold. The structural breakout in price and the confirmation through intermarket ratios both highlight growing demand for monetary hedges. As long as gold holds above former resistance and the XLI/Gold ratio stays under pressure, the outlook supports continued gold strength.
Gold Predictors Premium Membership
Get exclusive short-term and swing trade ideas with precise entry levels, stop-loss, and target prices, including justification and analysis — all delivered directly via WhatsApp.
Our premium service includes deep technical analysis on gold and silver markets. We cover cycle analysis, price forecasting, and key timing levels.
Members also receive a weekly market letter with detailed analysis, commentary from our Chief Analyst, including actionable insights, trade timing, and direction forecasts for gold and silver.
Stay ahead of the market — join our premium community today.


