Gold Breaks Multi-Decade Resistance as Gold/Silver Ratio Nears Historic Turning Point | Gold Predictors - Forecasting Gold Prices

New York

London

Sydney

Tokyo

Log In

  • Register
  • Lost your password?
gold predictorsgold predictorsgold predictorsgold predictors
  • HOME
  • ABOUT US
    • About Us
    • Social Networks
    • Industry Links
    • Testimonials
  • RESEARCH
    • Scientific Trade Strategies
    • Gold Hub
    • Gold Importance
    • Silver Importance
  • GOLD HUB
  • GOLD ANALYSIS
    • Gold Analysis
    • Technical Analysis
      • Trend Identification
      • Phase Identification
      • Important Levels
      • Volatility Measurement
    • Gold Cycle
      • Short Term Cycles
      • Medium Term Cycles
      • Long Term Cycles
    • Price Action Analysis
      • Phase Identification
      • Historical Pattern Identification
      • Candlestick Pattern Identification
    • Fundamental Analysis of Gold
    • Gold Related Markets Analysis
    • Gold Seasonal
  • TRADING METHODOLOGY
    • Gold Analysis
      • Technical Analysis
      • Gold Cycle
      • Price Action Strategy
      • Fundamental Analysis
      • Gold Related Markets Analysis
      • Gold Seasonal
    • Measure Signal Strength
      • Weak Signal
      • Strong Signal
      • Confirmed Signal
    • Trading Decision
    • Trading Rules
      • Basic Trading Rules
      • Gold Predictors Trading Rules
    • Trade Examples
    • Performance
  • LIVE CHARTS
  • MEMBERSHIPS
    • Free Membership
    • Premium Membership
    • SignUp
  • MEMBERS AREA
    • Free Article
    • Premium Article
    • Trading Signals
    • Long Term Signals
    • Forex Reports
    • Crypto Reports
  • FOREX REPORTS
  • HELP
    • FAQ
    • Contact Us
Login / Register

Gold Breaks Multi-Decade Resistance as Gold/Silver Ratio Nears Historic Turning Point

0
Published by admin at May 8, 2025
Categories
  • Free Articles
Tags
  • day trading
  • forex
  • gold
  • silver
  • trading signal
gold pattern

The long-term price action for gold shows a significant breakout that could shape the market’s direction for years to come. The gold-to-silver ratio provides a clearer understanding of the unfolding dynamics within the gold market. Observations suggest that gold remains in a long-term bullish phase, where any correction is viewed as a buying opportunity.

Gold Breaks Multi-Decade Resistance: Is $4,000 the Next Target?

The gold chart below shows a decisive breakout above a long-term resistance line that has capped gold prices for several decades. The resistance line began forming in the late 1970s and held firm during the peaks of 1980, 2011, and again in the early 2020s. These previous highs marked a top in gold prices, followed by long consolidation periods.

gold pattern

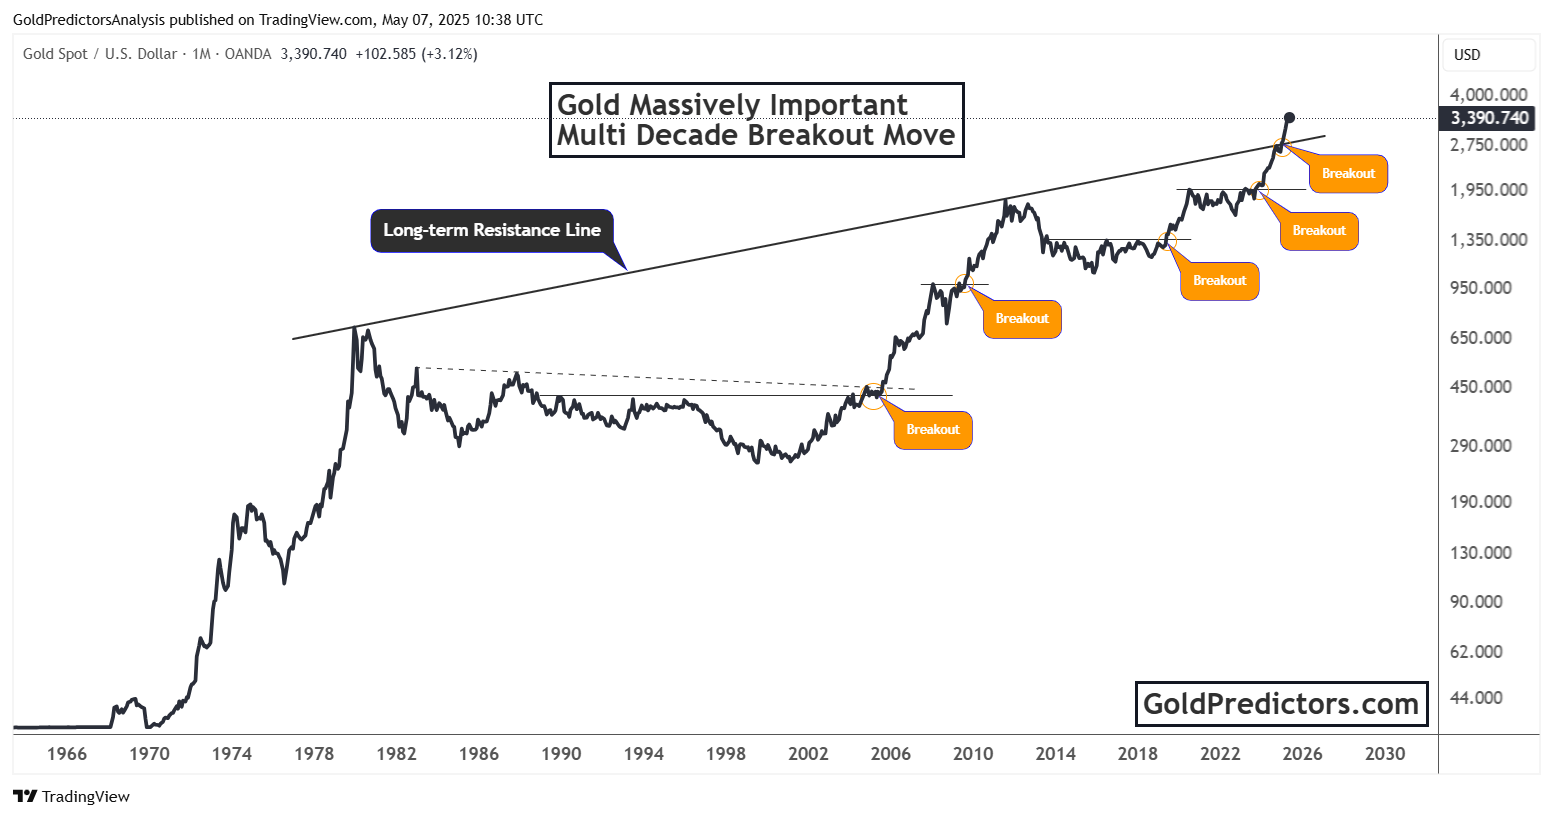
However, the most recent move has changed that pattern. In 2024, gold broke out convincingly above this resistance line. The breakout has taken the gold price to a record level of $3,500 per ounce, which signals that this move is not a false breakout but a structural shift in the market. The chart identifies key breakout points throughout the past few decades, notably 2005, 2009, 2019, and 2024–2025.

Each breakout in the past has led to significant price rallies. For instance, after the 2005 breakout, gold surged over 300% within a few years. The 2009 breakout initiated a move that nearly doubled gold prices within two years. History suggests the current breakout could drive prices even higher, potentially towards $4,000. The chart shows gold floats above previous resistance levels with no central ceiling.

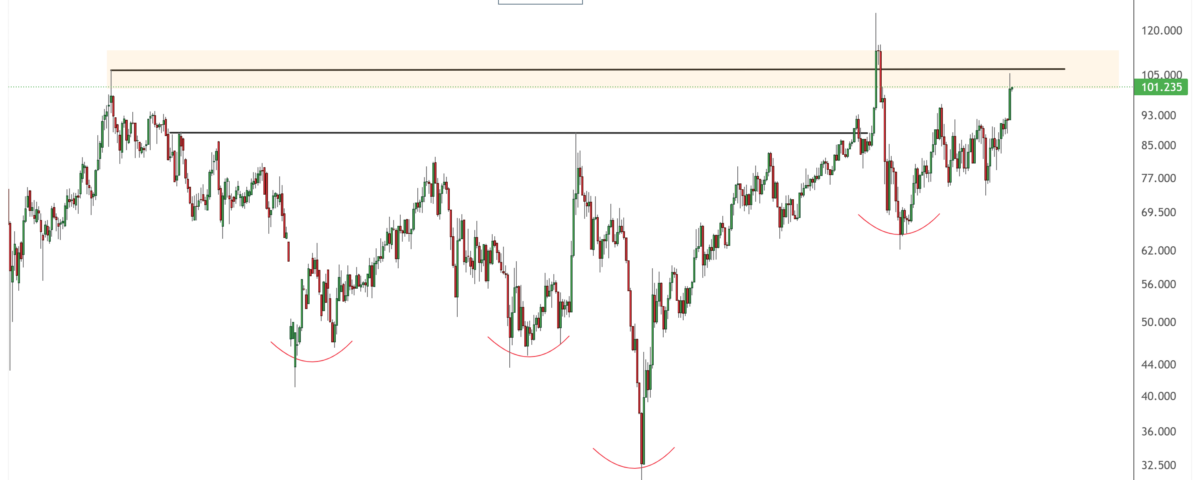
Gold-to-Silver Ratio Breakout Could Signal Next Big Move in Gold Prices

The chart below shows the gold-to-silver ratio, another critical indicator of gold and silver market direction. Historically, a high ratio means gold outperforms silver, typically during financial stress or uncertainty. Conversely, a falling ratio suggests silver is catching up or outperforming gold, often during inflationary booms or when industrial demand for silver increases.

gold pattern

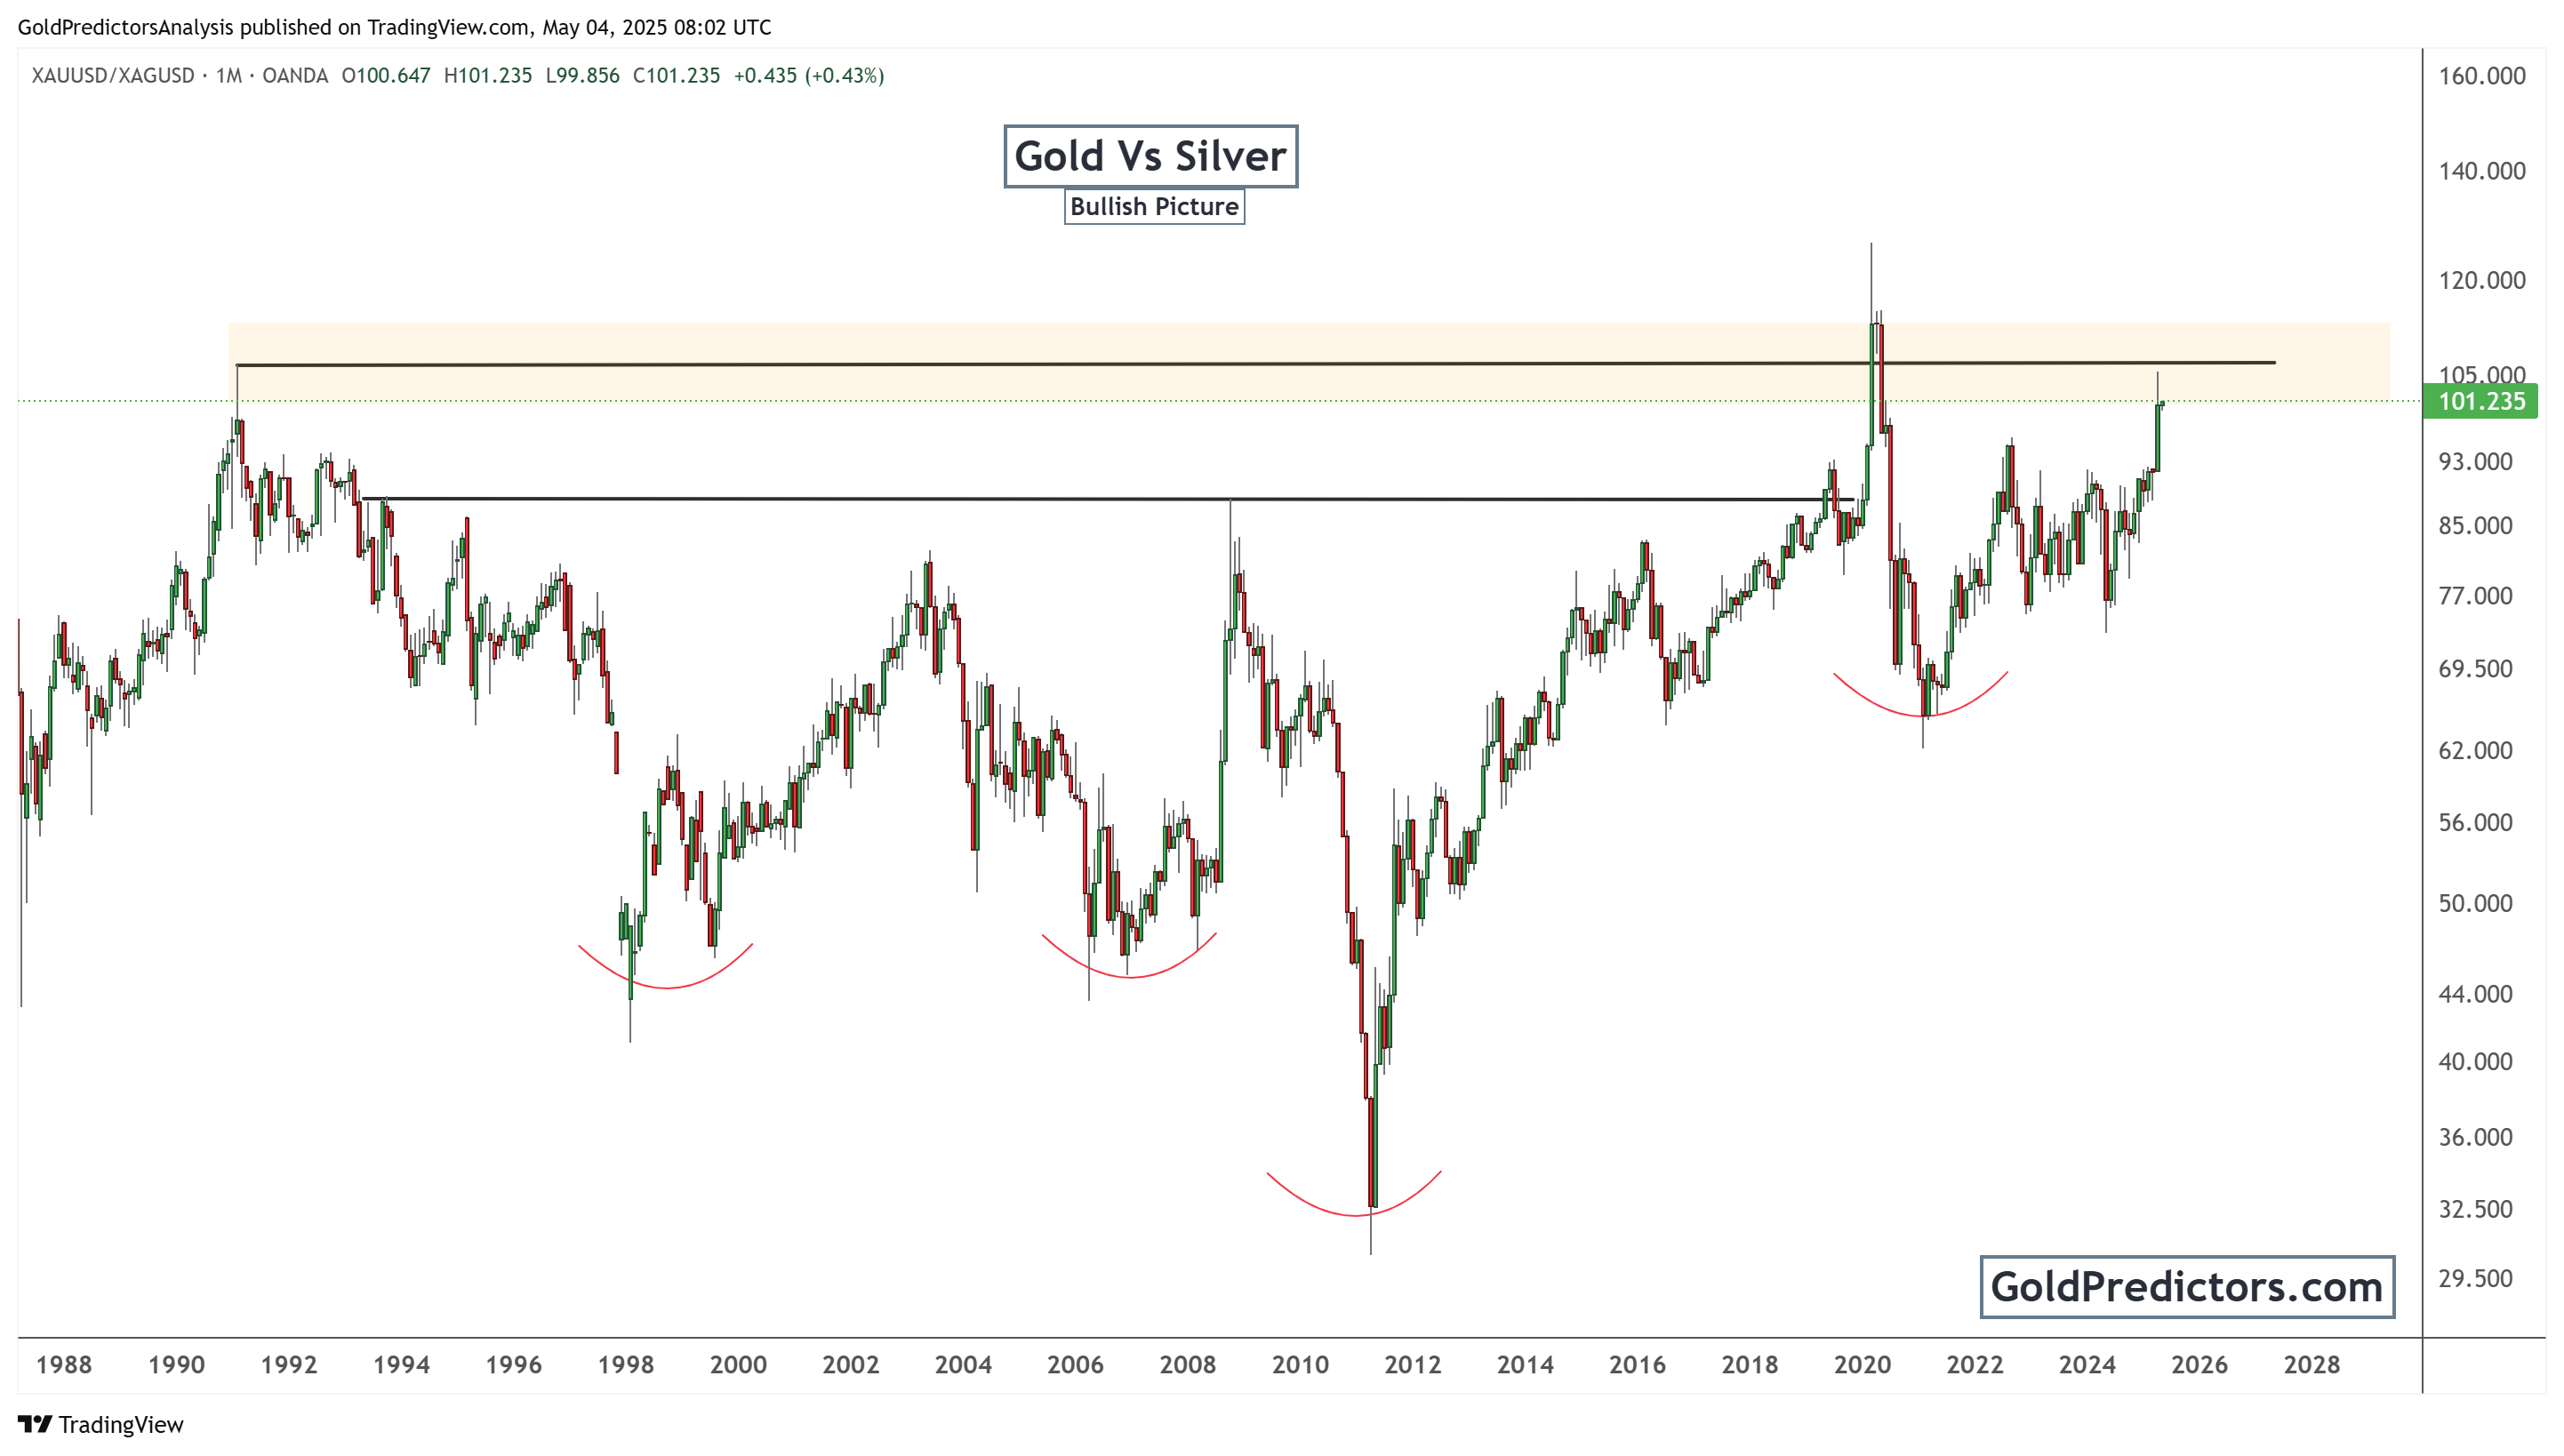
The chart shows that the gold/silver ratio is approaching the key resistance zone between 105 and 120. This level has acted as a ceiling since the 1990s. The ratio is currently at 101.235, moving closer to this historical resistance. Over the decades, this ratio has repeatedly bounced lower after reaching this zone. However, the current setup looks bullish for gold dominance. However, as the ratio approaches a key level, it indicates that the gold rally may pause, and a silver rally could begin.

Conclusion: What Gold’s 2025 Breakout Means for the Future

The breakout in gold prices marks a historic moment for investors. This isn’t a typical rally. It’s a breakout from a multi-decade resistance that has shaped gold’s price for nearly 50 years. The current price above $3,000 reflects strong momentum and growing investor confidence in gold as a hedge against inflation, currency devaluation, and global instability.

In addition, the gold/silver ratio shows continued strength in gold. If the ratio breaks above the 105–120 resistance zone, it could fuel further gains in gold prices while silver lags. Both charts indicate a strong, sustained bullish trend in the precious metals market, with gold leading the way. However, short-term trends show a risk of exhaustion as the price has rallied continuously over the past few months. A short-term correction may present a good opportunity for investors to accumulate.

Gold Predictors Premium Membership

Get exclusive short-term and swing trade ideas with precise entry levels, stop-loss, and target prices, including justification and analysis — all delivered directly via WhatsApp.

Our premium service includes deep technical analysis on gold and silver markets. We cover cycle analysis, price forecasting, and key timing levels.

Members also receive a weekly market letter with detailed analysis, commentary from our Chief Analyst, including actionable insights, trade timing, and direction forecasts for gold and silver.

Stay ahead of the market — join our premium community today.

Premium Membership Trading Performance

Latest Post

Free Articles

Gold Technical Analysis: Cup Patterns Point to Bull Market

Gold’s uptrend since 2024, marked by breakouts, suggests continued gains in 2025, with prices potentially surpassing $3,400 by mid-year …
Read More
June 23, 2025 / admin
Free Articles

Gold Breakout Analysis: Structural Bull Market Targets $4,000

Gold breaks out of a 4-year base, turning resistance into support. With strong momentum above …
Read More
June 22, 2025 / admin
Free Articles

Gold Surge Above $3,400 Amid Iran-Israel Conflict

Gold surge above $3,400 on rising tensions Iran-Israel conflict, driven by an ascending channel and …
Read More
June 13, 2025 / admin
Scientific Trade Strategies

Gold (XAUUSD) Swing Trade Case Study: How $1996 Became a Major Buy Zone

Gold (XAUUSD) offers potential trading opportunities for both traders and investors when executed based on …
Read More
June 8, 2025 / admin
Free Articles

Gold Builds Bullish Momentum as Long-Term Patterns Point To $6,000

Gold begins bull cycle in 2025, backed by strong patterns. With prices near $3,323 and …
Read More
June 3, 2025 / admin
Free ArticlesLong Term SignalsMarket Research Lab

Gold Predictors Celebrates 9 Years: Premium Gold and Silver Analysis with Special Offer

Gold Predictors has marked its 9th anniversary in April 2025 …
Read More
May 28, 2025 / admin

Related posts

gold pattern
June 23, 2025

Gold Technical Analysis: Cup Patterns Point to Bull Market


Read more
gold pattern
June 22, 2025

Gold Breakout Analysis: Structural Bull Market Targets $4,000


Read more
gold pattern
June 13, 2025

Gold Surge Above $3,400 Amid Iran-Israel Conflict


Read more

Comments are closed.

ABOUT US

  • About Us
  • Social Networks
  • Industry Links
  • Testimonials
  • Terms & Conditions

TECHNICAL ANALYSIS

  • Technical Analysis
  • Trend Identification
  • Phase Identification
  • Important Levels
  • Volatility Measurement

CYCLE ANALYSIS

  • Gold Cycle
  • Short Term Cycles
  • Medium Term Cycles
  • Long Term Cycles

PRICE ACTION ANALYSIS

  • Price Action Analysis
  • Phase Identification
  • Historical Pattern Identification
  • Candlestick Pattern Identification
© 2017 Gold Predictors. All Rights Reserved.
  • Remember Me
    Lost your password?
    Dont have an account?Sign Up