


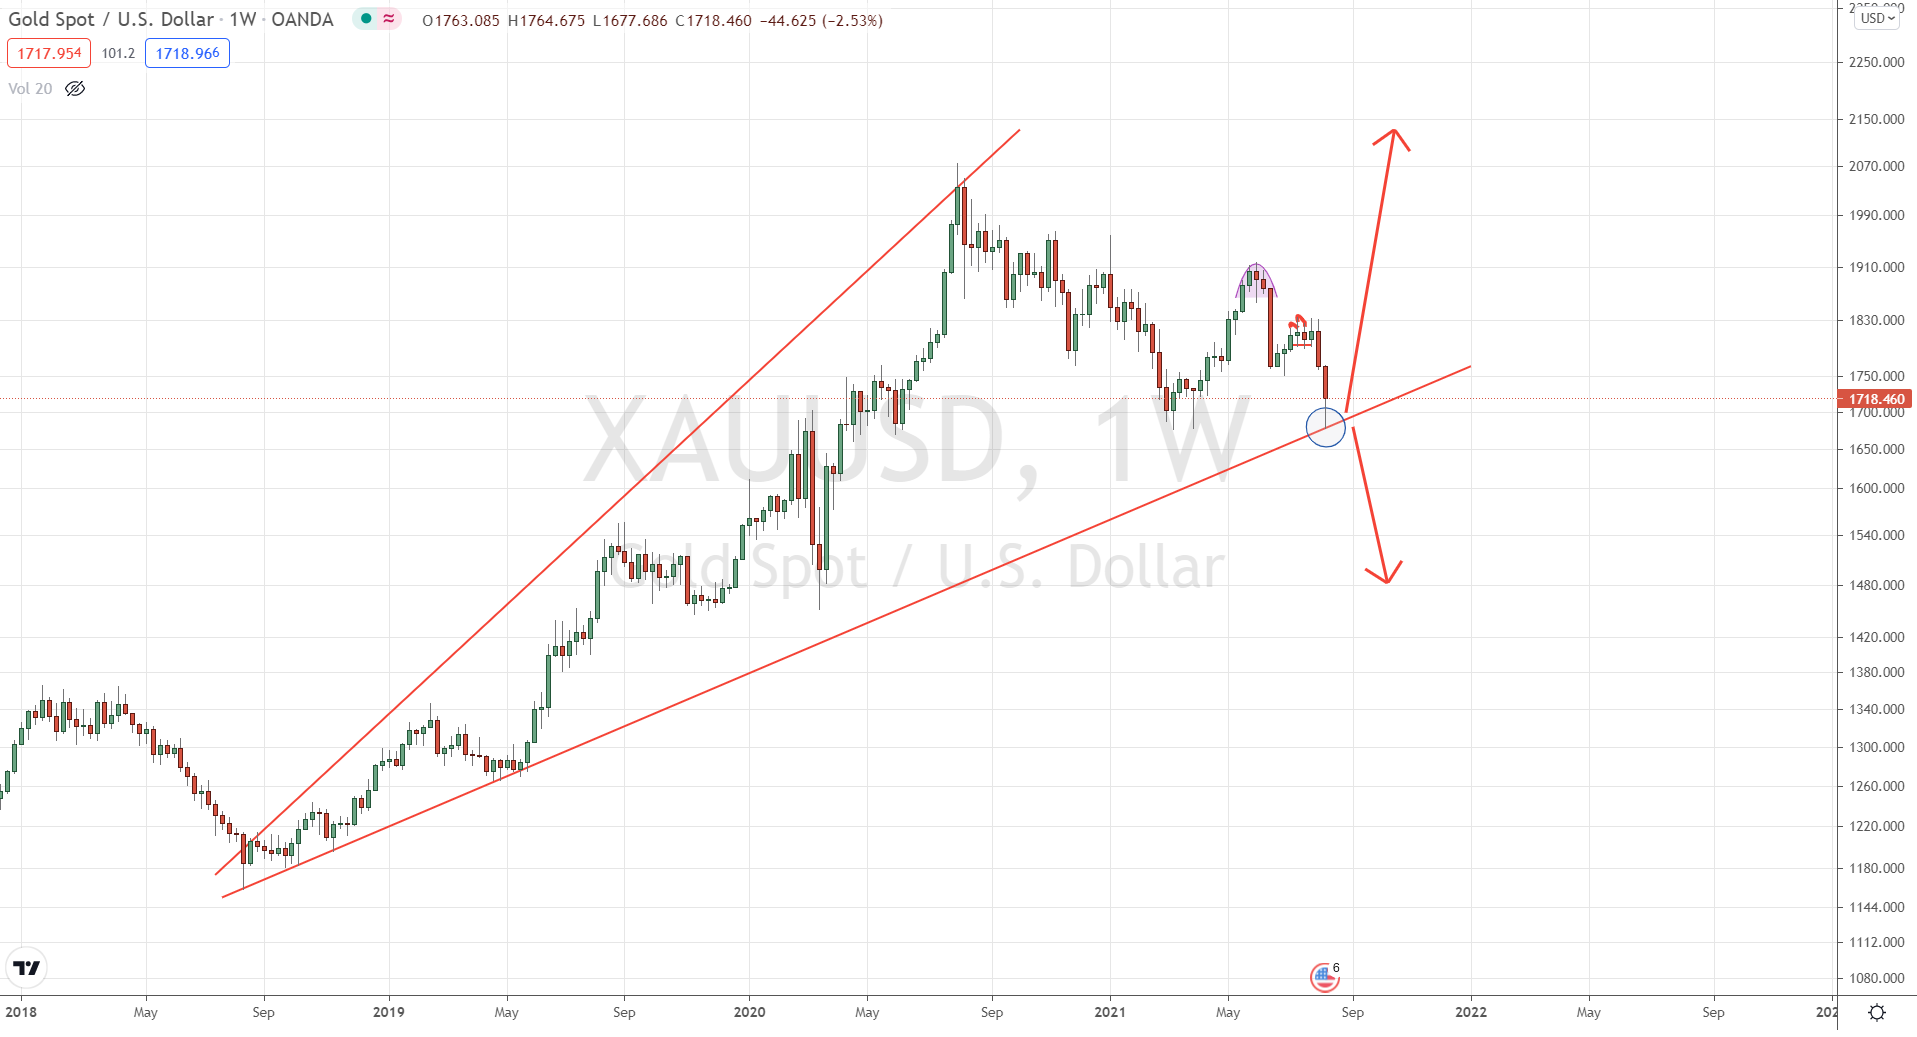
Can Gold Reverse From Inflection Point?
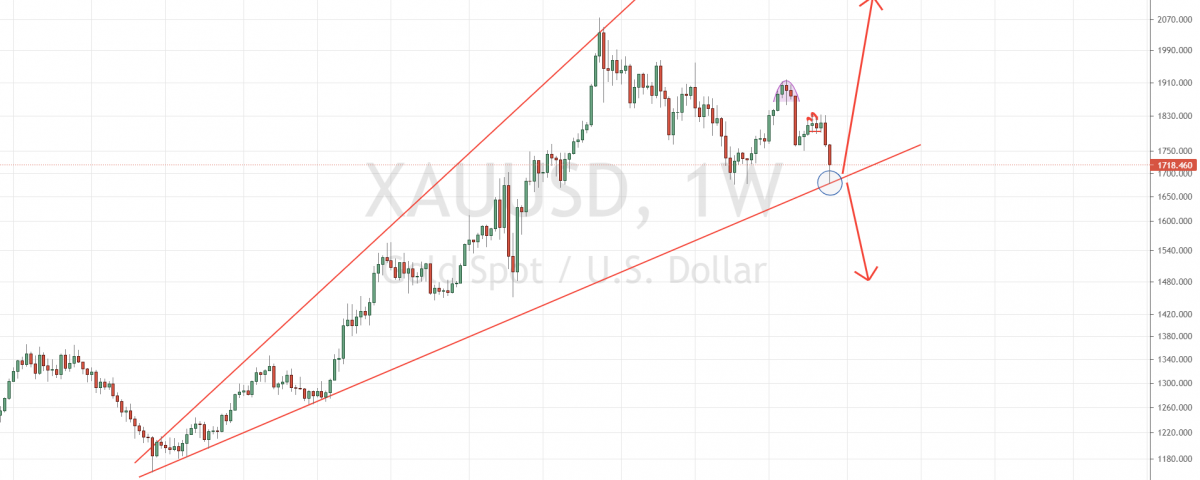
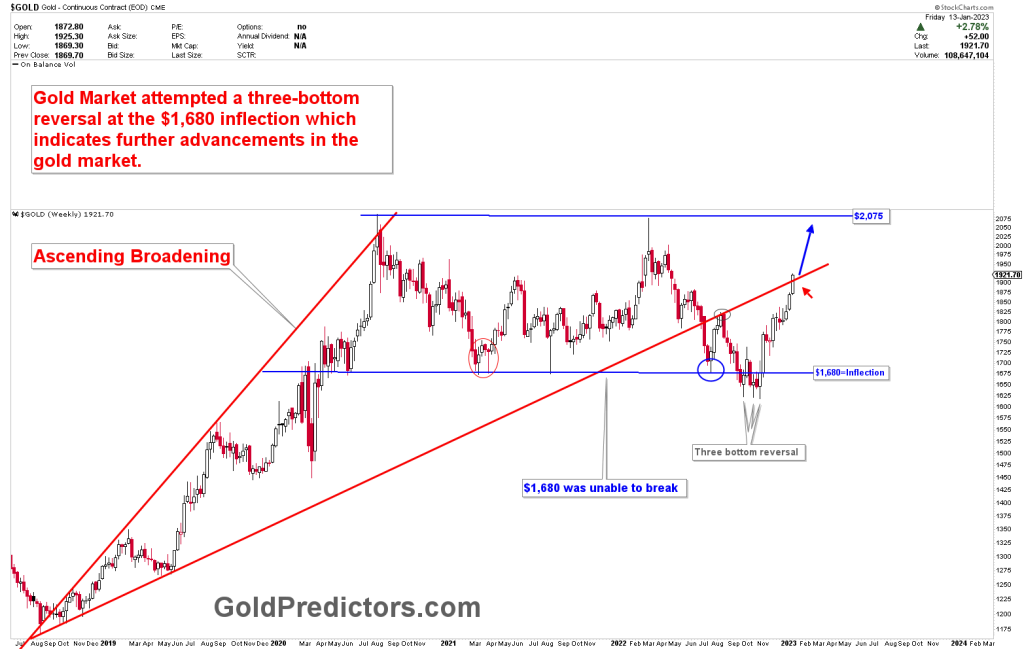
Since the bottom was formed at 1750, we have been discussing the strong resistance of 1825-1835 with an absolute number of 1830. We stated clearly two weeks ago that gold was likely to fall when the transition week was developed. However, the previous week’s report indicated that a break of the 1787 support zone would result in a big sell off. When prices breached 1787, gold was trading at 1760 in a matter of hours. We sent multiple WhatsApp messages just before the Friday close, warning that prices might try to fight 1760 before the close, because the gold market may not be ready to close the weekly candle below 1760. And the end of the week on Friday was 1763. When markets opened on Monday, it dropped from 1760 to 1680 in a matter of minutes, reaching the 2021 inflection point for the second time.
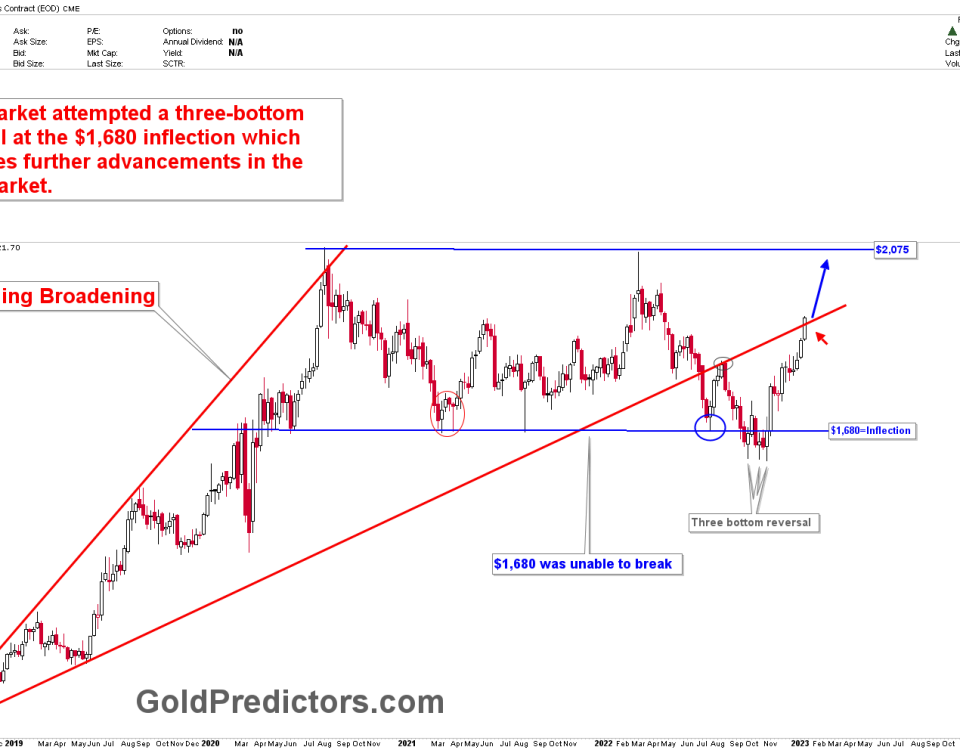
The inflection point of 1680 was measured in March 2021 and indicates strong support for the year. The new price pattern development always identifies the next direction of gold prices. In today’s report, we will discuss how gold and silver may react to this support and what the chances are of holding these mega support zones.
To receive free updates, please register as free member.