The Next Move in Gold is About to Develop

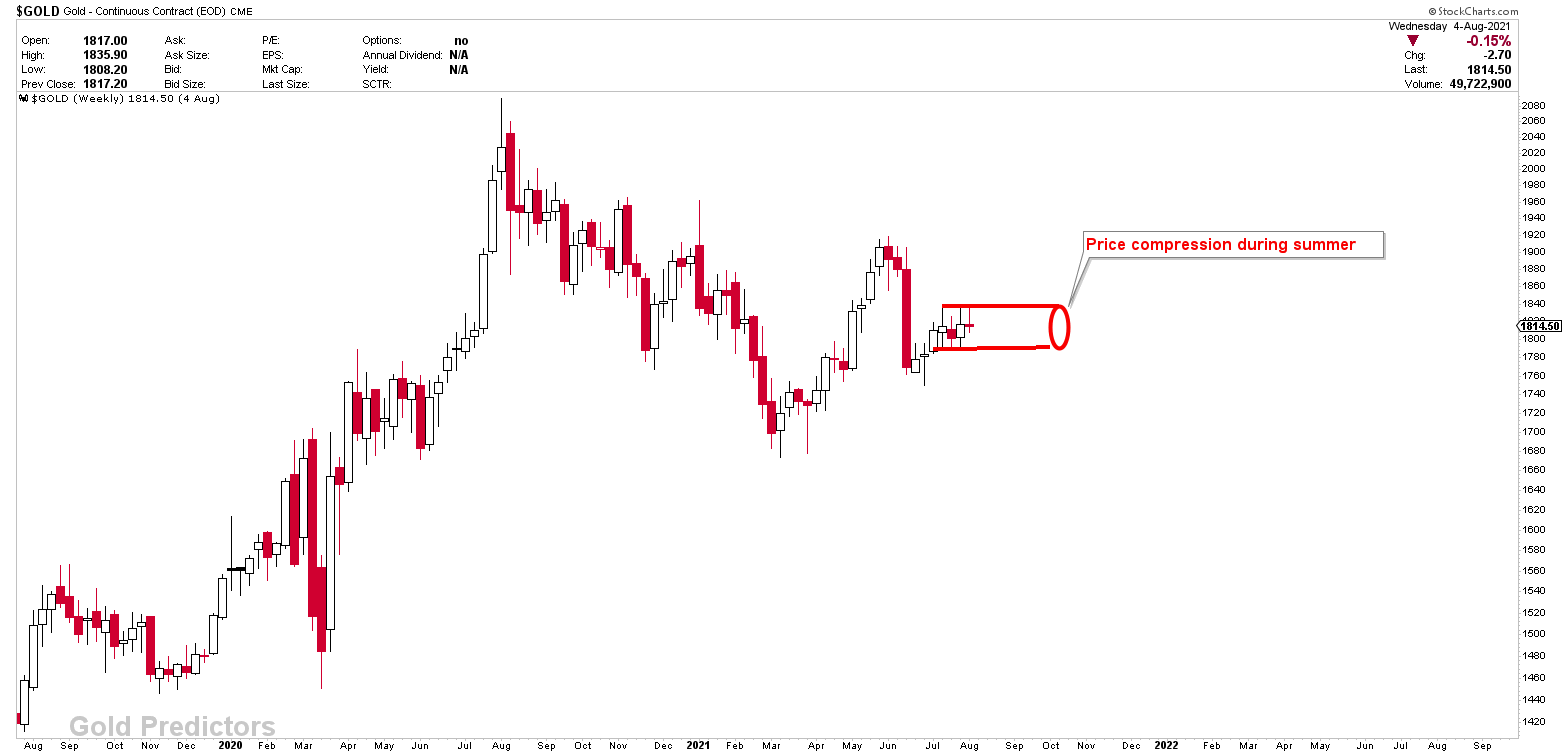
According to our expectations and detailed analysis, spot gold has formed a strong resistance at 1835. Prices have now been trading below this level for three weeks and the next move in gold is about to develop. Before the FOMC meeting last week, the strong support region of 1790-1800 was tested several times. Following the FOMC meeting, prices tested the 1835 level again before falling back to support. We identified 1787 as the pivot point for the last week, stating that any break below 1787 would trigger waterfalls to at least 1750. 1787, on the other hand, was not hit and weekly candle generated different scenarios. Silver falls below the 24.80 support level in order to clear the stops below 24.50, but then reverses and closes above the 24.80 level.
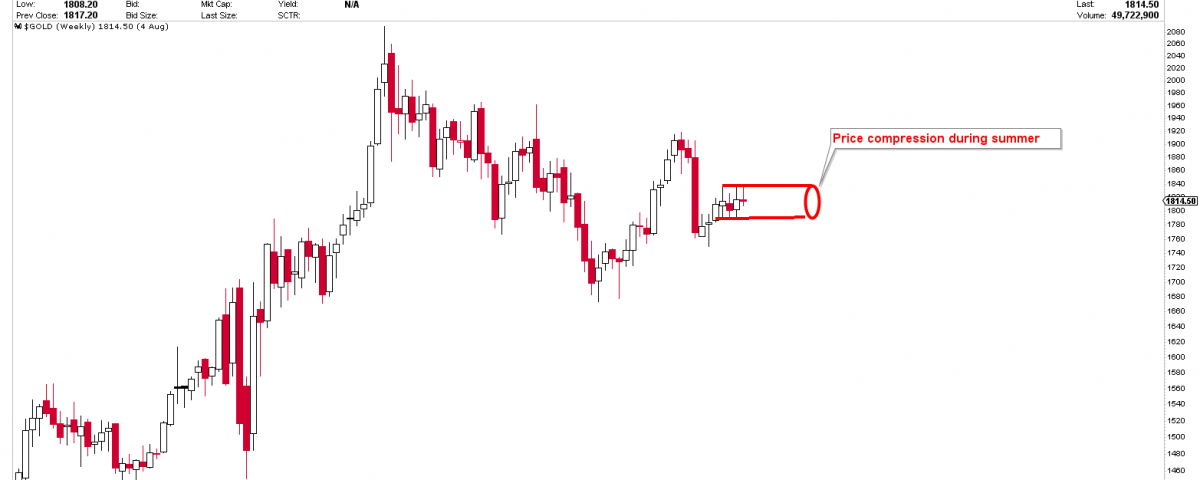
On the weekly chart, gold has produced a double coiling effect, while silver has produced a weekly reversal candle right at the ascending triangle. Before concluding the analysis, a few factors must be investigated. In today’s report, we will look at the next move in gold, which is expected to occur in August.

To receive free updates, please register as free member.


