Gold vs Treasury Yields: Can Gold Recover despite Elevated Yields?
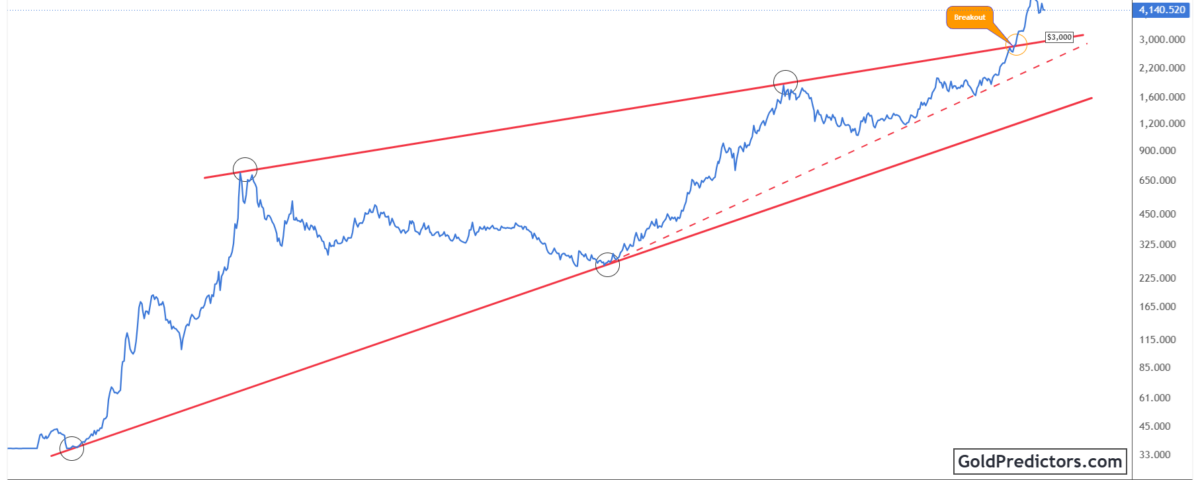
Gold (XAU/USD) continues to consolidate after its sharp correction from the record area. The Price remains well above the former resistance boundary of its multi-decade rising structure. This keeps the broader breakout intact, although recent weakness calls for caution. Meanwhile, the Gold versus US 10-year Treasury yield ratio has declined toward an important support reference after rejecting upper resistance. Gold could regain momentum if it builds a firmer base and the ratio holds above this level.
Gold Market Outlook: Weak Jobs Data Reduce October Rate Hike Expectations
The latest gold market outlook centers on whether weaker hiring will persuade the Federal Reserve to pause further rate increases. The US employment report released on October 2 showed that September payrolls rose by 29,000, below expectations of 90,000. August’s increase was revised down to 133,000, while unemployment rose to 4.2% from 4.1%. After the report, October rate-hike expectations stood around 23%. These figures strengthen the case for a pause because another increase could add pressure to a slowing labor market.
However, gold still faces pressure from high Treasury yields. The benchmark 10-year yield closed Friday near 5.28%, while another Fed increase later this year remains possible. Inflation risks leave policymakers balancing slower hiring against elevated prices. For gold, this creates a mixed backdrop. A pause could ease expectations for further tightening, but long-term yields may remain high even if the Fed holds rates steady. If yields keep falling, investors would give up less interest income by holding gold, which could increase demand.
Gold Price Analysis: Major Breakout Holds after the Sharp Correction
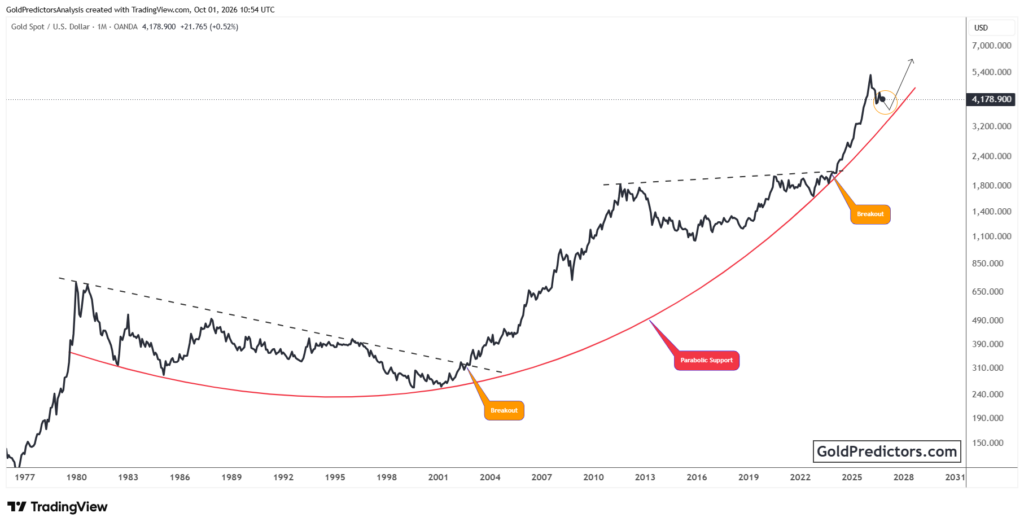
The gold chart below shows a breakout above the upper boundary of a multi-decade rising structure. This boundary limited gold’s gains during earlier market cycles. Gold then rallied well above it before pulling back from its record high. The monthly chart places gold near $4,140, still well above the former resistance boundary around $3,000.
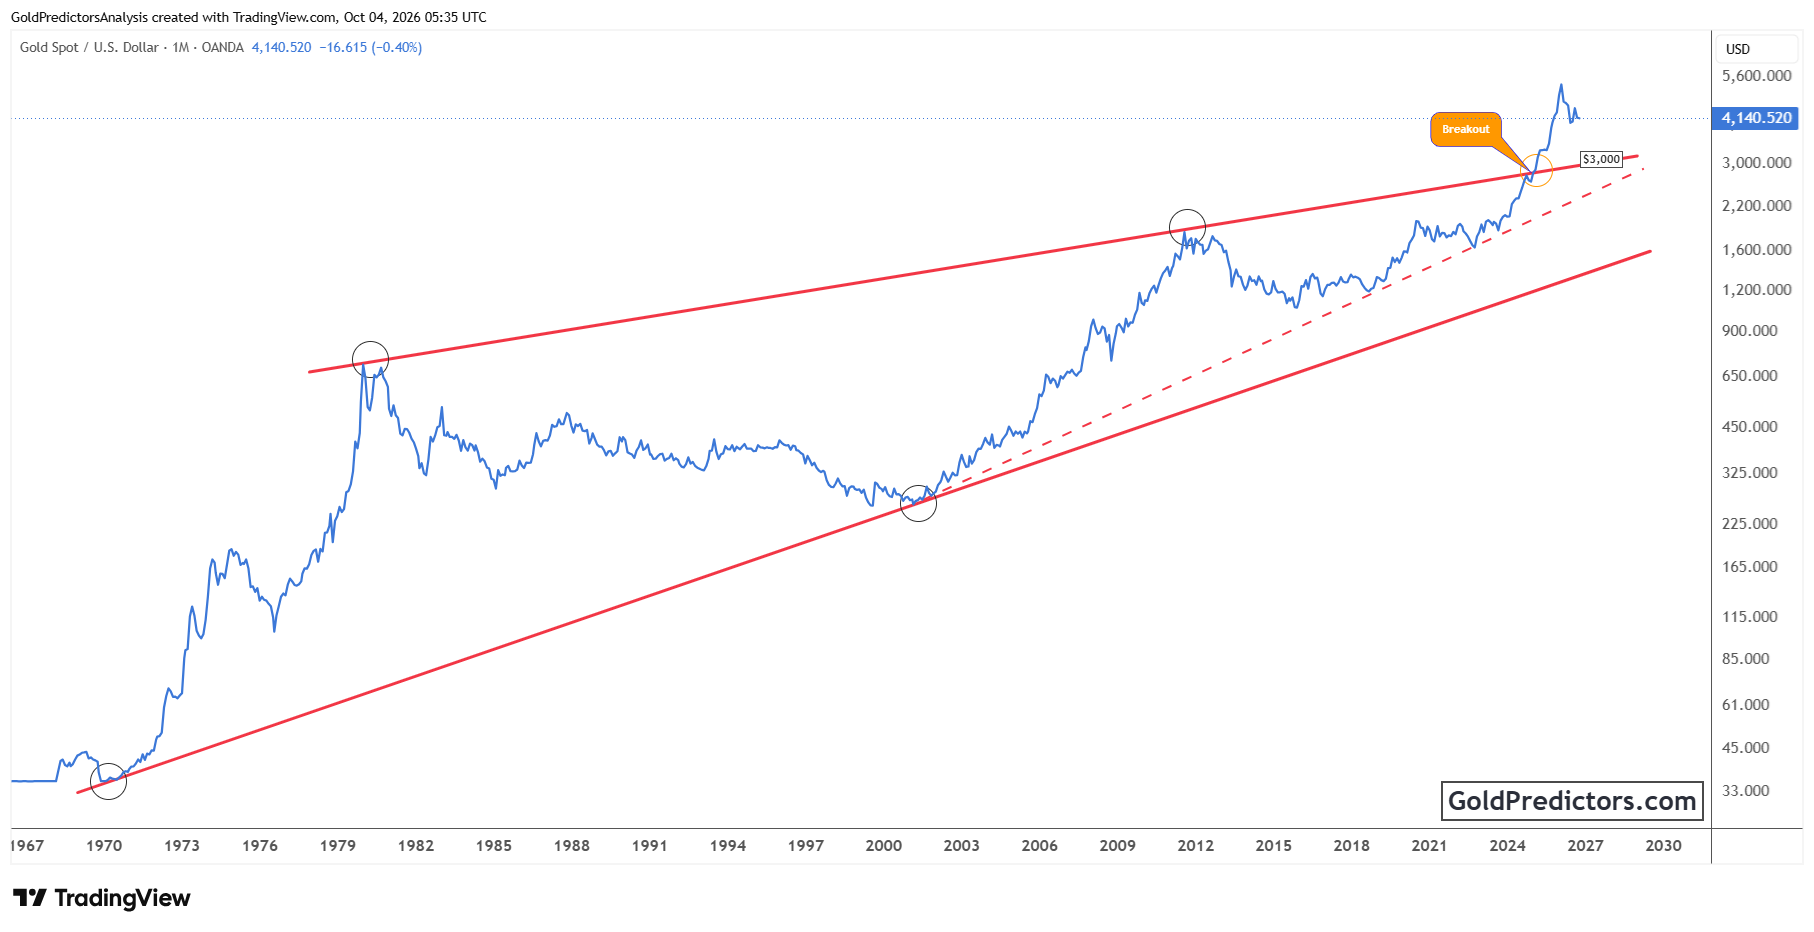
The correction has weakened momentum, but gold remains above the breakout boundary. This keeps the broader breakout intact. Gold now needs to build a firmer base after its rapid rally. Higher monthly lows would suggest that support is strengthening and gold is building a firmer base.
The monthly gold price outlook leaves room for further consolidation while the major breakout remains intact. A stable base could help gold regain momentum and move toward its record high. However, further weakness could extend the correction and delay that move. The rising boundary near $3,000 remains an approximate support reference for assessing the strength of the broader breakout.
Gold versus Treasury Yields Ratio Nears Support after a Sharp Decline
The chart below shows a broadening pattern in the Gold/US10Y ratio, with several lows forming near its lower support band. The ratio has fallen to around 785 after turning lower from resistance near 1,450. It is now approaching support at 700, which marked an earlier breakout. The ratio remains above this level, but it has yet to show a clear reversal.
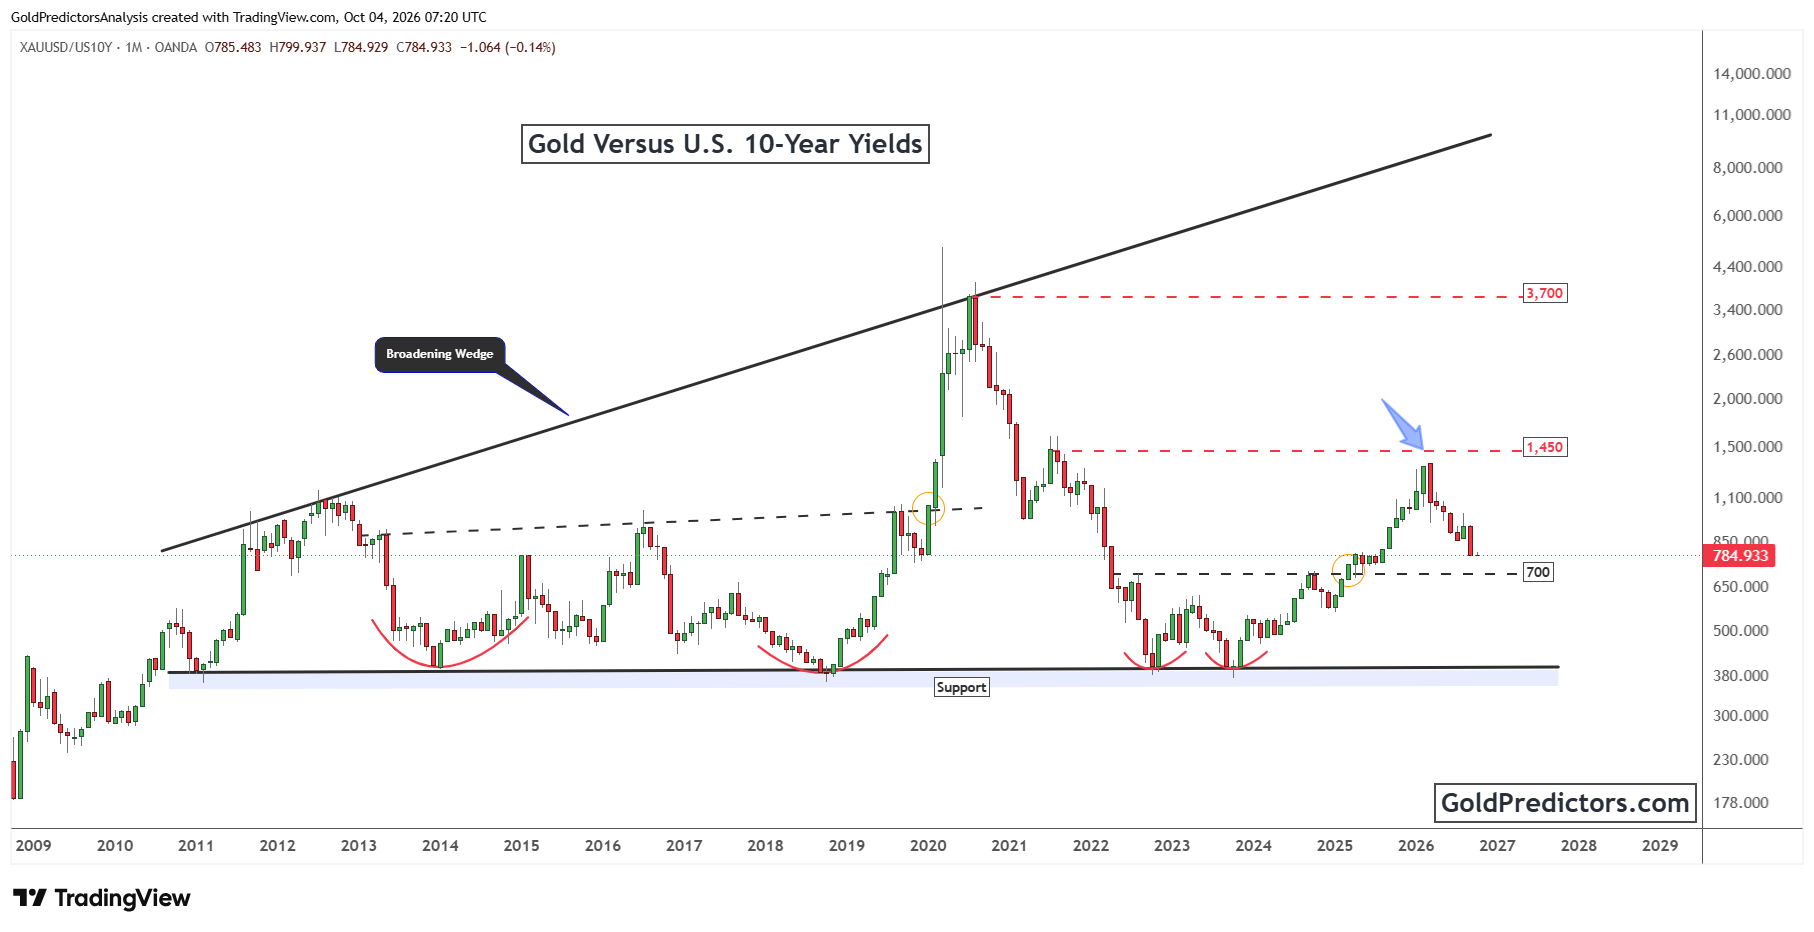
The ratio measures gold’s price relative to the nominal US 10-year Treasury yield. Its decline can reflect weaker gold prices, higher yields, or both. Equally, falling yields can lift the ratio even when gold’s price stays steady. Comparing the ratio with gold’s own price chart helps explain what is driving the move and gives a clearer picture of gold’s position.
Holding above 700 and forming a stable base would suggest that the pullback is easing. A sustained rise toward resistance near 1,450 would provide clearer evidence of a recovery. However, a monthly close below 700 would weaken the earlier breakout and shift attention to the lower support band near 380–400. These levels apply to the ratio and help assess gold’s performance relative to Treasury yields.
Gold Price Outlook: Weak Hiring and High Yields Keep Recovery Conditional
Gold’s broader price outlook remains cautiously constructive because the major breakout is intact. Weak US hiring supports the case for an October Fed pause, while high Treasury yields continue to limit the fundamental support for gold. The key technical issue is whether the Gold/US10Y ratio holds 700 as gold builds a firmer base above its former resistance boundary. Stability in both structures would strengthen the outlook. Further weakness would increase the risk of a prolonged correction.
Gold Predictors Premium Membership
Get exclusive short-term and swing trade ideas with precise entry levels, stop-loss, and target prices, including justification and analysis — all delivered directly via WhatsApp.
Our premium service includes deep technical analysis on gold and silver markets. We cover cycle analysis, price forecasting, and key timing levels.
Members also receive a weekly market letter with detailed analysis, commentary from our Chief Analyst, including actionable insights, trade timing, and direction forecasts for gold and silver.
Stay ahead of the market — join our premium community today.