


Gold Breaks Out of Decade-Long Pattern as Gold-to-GDX Ratio Hits Pivotal Support
Gold (XAUUSD) has confirmed a significant breakout from a long-developing cup and handle formation, marking a structural shift in its long-term trend. The move above the $2,100 resistance zone in 2024 ended a decade of consolidation and triggered a strong upside move. At the same time, the Gold-to-GDX ratio reveals a continued divergence between gold and mining stocks, with miners underperforming despite gold’s breakout. As the ratio approaches a key support zone, upcoming price action could determine whether miners begin to recover or continue lagging behind gold.
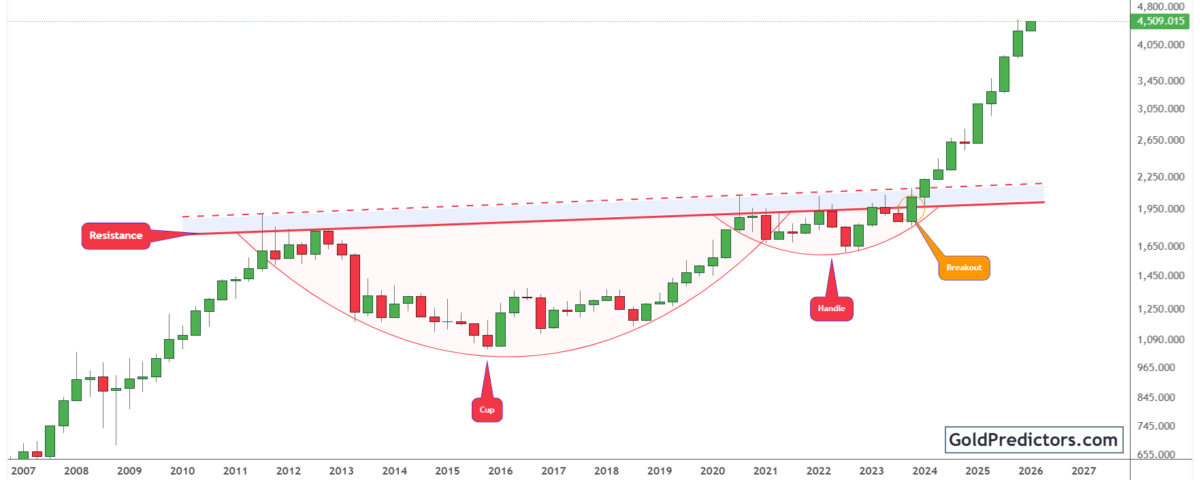
Gold Clears Multi-Year Resistance with Classic Cup and Handle Breakout
The gold chart below shows a decisive breakout from a multi-year cup and handle formation. This structure began developing after gold’s peak in 2011, followed by an extended consolidation phase that formed the cup between 2011 and 2020. As price gradually compressed, a smaller handle developed between 2020 and 2023, marked by narrowing ranges and reduced volatility.
Gold broke out in late 2024 after clearing the key resistance zone between $2,100 and $2,200. This level had held firm for over a decade, rejecting multiple rallies. Once breached, momentum accelerated quickly, confirming the pattern and signaling a major shift in gold’s long-term structure. This decisive move marked a structural turning point, opening the door for sustained upside in the years ahead.
Historically, cup and handle patterns have triggered sustained price expansions. A breakout of this scale typically leads to meaningful long-term gains. The depth and duration of the base formation suggest strong potential for continued upside. This combination of technical structure and time-tested breakout behavior supports the case for a durable, long-term advance.
Gold-to-GDX Ratio Tests Critical Support After Trendline Breakdown
The chart below shows the Gold-to-GDX ratio, highlighting a sharp divergence between gold and mining stocks. While gold surged to record highs, mining equities lagged behind for years, causing the ratio to rise significantly. However, recent price action shows a reversal, with the ratio now breaking below the rising trendline that had supported the structure since 2010. This breakdown signals a shift in relative strength, as miners begin to outperform gold after a prolonged period of underperformance.
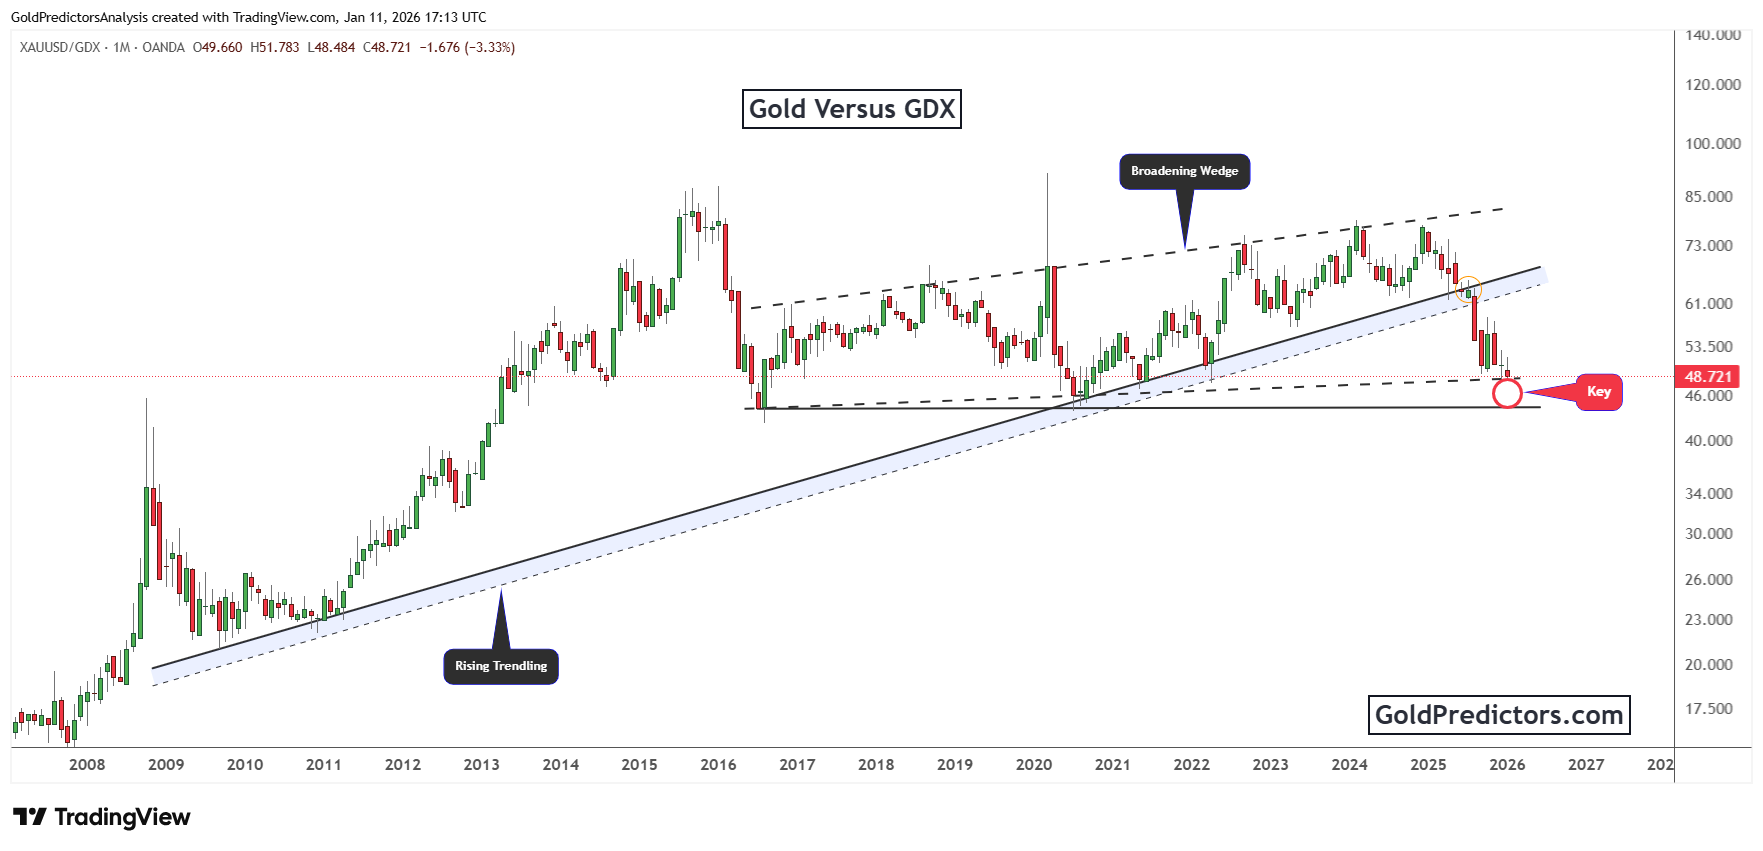
Technically, the ratio formed a broadening wedge between 2016 and 2024. After multiple rejections near the wedge top, the ratio failed to hold its uptrend and ultimately broke below the rising trendline. The recent decline brought the ratio back to a critical horizontal support zone that has acted as a major floor since 2016.
This key support zone now serves as an inflection point. If the ratio holds above this support, it may suggest that miners are still lagging behind gold. However, a sustained breakdown below this level would point to improving relative strength in mining equities after years of underperformance. The next few monthly closes will be crucial in confirming whether this support will hold or give way.
Conclusion: Gold Confirms Structural Bull Market as Miners Reach Inflection Point
Gold has entered a new structural bull market after breaking above its long-standing resistance. The cup and handle formation, which took over a decade to develop, now confirms a major trend reversal. This breakout sets the stage for long-term price expansion backed by both technical structure and macro drivers.
At the same time, the Gold-to-GDX ratio remains elevated, reflecting miners’ ongoing underperformance. The recent decline brought the ratio to a key support zone. This level has marked several important turning points since 2016 and now serves as a critical area to watch. A decisive move from this zone could determine whether miners begin to recover or continue lagging behind gold.
These signals reflect a deeper transition taking shape across the precious metals sector. Gold leads with a confirmed breakout, supported by strong macro and technical alignment. If the ratio continues lower, it would reflect improving relative strength in miners and broader participation across the sector.
Gold Predictors Premium Membership
Get exclusive short-term and swing trade ideas with precise entry levels, stop-loss, and target prices, including justification and analysis — all delivered directly via WhatsApp.
Our premium service includes deep technical analysis on gold and silver markets. We cover cycle analysis, price forecasting, and key timing levels.
Members also receive a weekly market letter with detailed analysis, commentary from our Chief Analyst, including actionable insights, trade timing, and direction forecasts for gold and silver.
Stay ahead of the market — join our premium community today.


