


Gold Price Breakout 2025: Long-Term Patterns Point to $4,000 and Beyond
Gold surged in 2025 to reach a historic milestone above $3,200. This surge is not just a short-term spike but the result of a long-term consolidation pattern that has finally resolved to the upside. The technical outlook for gold shows bullish patterns that have driven this breakout. These patterns suggest a sustained bullish trend for the gold market in 2025. This article discusses these patterns that can lead to higher prices in gold.
Gold Price Surges in 2025 After Decade-Long Ascending Triangle Breakout
The gold chart below shows a massive ascending triangle formation that lasted nearly a decade. The pattern began forming in 2015, with the horizontal resistance level sitting near the $2,070 zone and a rising trend line acting as consistent support. This formation represents accumulation over time, where each dip formed higher lows, signaling growing bullish pressure.
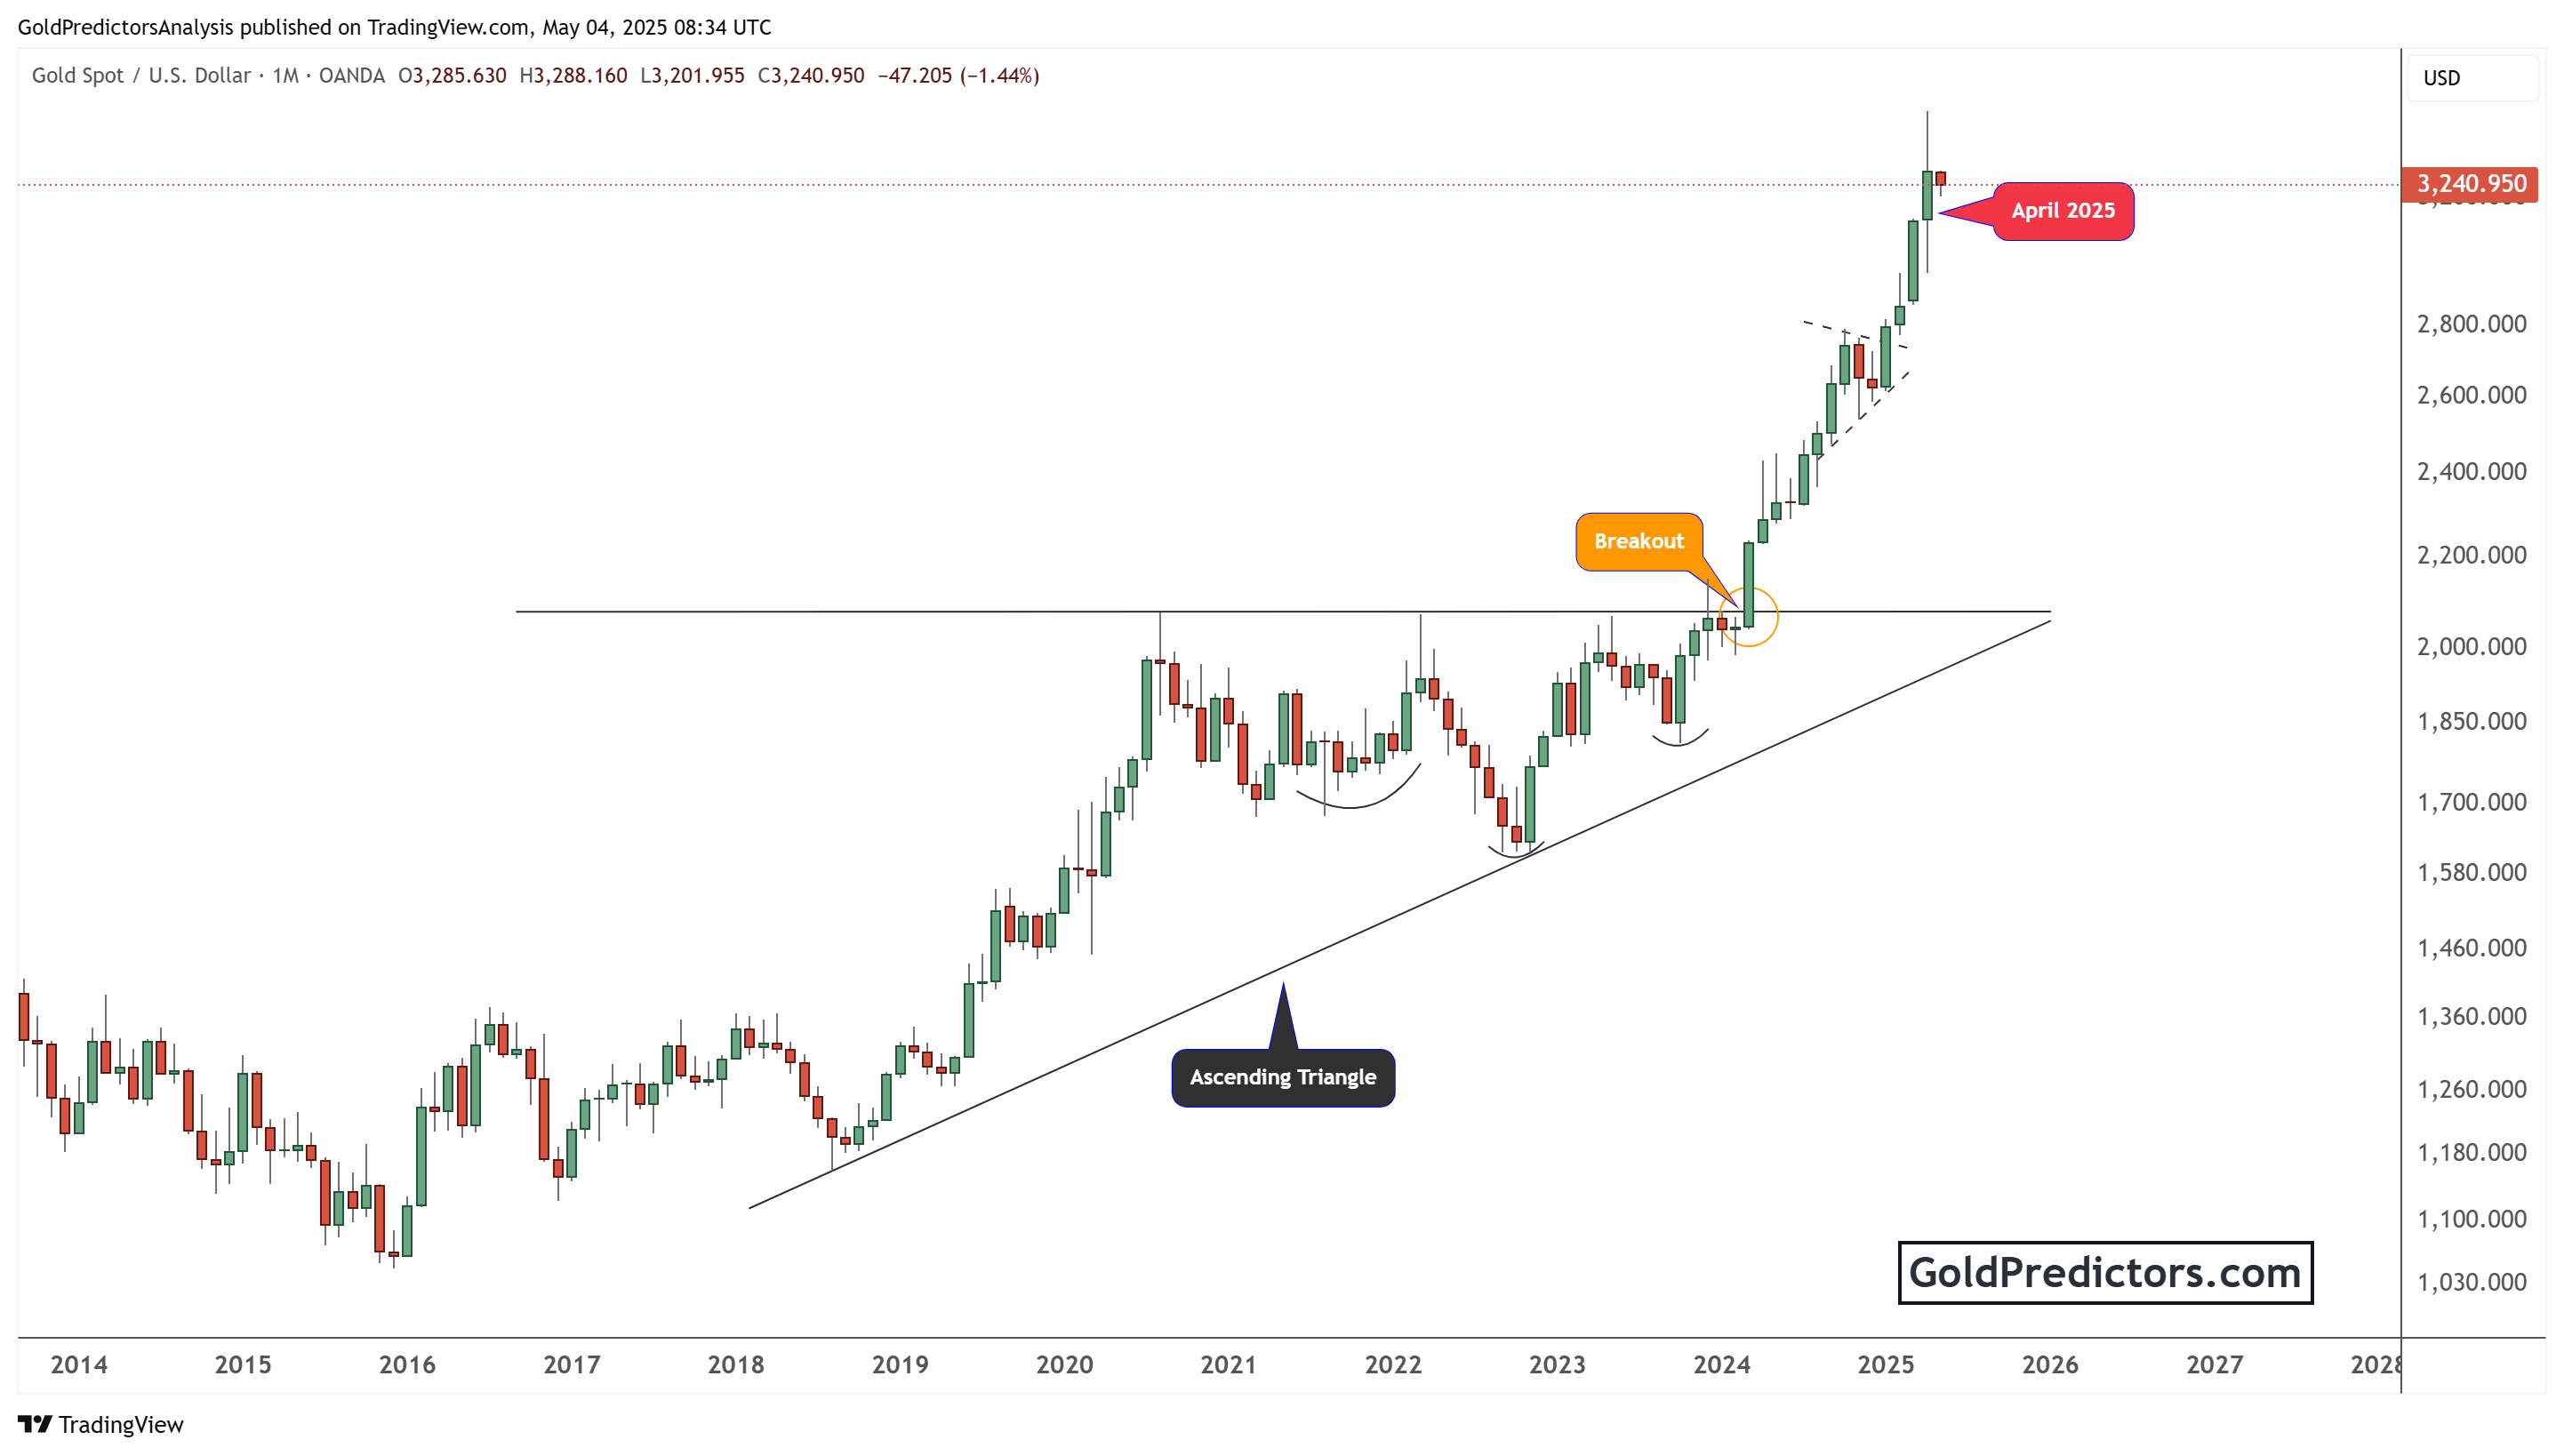
The breakout occurred in 2024 when gold surged past the $2,070 resistance, supported by substantial volume and momentum. This technical event marked the beginning of a powerful uptrend. After the breakout, the price continued to accelerate, with gold reaching as high as $3,500 in April 2025 before pulling back to $3,200.
The ascending triangle is a classic continuation pattern. Its breakout target is typically calculated by adding the triangle’s height to the breakout point. In this case, the vertical height was about $1,000, suggesting a long-term target near $3,100–$3,200, which has now been achieved. However, the breakout above $3,200 has opened the door for much higher levels in the gold price. The price behavior confirms the pattern’s validity and strengthens the case for a sustained bull market.
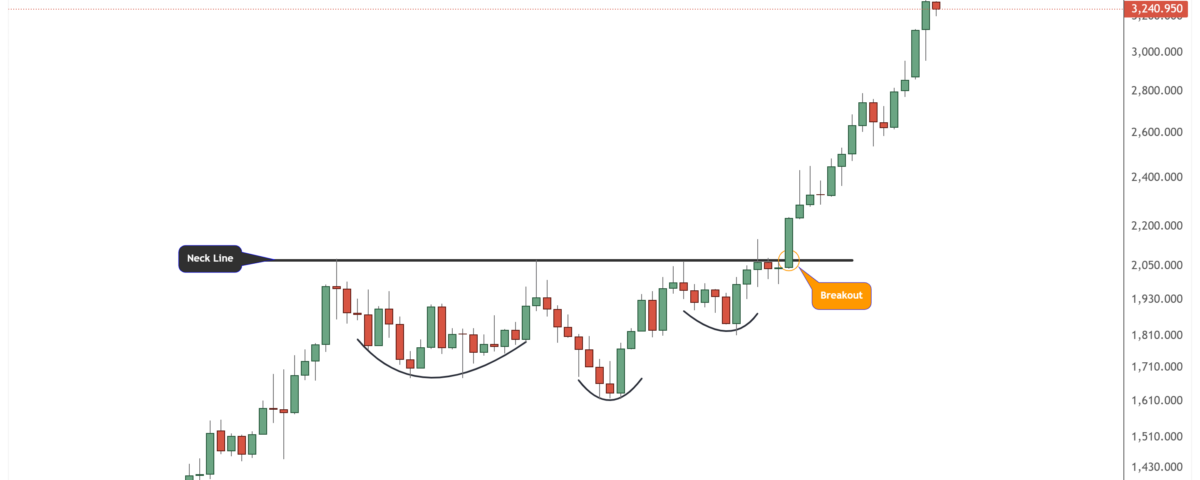
Inverted Head and Shoulders Pattern Confirms Bull Market for Gold in 2025
The gold chart shows another bullish confirmation—a multi-year inverted head-and-shoulders pattern. This formation appeared after the 2020 highs and includes a left shoulder in late 2020, a head in 2022, and a right shoulder in 2023. The neckline was drawn near the $2,075 level, aligning with the resistance of the ascending triangle in the above chart.
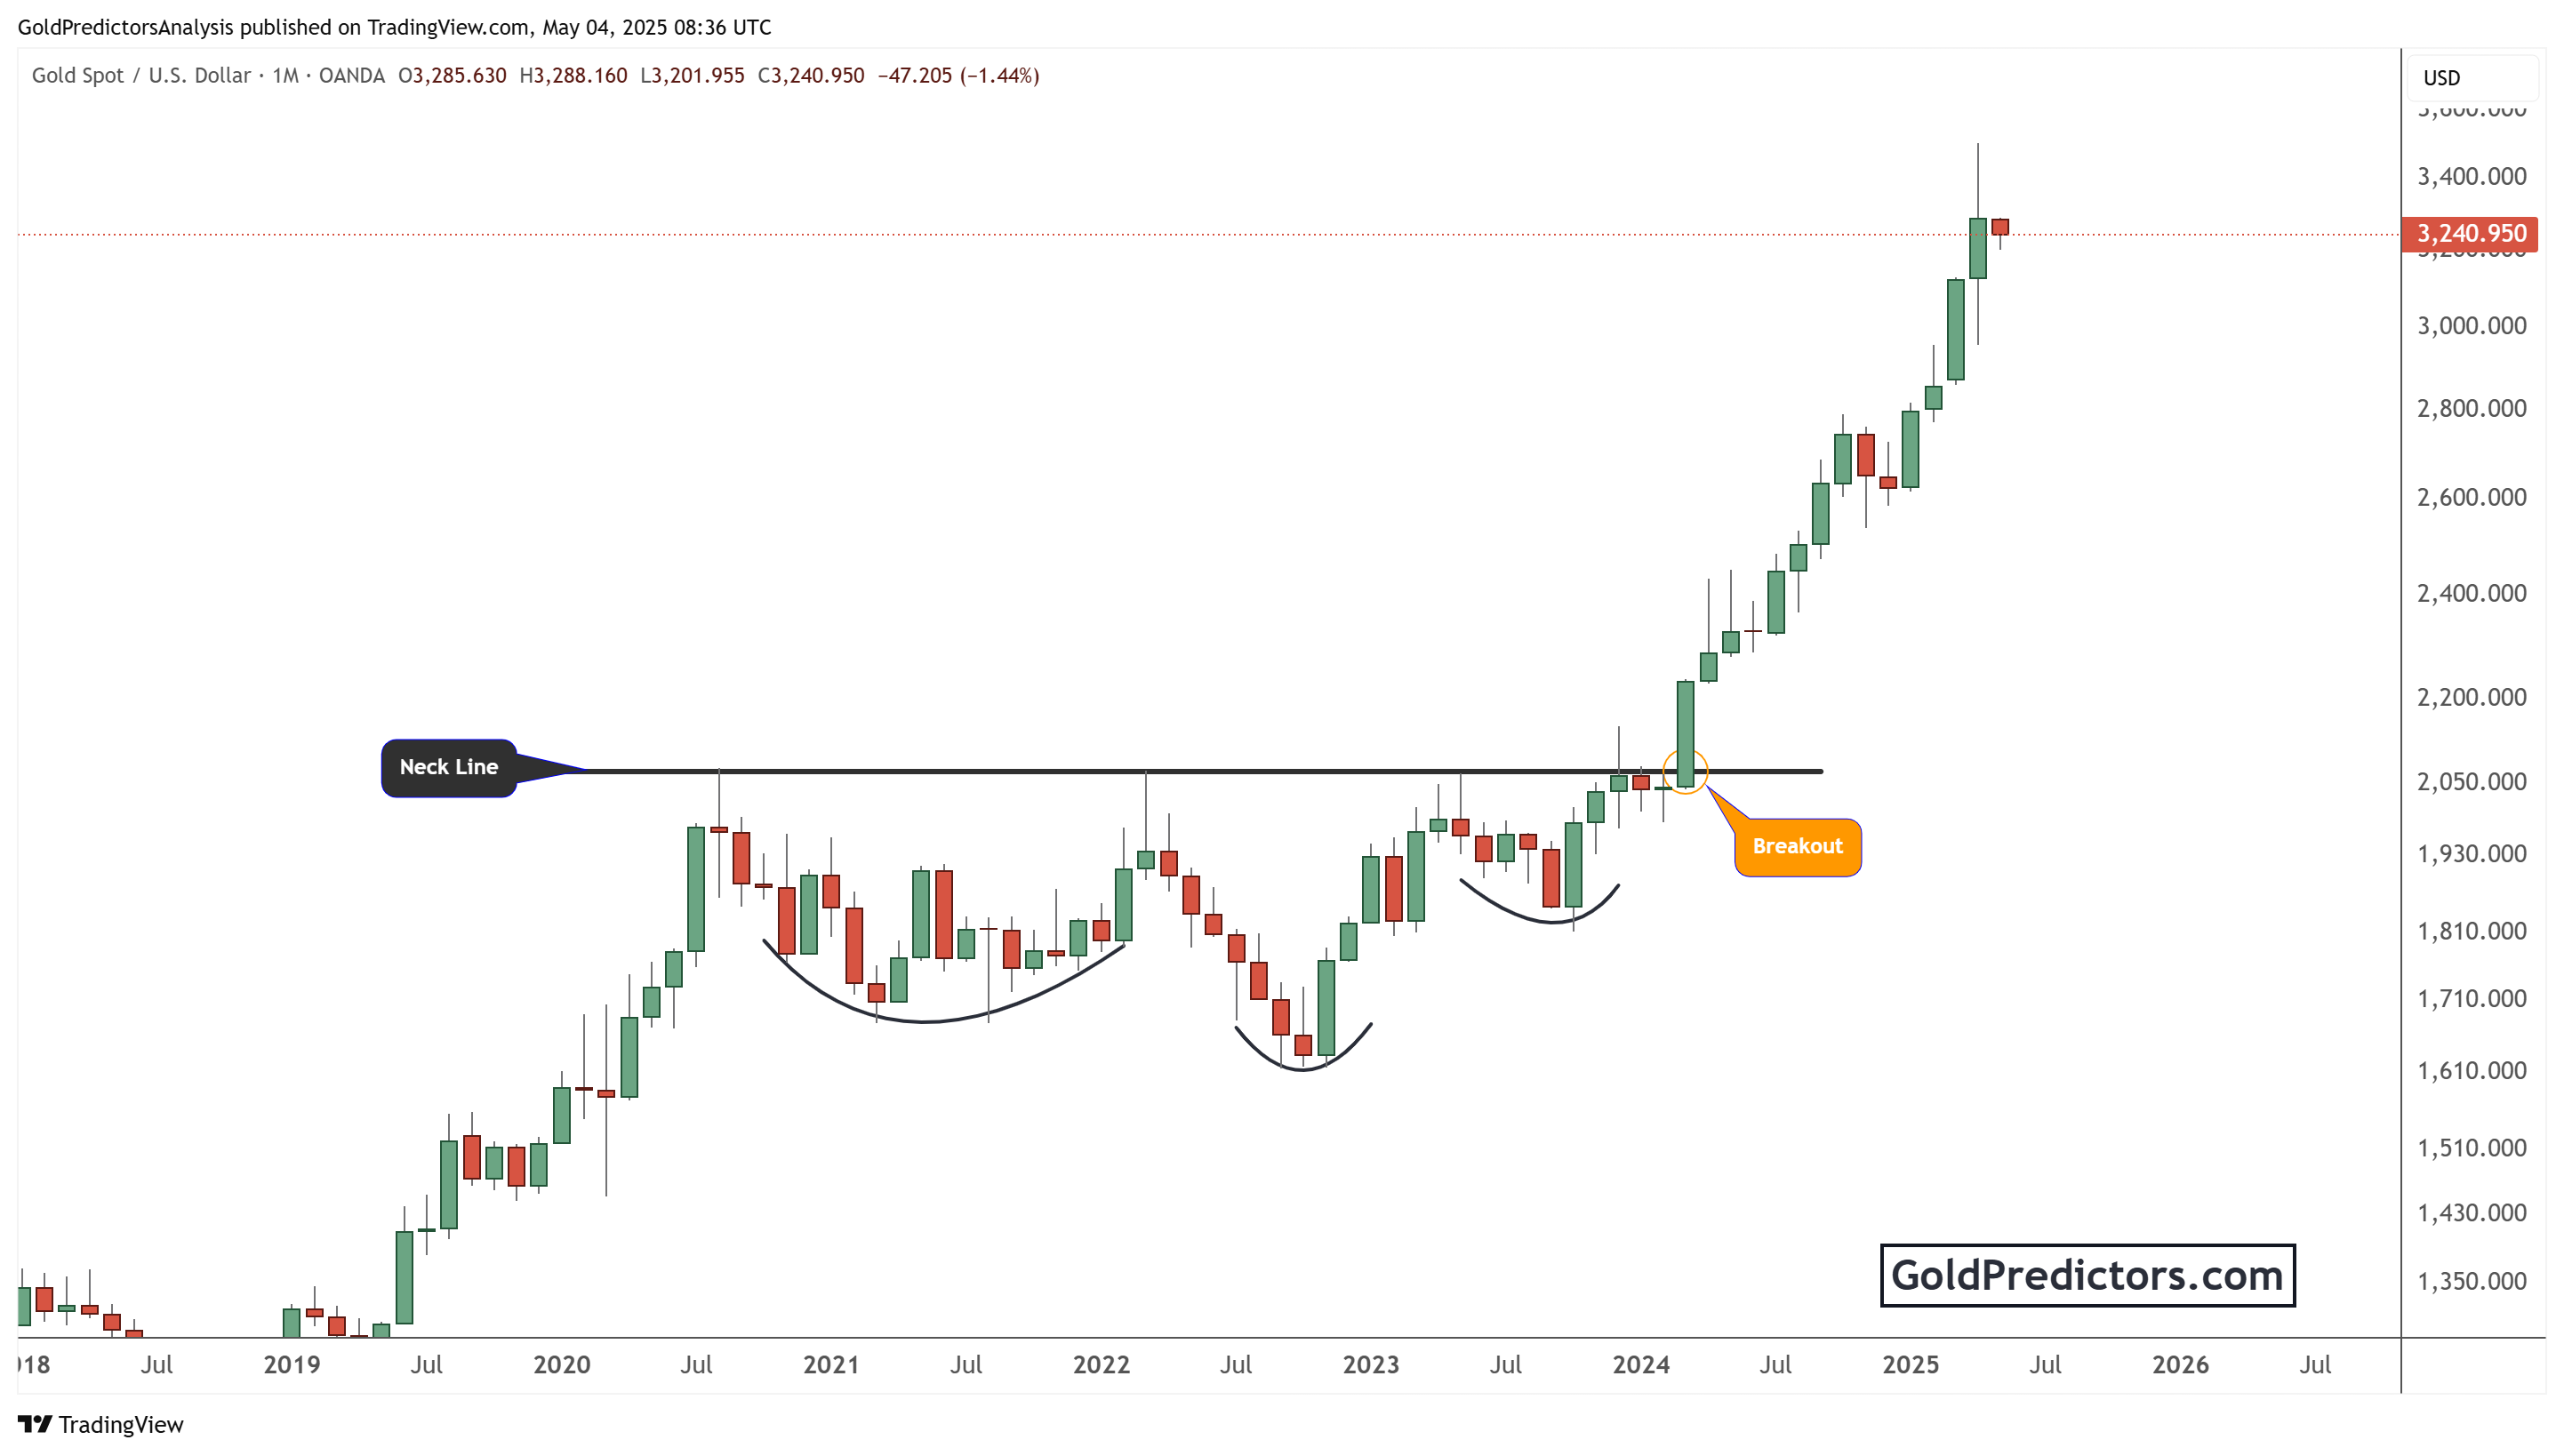
The breakout above the neckline in early 2024 reinforced the bullish bias. Inverted head and shoulders patterns often appear at market bottoms, indicating a significant reversal. This particular setup formed over several years, adding to its reliability. Once gold broke above the neckline, it quickly gained momentum, forming several bullish monthly candles and pushing prices above $3,200.
This dual-pattern alignment is rare. When multiple strong technical structures break out simultaneously, the results are often explosive. This is precisely what is being witnessed in the gold market in 2025.
Gold Outlook 2025: What the Breakout Above $3,200 Means for Future Price Targets
Gold’s breakout above $3,200 is more than just a number—it confirms a multi-year bullish setup. The ascending triangle and inverted head-and-shoulders pattern signal that this rally is not temporary. The breakout zone around $2,075 is now strong support, providing a solid base for future gains.
Investors should view this breakout as the start of a new bullish era for gold. As inflation concerns persist, central banks continue accumulating gold. With global economic uncertainty remaining, the yellow metal stands to benefit further. If current momentum holds, the following targets could be $4,000 and beyond over the medium to long term.
In summary, gold’s price action reflects technical strength, long-term accumulation, and market confidence. This historic breakout could define the next phase of gold’s journey. A break above $3,500 will set the stage for the next move to the $4,000 and $6,000 area.
Gold Predictors Premium Membership
Get exclusive short-term and swing trade ideas with precise entry levels, stop-loss, and target prices, including justification and analysis — all delivered directly via WhatsApp.
Our premium service includes deep technical analysis on gold and silver markets. We cover cycle analysis, price forecasting, and key timing levels.
Members also receive a weekly market letter with detailed analysis, commentary from our Chief Analyst, including actionable insights, trade timing, and direction forecasts for gold and silver.
Stay ahead of the market — join our premium community today.


