


Gold Rally Is Just The Beginning In 2024
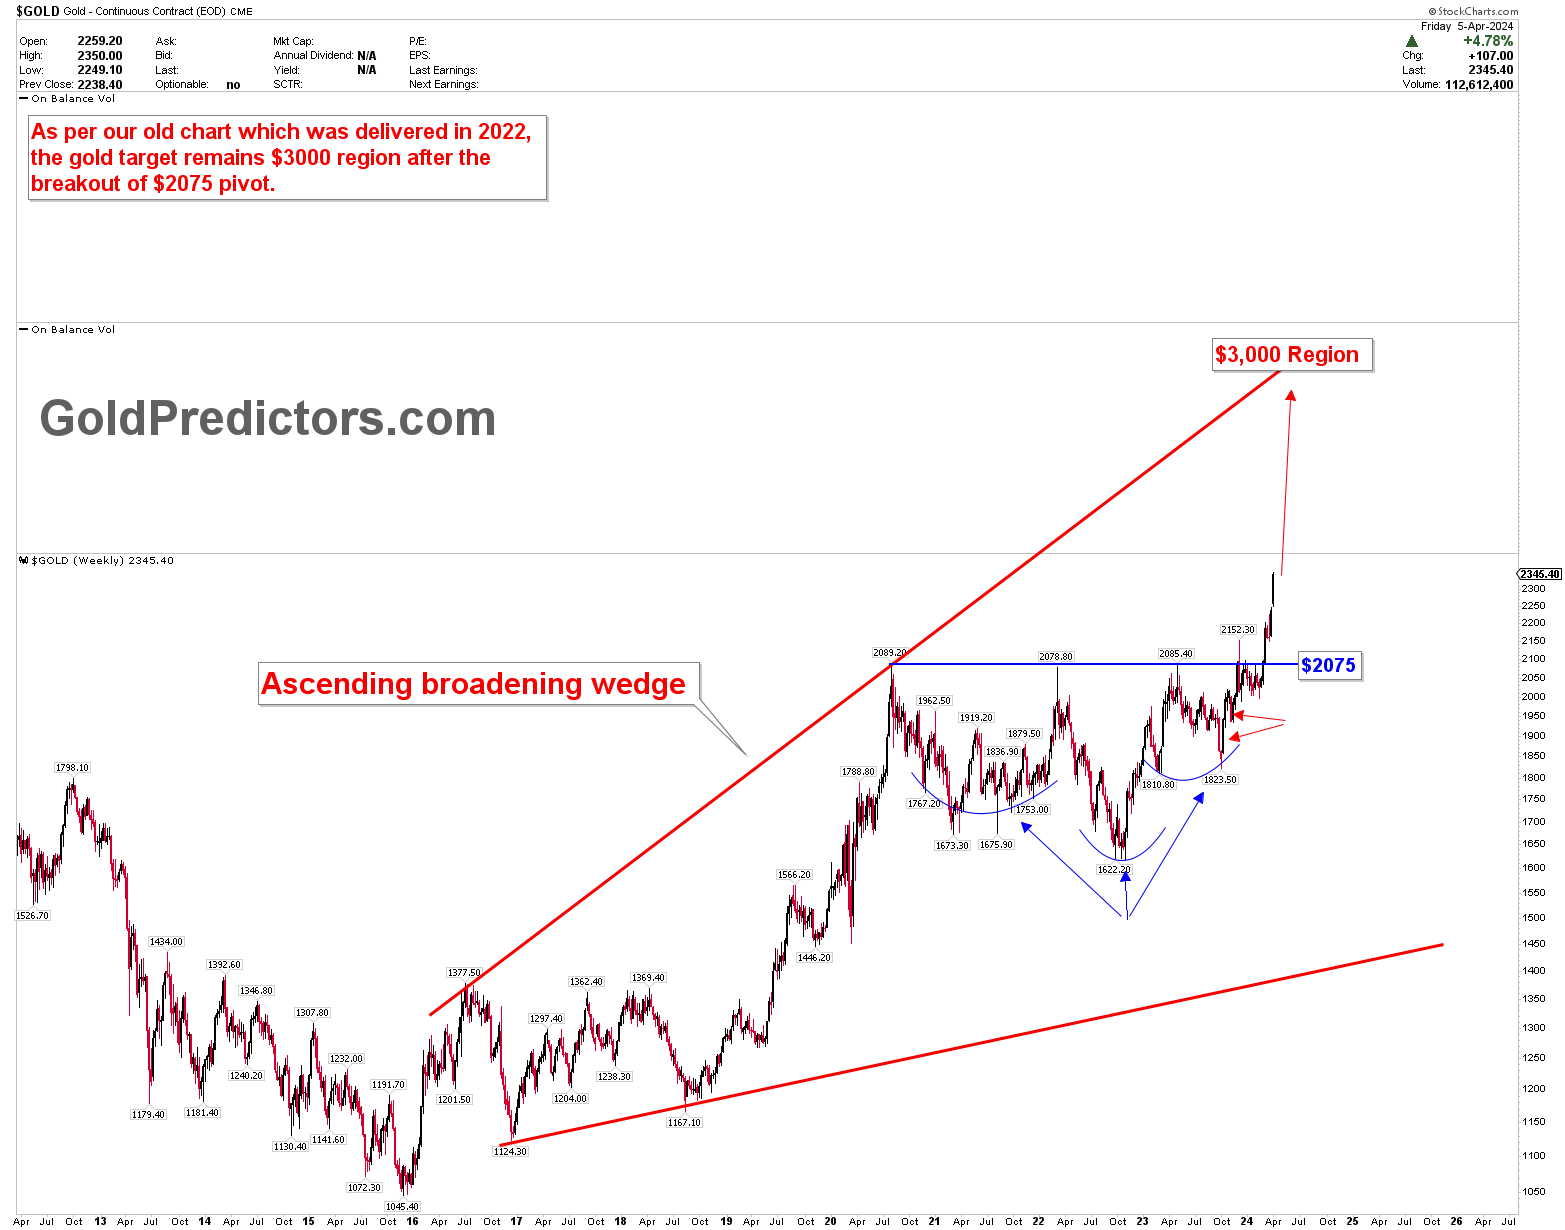
The gold market started a strong rally in 2024, which is just the beginning of a new wave and is expected to continue increasing prices. Following years of bullish price action, the market has finally shattered the long-term pivot of $2,075. This pivot has been discussed with experts and analysts for several years. This breakout on the yearly chart is a testament to the dynamic nature of the gold market. This reflects the significant shift that could redefine investment strategies for years to come.
Historically, the pivot was identified through an in-depth examination of long-term cycles in the gold market, focusing on the $1,680 inflection point. This point was projected to serve as a strong long-term bottom, a proven accurate prediction by Gold Predictors. The journey to this breakout began after the COVID-19 pandemic in 2020, setting the stage for five years of consolidation that has mapped the bullish price action on the long term charts.
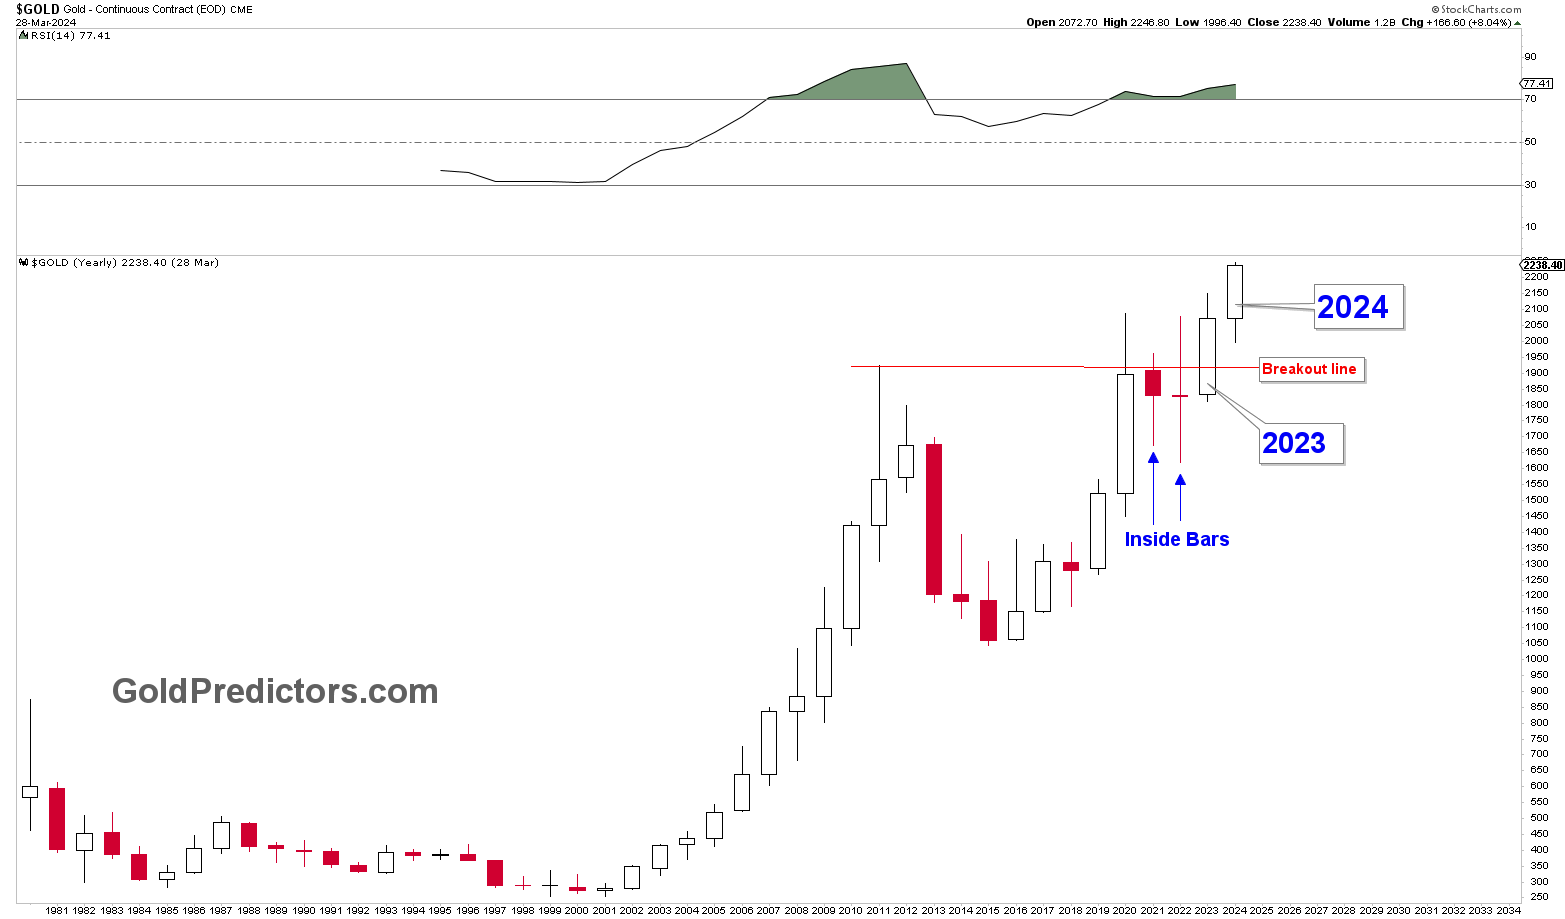
The yearly candles for 2021 and 2022, characterized as inside bars, signaled price compression, hinting at the pent-up energy awaiting release, as shown in the chart above. This price compression resulted in a price surge, a phenomenon that has begun to unfold. The year 2023 served as a turning point, with a solid yearly candle closing at higher levels and breaching the breakout line, indicating a bullish continuation in the coming years.
Understanding The Breakout of Gold Inverted Head & Shoulders
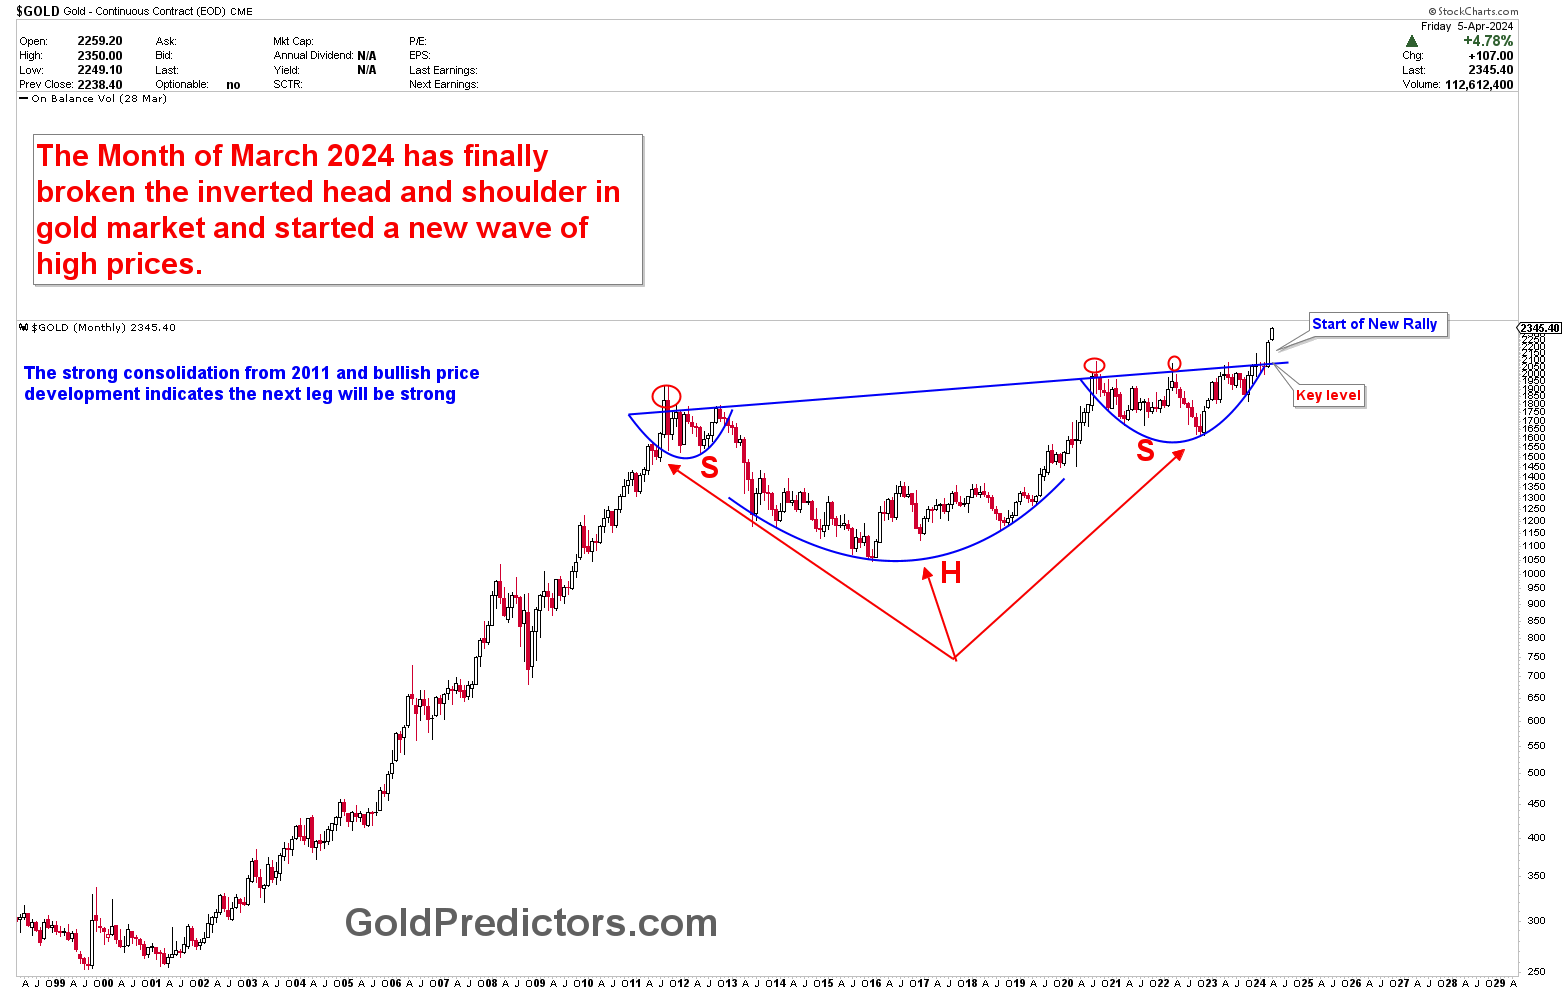
The monthly chart shows further insights into the long-term market, which shows the break above the long-term inverted head and shoulders pattern. This bullish pattern shows several attempts at breaking the neckline until March 2024, when the market closed above the breakout line. This development reinforces the bullish sentiment and paves the way for a continued rally in the months ahead.
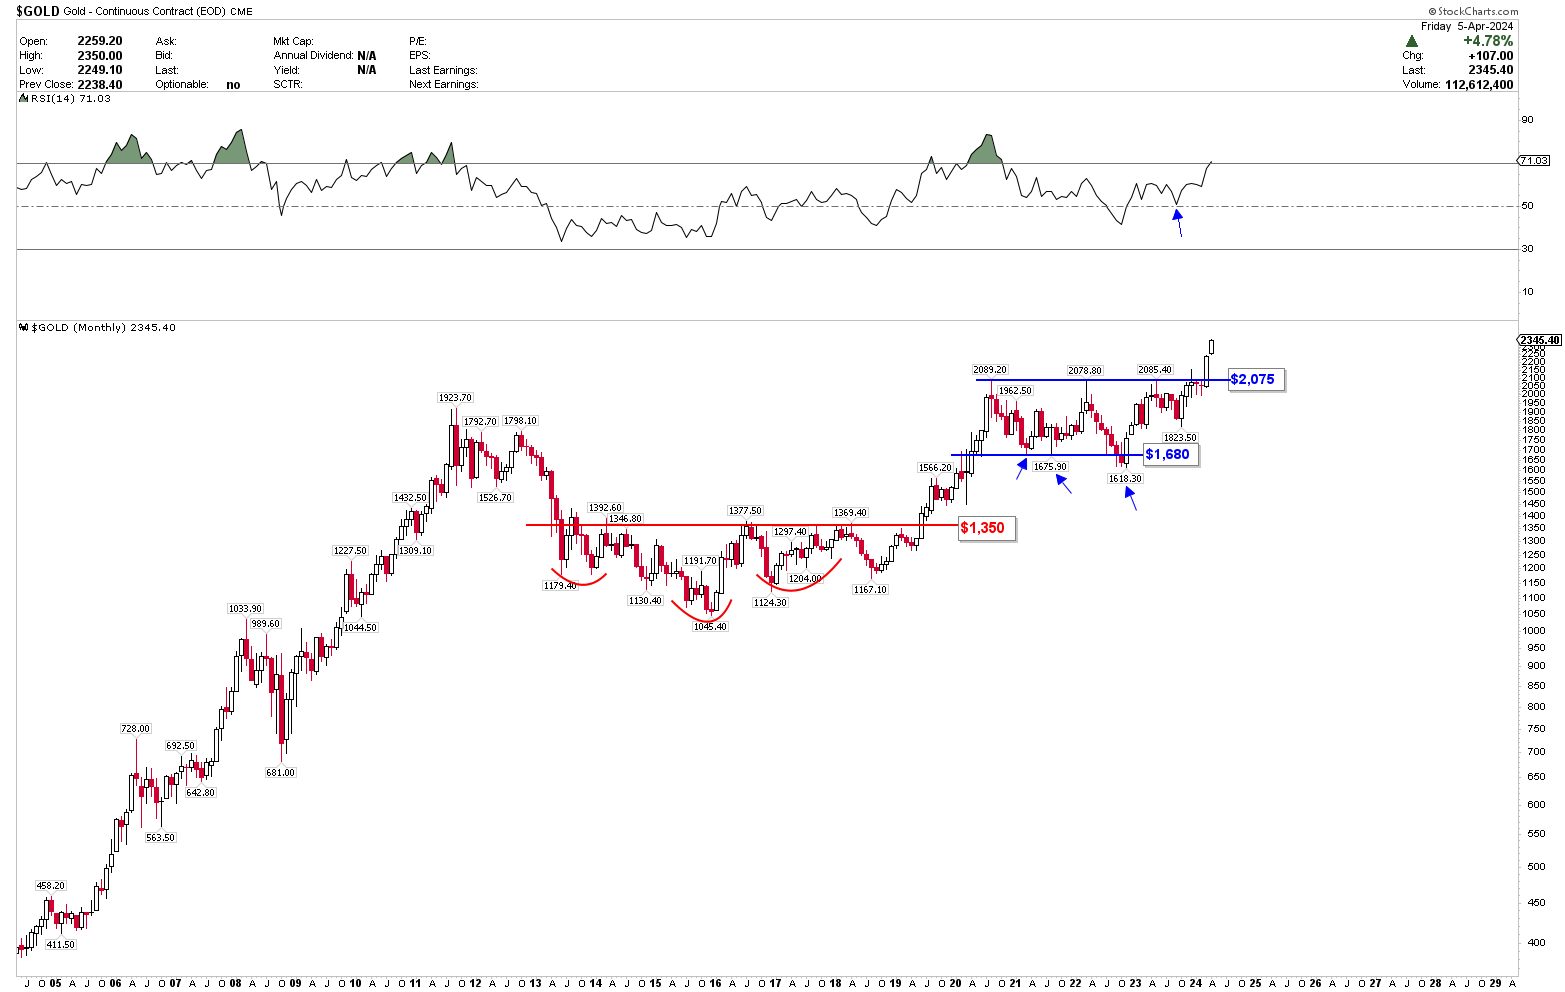
The period of price correction that followed was not viewed with trepidation but rather as a golden opportunity for traders and investors. These corrections are ideal moments to engage with the market, underpinning the strategy that every dip is a buying opportunity in the current climate. This mindset has been bolstered by another bullish setup indicated on a monthly chart, showcasing a consolidation phase between $2,075 and $1,680, as discussed in 2022. The eventual breakout above $2,075, following the inverted head and shoulders pattern, signifies a departure from the long-term trend, setting the stage for potentially higher prices.
The significance of this breakthrough cannot ignored. For over a decade, the gold market has presented unparalleled opportunities for those with the foresight and patience to navigate its cycles. With the $2,075 mark breach, the market is signaling a shift that could redefine the landscape for gold traders and investors. This development is not just a reflection of past patterns but a beacon indicating the future direction of the gold market.
Evaluating the Gold Market Targets
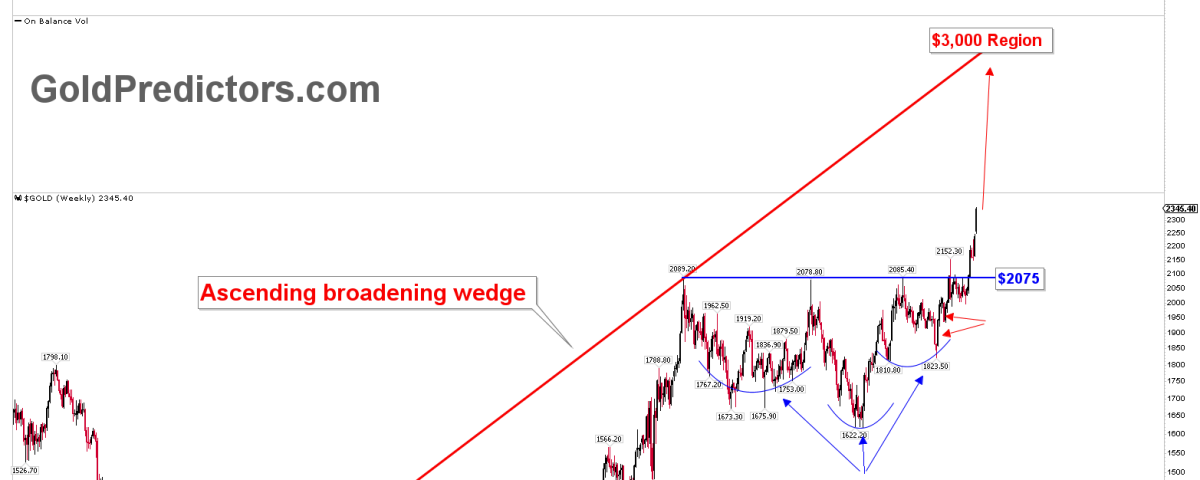
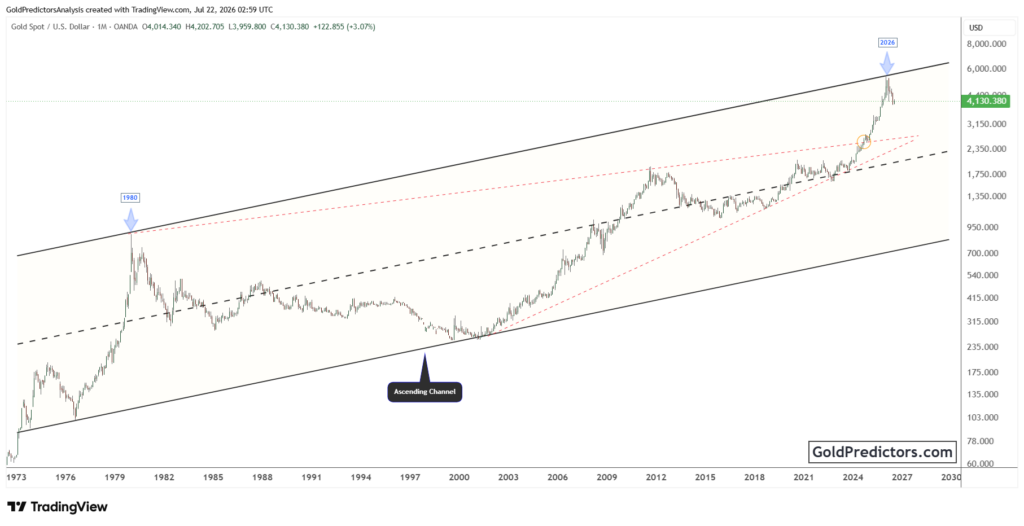
Given that the gold market is experiencing a solid bullish trend with steadily rising prices, pinpointing exact price targets becomes challenging. However, it’s noticeable that the ascending broadening wedge pattern, shared with premium members in 2022, has established a foundation with an inverted head and shoulders formation. The breach above $2,075 paves the way for prices to ascend toward the upper limit of the ascending broadening wedge, situated in the vicinity of $3,000. Should prices swiftly approach this area, a significant price correction may ensue. This rally is likely marked by considerable volatility, suggesting that price corrections could occur intermittently.
However, this optimistic outlook comes with caution regarding market volatility and the inherent risks of trading. The importance of prudent money management strategies cannot be understated. As the market ventures into uncharted territory, managing risks effectively will be paramount for those looking to capitalize on emerging opportunities.
In conclusion, the gold market’s breakthrough above the $2,075 pivot marks the beginning of a new chapter, likely characterized by sustained growth and promising prospects. As we look ahead, the strategies that investors and traders adopt in response to this development will be crucial in determining their success in navigating the evolving landscape of the gold market. The journey ahead promises to be as rewarding as it is challenging, heralding a new era of opportunities in the world of gold trading.
The Gold Market will offer the best trading opportunities in 2024. Please subscribe to the link below to receive short-term and medium-term trading alerts for gold and silver.