


The Gold Market Bullish Outlook Amid a Weakening Dollar and Inverted Treasury Yield Curve
Today’s gold market finds itself at an interesting crossroads, shaped by a set of intersecting economic conditions. With the Treasury yield curve inverting, the Dollar in a bearish trend, and gold prices adjusting downwards from key resistance levels, the landscape for gold investors is certainly evolving. The Treasury yield curve, a reliable barometer of economic health, has inverted, registering a 10-Year minus 3-Month spread at its lowest level (-1.49%) since 1981. An inverted yield curve signifies that long-term debt instruments have a lower yield than short-term debt instruments of the same credit quality, an uncommon situation that often precedes economic recessions. However, historical trends suggest that a recession usually follows only after this spread recovers above zero, signaling when the Federal Reserve commences cutting short-term rates. Therefore, it can be inferred that any impending recession may not materialize until 2024.
Simultaneously, the US Dollar finds itself on the defensive. Currently testing support at 101, the Dollar’s recent rally appears to be a fleeting “dead cat bounce”, suggesting the uptick may not last. This term refers to a temporary recovery in value after a substantial fall, likened to the notion that even a dead cat will bounce if it falls from a great height. Given the current market conditions, it’s plausible that the Dollar will test the support level again, and a breach would forewarn of a further primary decline.
Technical Outlook for Gold Market
A depreciating Dollar is a generally bullish indicator for the gold market. Gold and the Dollar have an inverse relationship; as the Dollar weakens, gold, denominated in Dollars, becomes cheaper for holders of other currencies, pushing demand, and thus prices, higher.
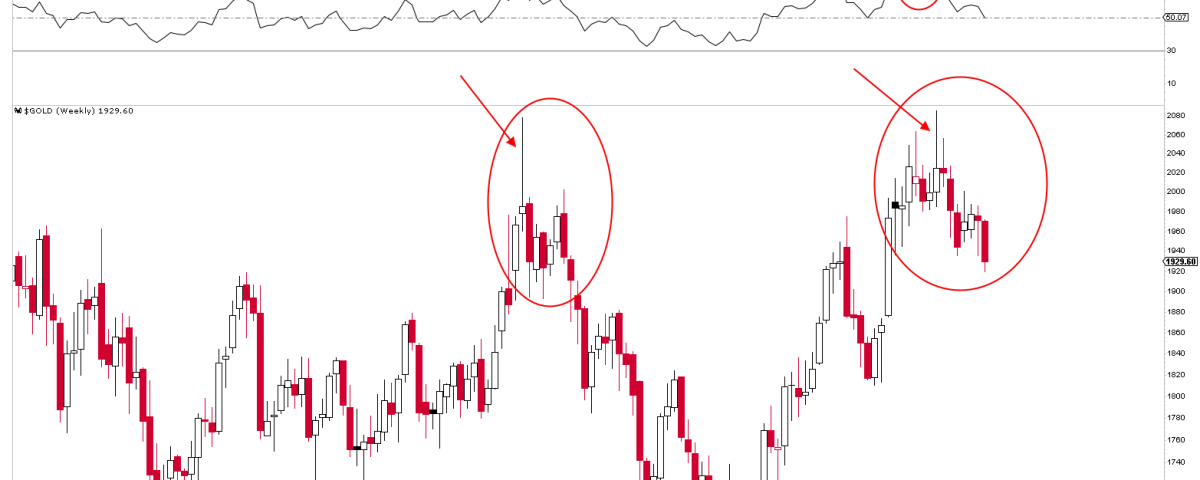
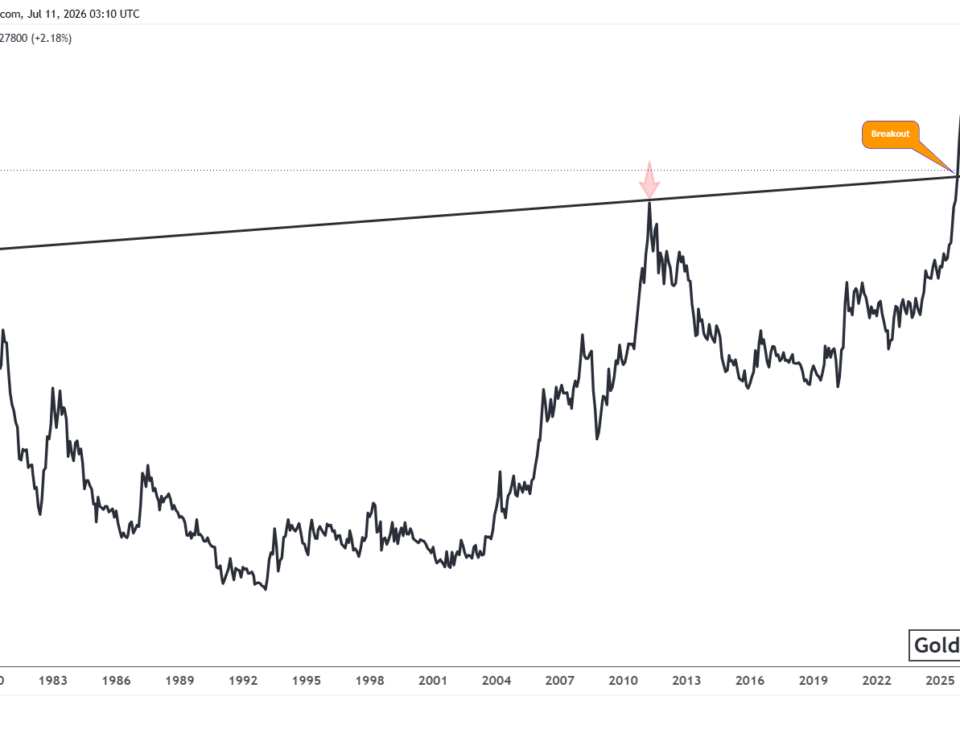
However, while the Dollar’s decline should support a rise in gold prices, the gold market has recently seen a pullback from the key resistance level of $2,075. This descent aligns with market expectations, with the anticipated support range for this drop previously identified as the $1,900 to $1,950 region.
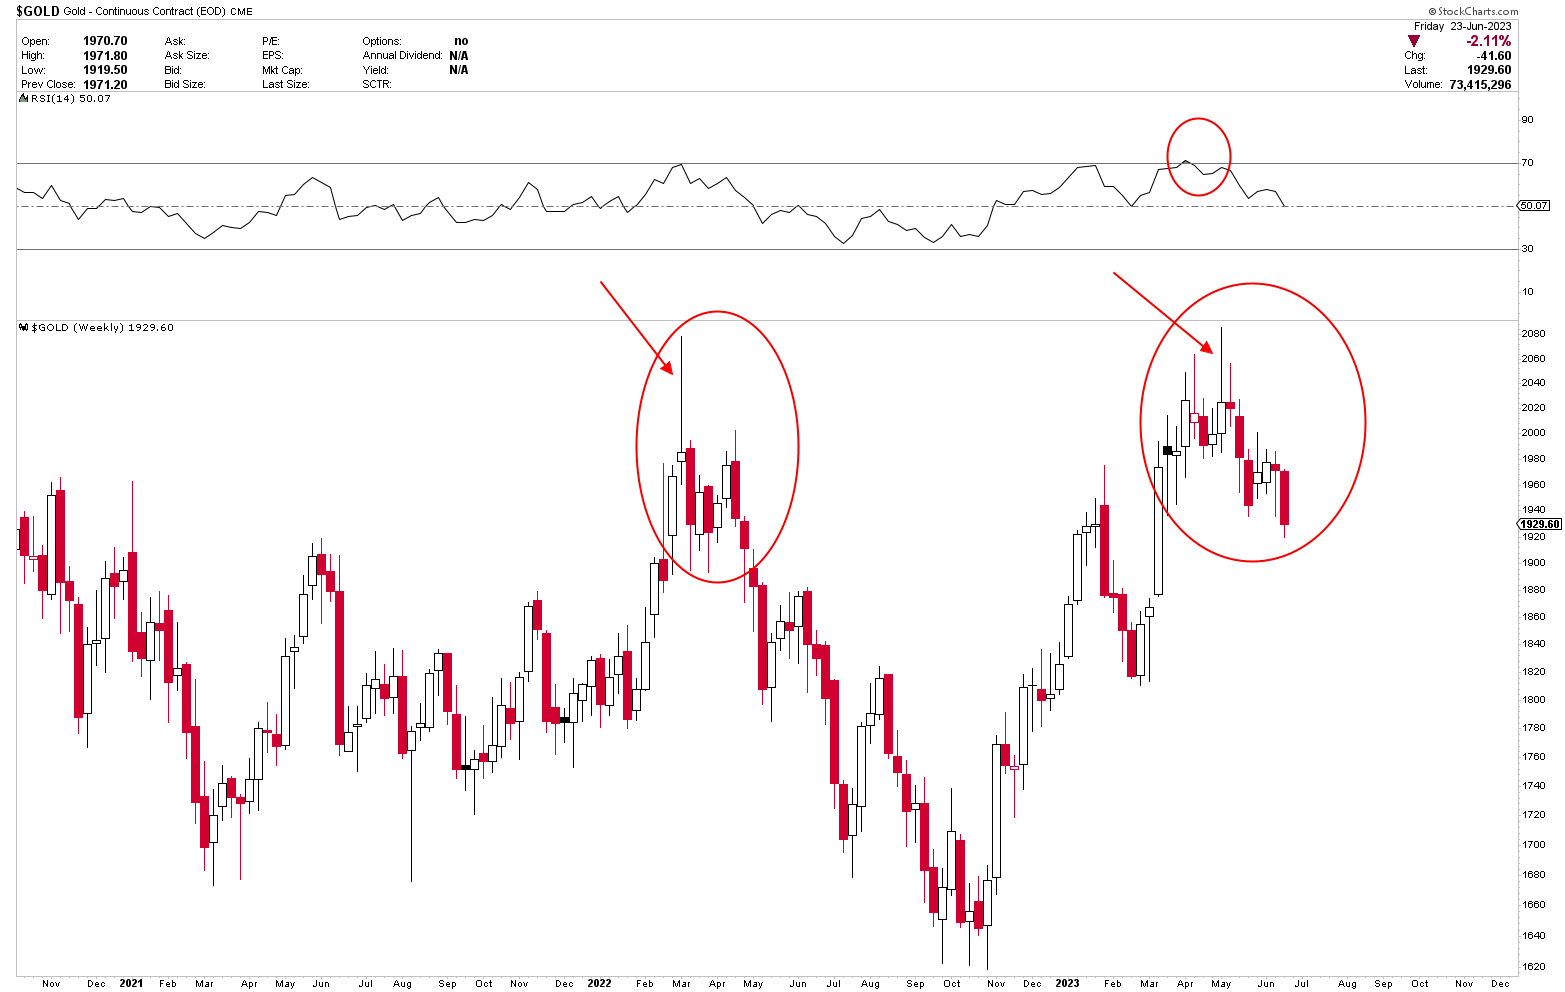
Upon completion of this downward correction, gold prices are anticipated to climb again, marking a potential opportunity for investors. Currently, gold is testing support at the $1,900 level. If this support is breached, prices may drop to the next support level of $1,850, which is interestingly earmarked as the point that will trigger the next buy signal.
The intersection of these three macroeconomic factors – the inverted Treasury yield curve, the bearish Dollar trend, and the correction in gold prices – create a compelling narrative for the gold market. While the short-term movements may seem bearish for gold, the longer-term outlook projects potential opportunities for investors. Any further dip in prices may serve as an entry point for long-term investors looking to capitalize on future price rises once the correction concludes.
Conclusion
In conclusion, the gold market is entering a dynamic period, shaped by a complex interplay of macroeconomic factors. The inverted yield curve and weakening Dollar, coupled with short-term adjustments in gold prices, suggest potential opportunities for those who can expertly navigate the intricate gold market. As always, a thorough understanding of these economic indicators and astute market timing is essential for investors hoping to leverage these potential long-term gains in the gold market. Gold has already hit $1,900 which is a strong support. Any further decline below here would take the price to $1,850 where a strong buy signal might emerge.
For a comprehensive guide to the gold and silver market, and to receive timely and accurate trading signals, consider subscribing to our service. To begin your investment journey, just follow the link provided below:
Stay ahead of the curve and let us guide you towards smarter investment decisions in the gold and silver market. We look forward to welcoming you to our community of insightful investors.