


US Dollar Index Tests Strong Resistance
The US Dollar Index starts the week on a stronger note after suffering its first weekly loss in three weeks, with buyers approaching 112.00 during Monday’s Asian session. As a result, the dollar index vs the six major currencies rebounded from its lowest level two weeks earlier in the day. In other events, the news that North and South Korea fired warning shots near their disputed western sea border on Monday seems to have helped US dollar purchasers recently. Concerns that China President Xi Jinping would not hesitate to intensify geopolitical issues with the US over Taiwan may fall into the same category. The answer might be Jinping’s dominant performance at the annual Communist Party Congress after securing a third consecutive term.
The answer might be Jinping’s dominant performance at the annual Communist Party Congress after securing a third consecutive term. Nonetheless, the US dollar index fell sharply on Friday, exacerbating the first weekly decline in three weeks as aggressive Fed bets withdrew after mixed data. In the same manner, Chicago Fed President Charles Evans suggested that rates would need to be raised higher and held for an extended period. However, Nick Timiraos, Chief Economics Correspondent at The Wall Street Journal (WSJ), wrote that Federal Reserve officials are on track to raise interest rates by 75 basis points (bps) at their November meeting and will likely debate whether and how to signal plans to approve a minor increase in December. Among these trades, US stocks achieved their largest weekly gains in four months, while the US 10-year Treasury yield gained 5% in a week, resetting a 14-year high, despite minor losses on Friday. In addition, the CME’s FedWatch Tool predicted a roughly 88% likelihood of a 75-basis point rate rise in November, down from nearly 95% earlier in the week.
Technical Outlook for USD Index
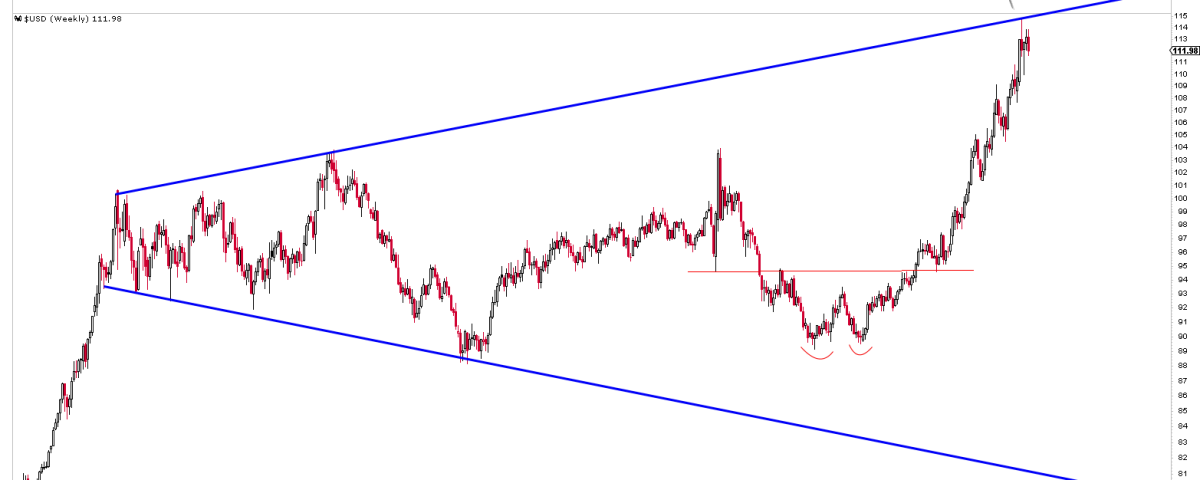
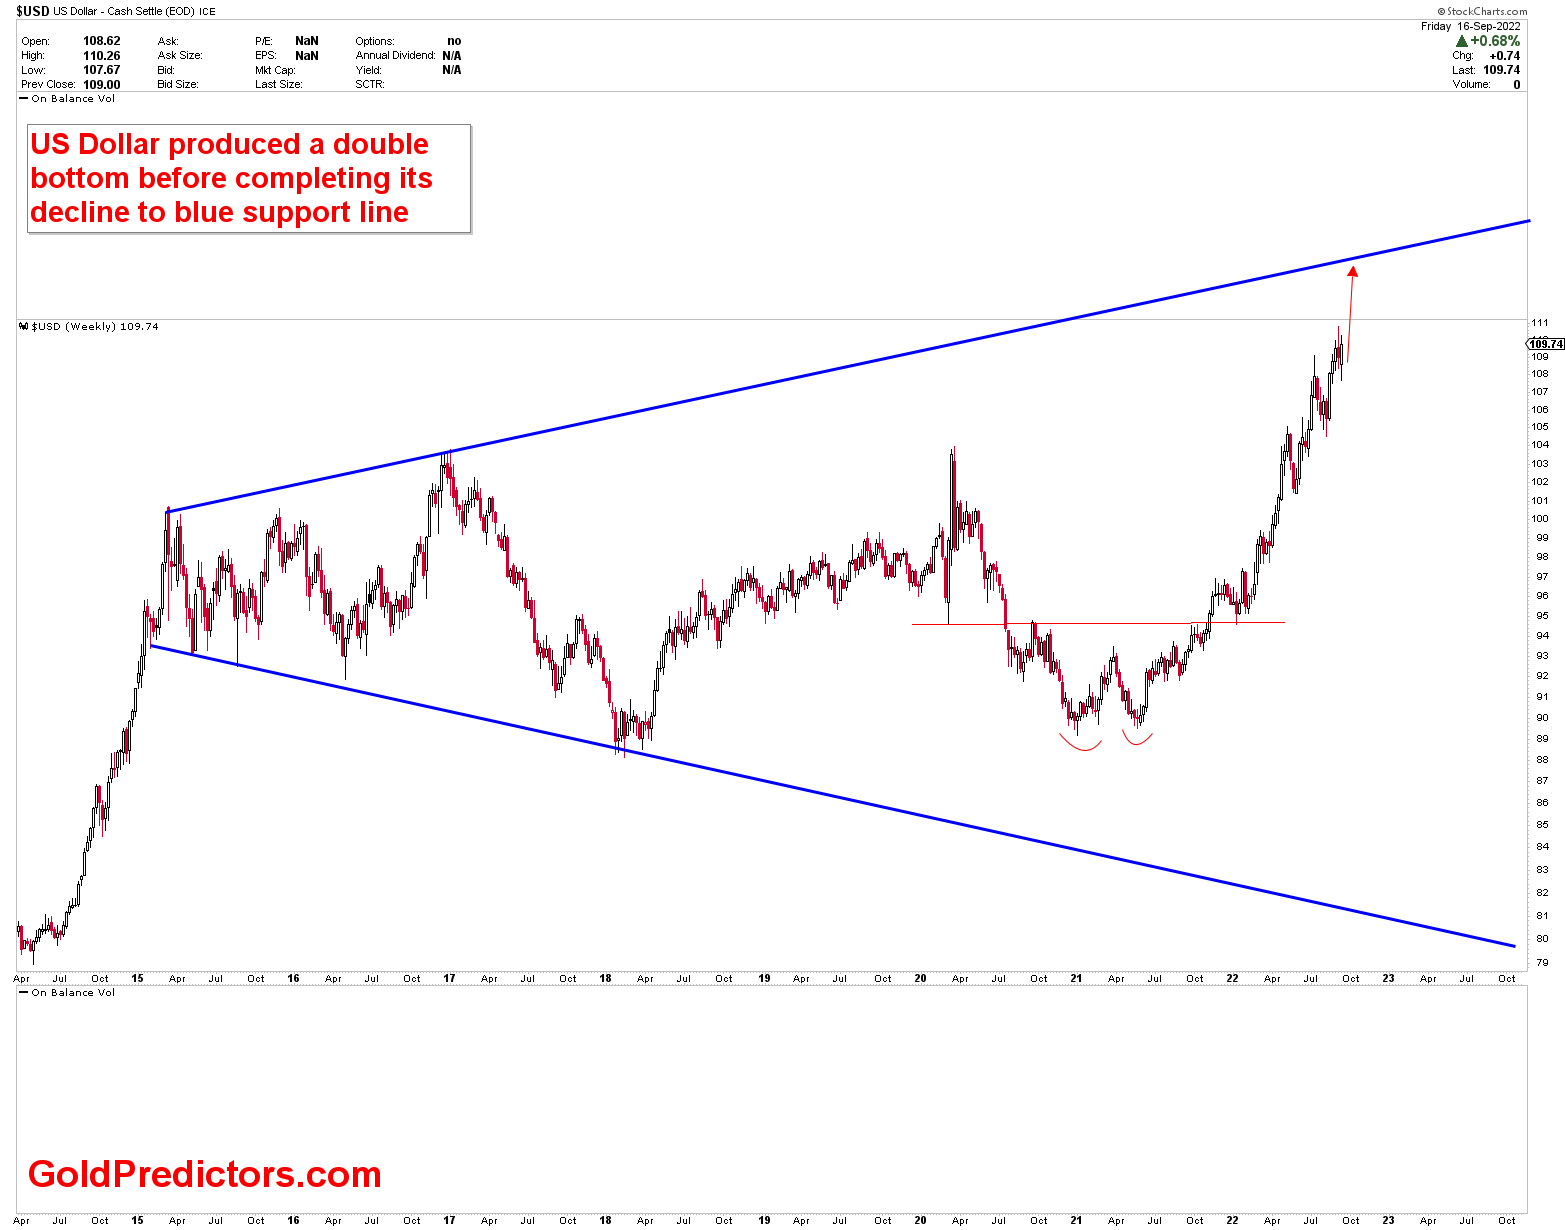
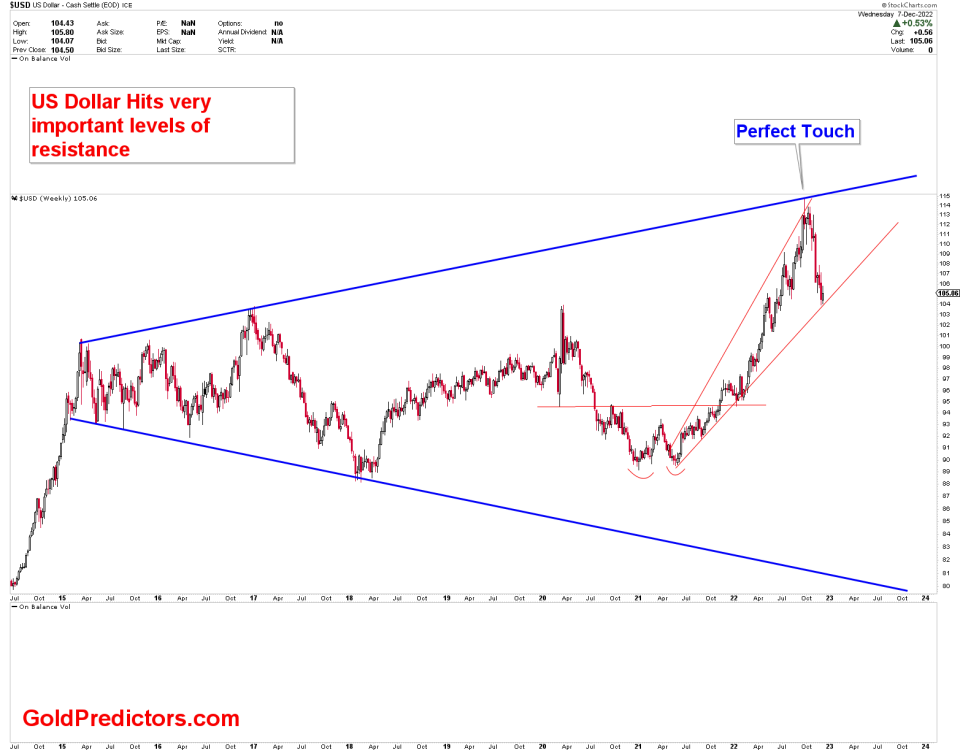
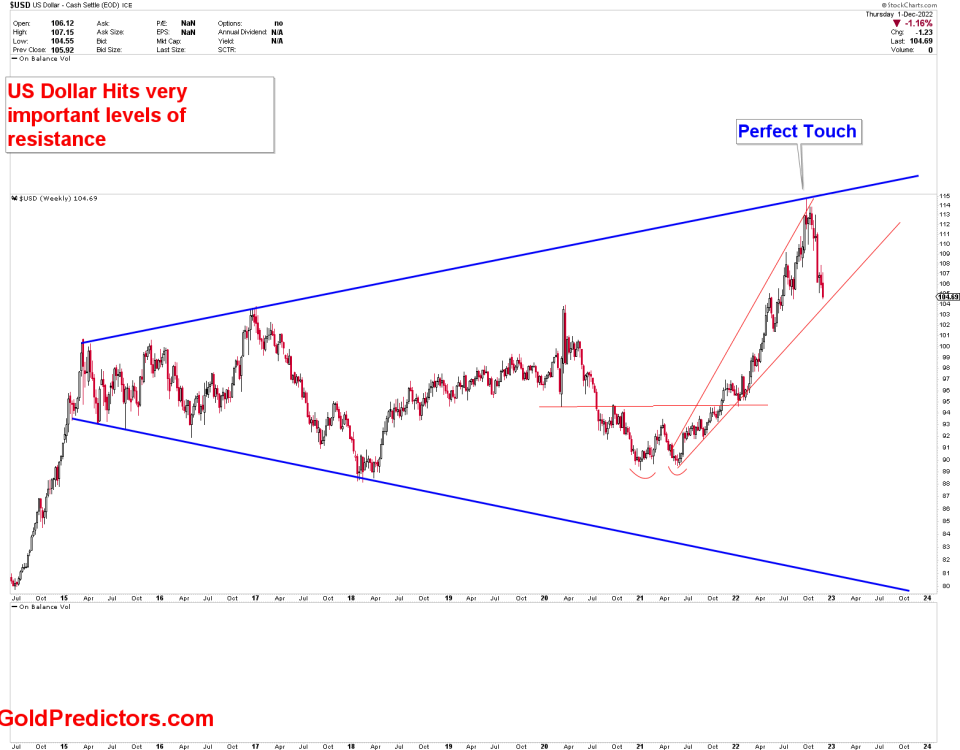
According to our expectations over the last few months, the US Dollar index remains bullish. However, the index’s bullish bias has led it to the most significant resistance area on both the weekly and monthly timeframes. The chart discussed a few weeks ago is reproduced below. The chart depicts the symmetrical broadening wedge that started in 2015. The chart was discussed, and we anticipated that this wedge would be tested, followed by a pullback. The formation of the double bottom before touching the downtrend line of the symmetrical broadening wedge, which is a strongly bullish condition, is the reason for the strong bullish bias in the US dollar index.
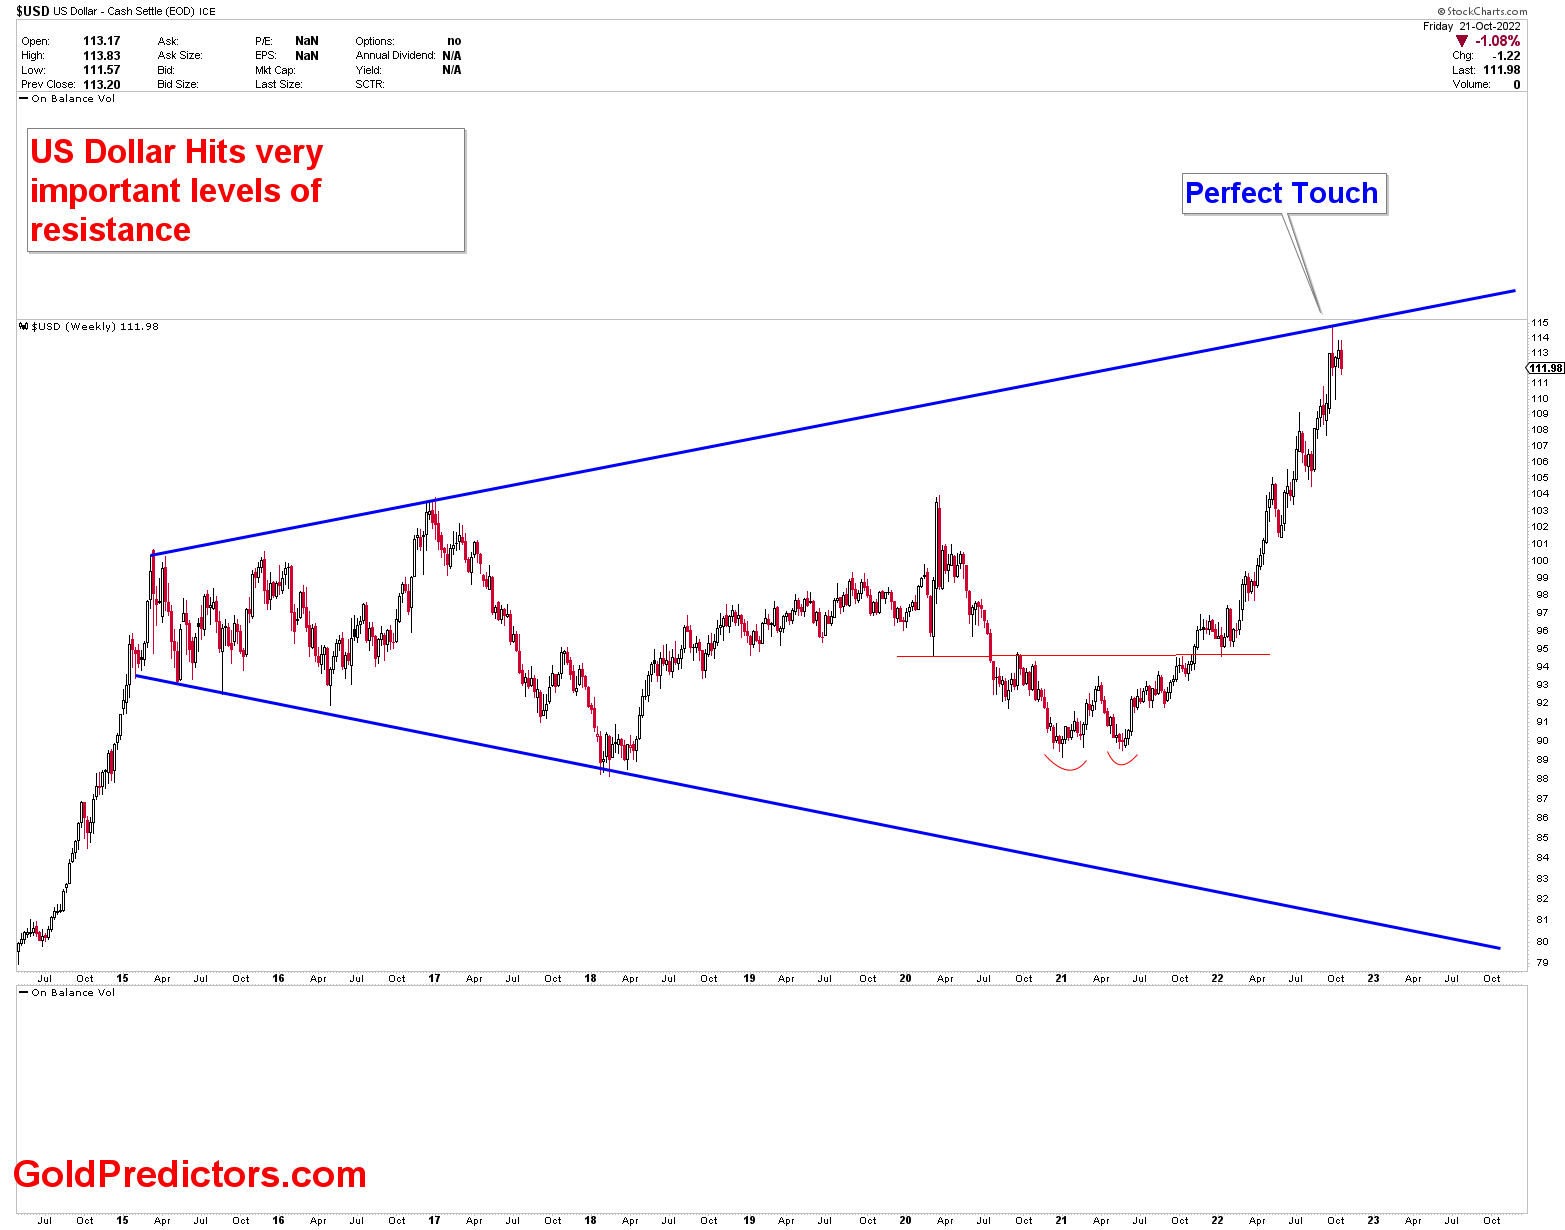
The updated chart shows that the price began to pull back after hitting the strong area of resistance and making a perfect touch at the symmetrical broadening wedge. This is a strong area of resistance for the US dollar index, with the potential for price fluctuations.
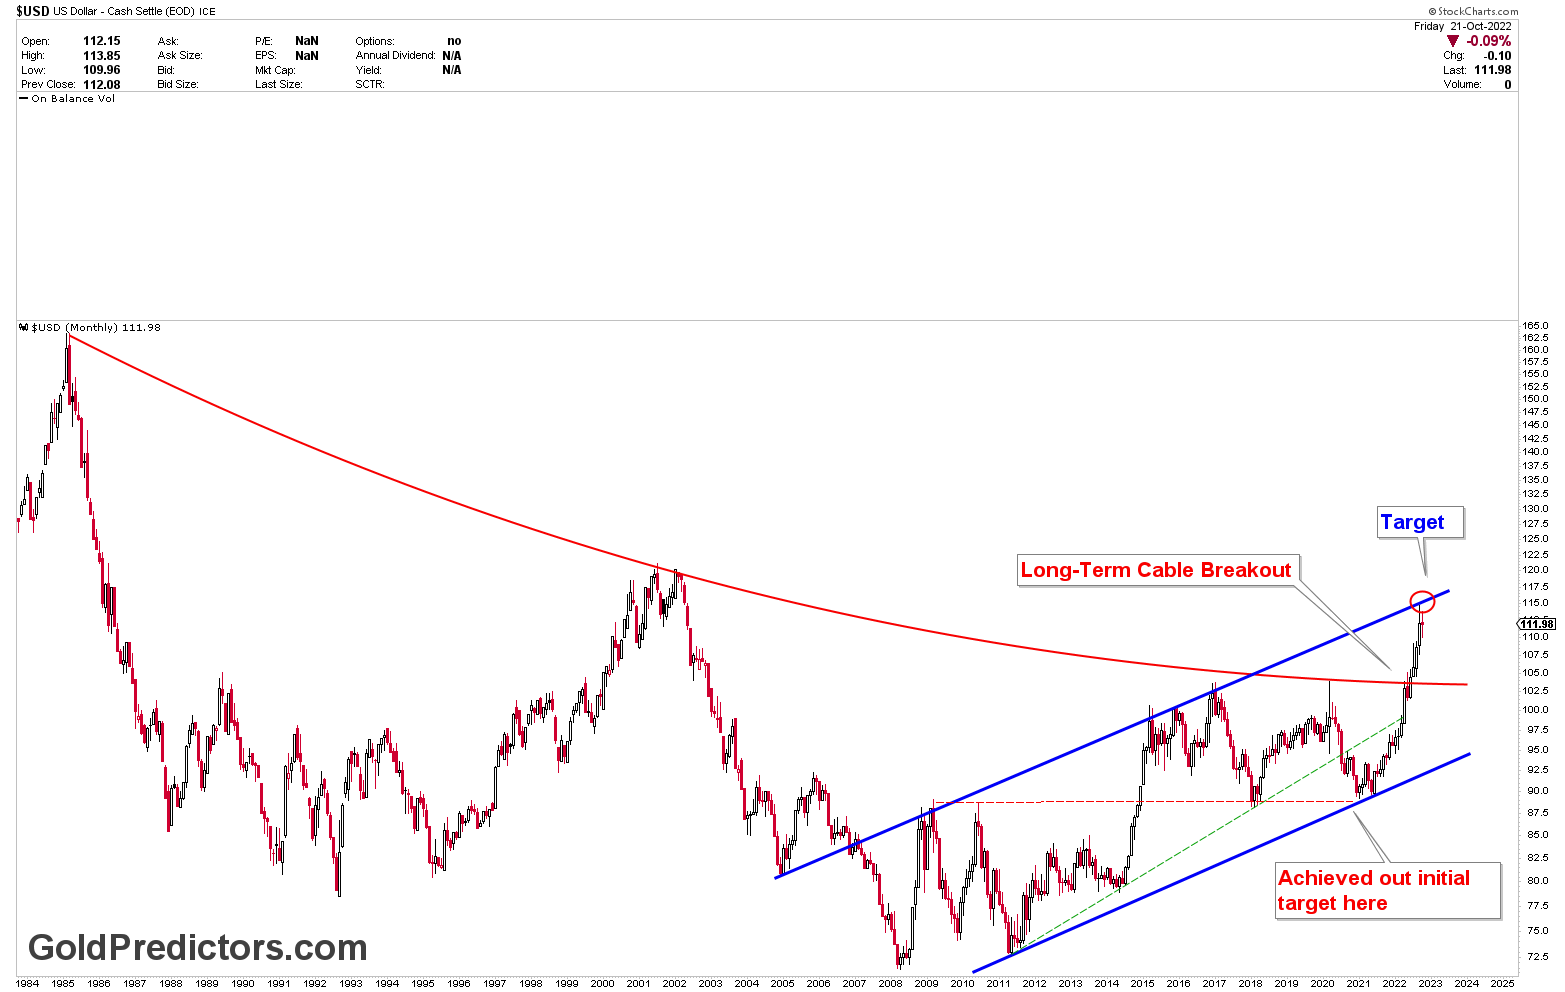
Monthly Outlook for the US dollar Index
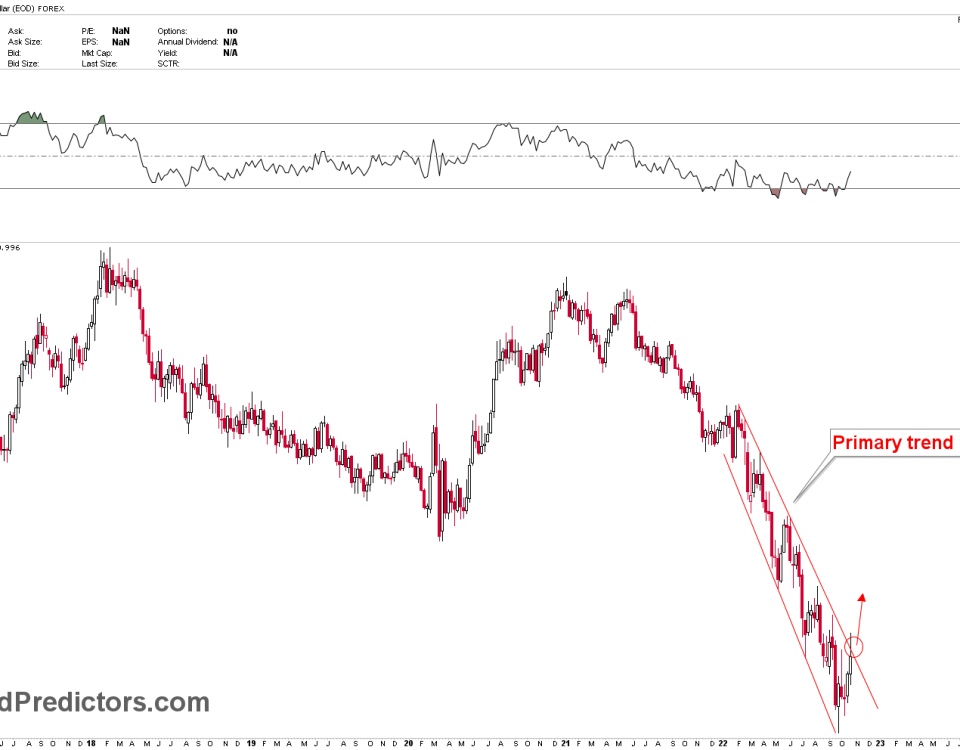
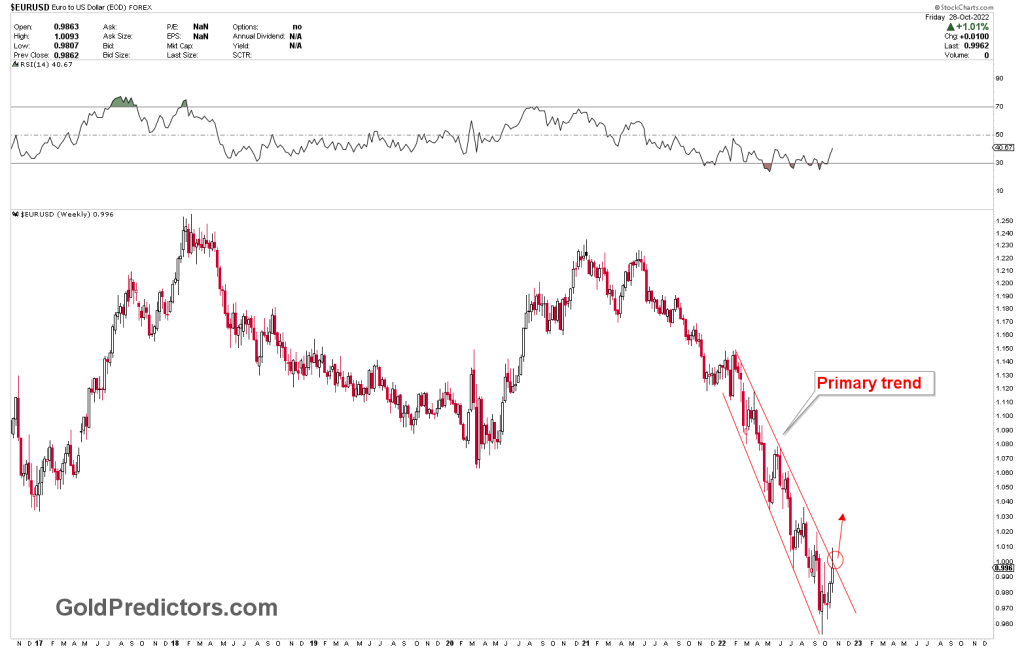
Monthly charts for the US dollar index show the same scenario, with very strong levels of resistance. The long-term cable has also broken, and the index is currently testing the blue rising channel.